
Measurement of Neighbourhood Walkability in Enugu, Nigeria.
- Chukwuemeka Orji
- Ebenezer Ngene
- Somkenechi Sophia Unachukwu
- Charles Emeka Abaekih
- 379-394
- Jun 15, 2024
- Urban and Regional Planning
Measurement of Neighbourhood Walkability in Enugu, Nigeria.
Chukwuemeka Orji1*, Ebenezer Ngene2, Somkenechi Sophia Unachukwu1, Charles Emeka Abaekih1
1Department of Urban and Regional Planning, Nnamdi Azikiwe University, Awka, Nigeria.
2Department of Urban and Regional Planning, Enugu State University of Science and Technology, Enugu, Nigeria.
DOI : https://doi.org/10.51584/IJRIAS.2024.905033
Received: 29 April 2024; Revised: 13 May 2024; Accepted: 17 May 2024; Published: 15 June 2024
ABSTRACT
Walking has many benefits, from reducing air pollution, traffic congestion and resource consumption to solving obesity and other health problems. However, the dramatic growth in the number of automobiles and the frequency of their use in most Nigerian cities, as well as the general neglect of pedestrian needs in roadway design and land-use planning, have increased the vulnerability of pedestrians to several risk factors that may constrain walkability. This study measured the walkability of selected residential neighbourhoods in Enugu metropolis, using some neighbourhood built-environment characteristics, specifically residential density, land use mix and street connectivity as indicators. The study was based on the concept of walkability and the hierarchy of walking needs. A descriptive research design was adopted, and purposive sampling technique was used to select three residential neighbourhoods, one from each of the three Local Government Areas that make up Enugu metropolis, each representing low, medium, and high-density residential categories, respectively. Aerial images of the selected residential neighbourhoods were captured and downloaded from the Google Earth application, and the ArcGIS 10.2 application was used to digitise and analyse the images. GIS and a composite walkability index generated from the GIS analysis were used to measure the walkability of the selected residential neighbourhoods. The study revealed that New Haven, a medium-density residential neighbourhood, has the highest walkability score among the selected neighbourhoods and is the most walkable neighbourhood in the study area. New Haven was closely followed by Garriki, a high-density neighbourhood, and Trans-Ekulu, a low-density residential neighbourhood. The study further revealed that homogenous land use and the unavailability of walking facilities are significant factors that inhibit walkability in the study area. The inclusion of pedestrian walkways and cyclist lanes in road designs, the establishment of organised commercial and retail outlets, especially in low-density residential neighbourhoods, rehabilitation and proper maintenance of the roads, especially in the inner streets, provision and adequate maintenance of walking facilities and street furniture, location of recreational facilities at proximity to homes, organisation and regulation of the number of public transportation modes within the residential neighbourhoods, and the provision of street lightings along the streets within the neighbourhoods was recommended as ways of improving and enhancing walkability in the study area.
Keywords: Built-Environment, Connectivity, Density, Diversity, Neighbourhood, Pedestrian, Sustainable Transportation, Walking.
INTRODUCTION
Walking is the elementary way people move around and reach their destinations. Walking has also been linked to numerous advantages, including reducing resource use, road congestion, air pollution, and addressing obesity and other health issues. It has been considered essential to the creation of liveable communities, which promote neighbourly interactions and make cities a more pleasant and secure place to live. The walkability of a neighbourhood/community has been conceptualised as “the extent to which characteristics of the built environment and land use may or may not be conducive for residents in an area to walk, either for leisure, exercise or recreation, to access services, or to travel to work” (Leslie et al., 2007) or in simpler terms, “the extent to which the built-environment is walking-friendly” (Abley & Turner 2011). Although the study of the connection between the built environment and walking behaviour is relatively new, it has caught the interest of numerous research fields, including transportation planning, urban planning, and public health. However, researchers are still working to understand this connection. For questions such as “Which factors of the built environment affect which type of walking, which of them are more important and to what degree?”, there is still a lack of empirical evidence to provide the answer.
As urban areas grow to accommodate a rising population, traffic congestion and air pollution pose serious health issues for cities worldwide. According to the UNHabitat’s World Cities Report (2022), the transportation industry accounted for 27% of worldwide greenhouse gas emissions in 2019. The report further stated that Three-quarters of global greenhouse gas emissions from the transport sector are produced by road transport alone. This makes vehicle transport emissions a particular concern. Consequently, pedestrians are more vulnerable to various risk factors because of the rapid expansion in the number of automobiles, the frequency with which they are used, and the general neglect of pedestrian needs in roadway design and land-use planning. A body of practice has shown that walkable neighbourhood is associated with reduced vehicular travel, increased levels of physical activity, and decreased vehicle pollution exposure (Frank & Engelke, 2001; Handy, 2004; Lee, & Moudon, 2004; Chan & Li, 2022). Meanwhile, it is also associated with the mental health of residents, sense of community, and general well-being (Leyden, 2003; Toit, 2007; Paranagamage, 2010; Silva & Lucchesi, 2022). Walkability is a concept that translates to the extent to which the urban environment is pedestrian-friendly. By evaluating or quantifying it, planning professionals may be able to address the quality of the pedestrian environment and the variables that may support the development of more integrated, aesthetically pleasing, and walkable communities. This study aims to measure walkability in selected residential neighbourhoods in Enugu, Nigeria.
CONCEPTUAL FRAMEWORK AND LITERATURE REVIEW
A. Conceptual Framework
Walking and walkability are increasing in prevalence in both planning and health fields. However, these terms do not have the same meaning; walking is different from walkability in that walking refers to a form of physical activity and mode of transportation, while walkability is used to describe the physical environment in which walking takes place (Glanz, 2011). The portion of the built environment often referred to when studying walkability is the space created by a neighbourhood’s streets, streetscapes, and buildings. There are several reasons for studying walkability, but the two most prominent issues centre around maintaining or increasing human health (leisure walking) and sustainability (utilitarian walking). While the distinction between leisure and utilitarian walking may be easy to define, it has been noted that defining walkability is not as simple (Forsyth & Southworth, 2008). Thus, this study is anchored on the concept of walkability, and the hierarchy of walking needs for a proper understanding of walkability.
i. The Concept of Walkability
The walkability of a community has been conceptualised as “the extent to which characteristics of the built environment and land use may or may not be conducive for residents in an area to walk, either for leisure, exercise or recreation, to access services, or to travel to work” (Leslie, et al., 2007), or in simpler terms, “the extent to which the built-environment is walking friendly” (Abley & Turner 2011). The latter definition will be used in the scope of this research, to imply the clarification of what can constitute a “walking friendly” environment. This question has been addressed in the work by Transport for London (COST 358, 2010), where pedestrian concerns and needs were classified under five main factors. These factors have been referred to as the 5Cs and have been considered in accordance with the concept of walkability. The five “Cs” are here defined in succession (COST 358, 2010):
- Connectivity: The extent to which the pedestrian network links to key trip origins and destinations and the extent of linkages between different routes on the network.
- Conviviality: The extent to which walking is a pleasant activity in terms of interaction with people, the built and natural environment, and other road users.
- Conspicuous: The extent to which walking routes and public spaces feel safe and inviting for pedestrians in terms of clear and legible signing and information.
- Comfortability: The extent to which walking is accommodated to the competences and abilities of all pedestrians.
- Convenience: The extent to which walking is possible and able to compete with other modes of transport in terms of efficiency (time, money, and space).
In the scope of this study, the above definitions will be adopted.
ii. The Hierarchy of Walking Needs
Researchers have identified many possible characteristics of the built environment that may impact convenience, safety, etc. It is likely that these characteristics do not all matter equally. Also, walking for different purposes, such as recreation (leisure) versus transportation (utilitarian), may depend upon different characteristics of the built environment. Alfonzo (2005) posits a hierarchy of walking needs, modelled after Maslow’s hierarchy of human needs. In this model, accessibility is the most fundamental aspect of the built environment in terms of its impact on the decision of whether to walk. Access must be assured before other aspects of the built environment can be considered in terms of decisions regarding walking. After accessibility, safety is proposed as the next most crucial built-environment characteristic, followed by comfort and pleasurability. Unless “lower order” needs (such as access or safety) are met to a satisfactory extent, individuals will not consider “higher order” aspects of the built environment (such as comfort or pleasurability) in making decisions about whether to walk. This model also suggests that a portative analysis of the effect of the built environment on walking does not provide a thorough understanding of how various urban design elements may interact to create a place that facilitates more walking (Alfonzo, 2005). Instead, various grouped aspects of the built environment impact the decision to walk, and some urban design variables don’t factor in unless other elements of the built environment are already in place. This becomes important when making decisions concerning design or planning interventions to increase walking. This study considers the hierarchy of walking needs in terms of forming groups of built-environment variables, such as density, diversity, connectivity, and pleasurability, and tries to understand their relative impact on the decision to walk.
B. Literature Review
Walking is the most natural way of getting around; while doing it, the human body exercises physically and mentally. Walking has even more significant benefits at the community level, providing both social and spatial interaction (Cambra, 2012). Cities have grown in population and size, but the pedestrian was tagged as a second-class street user somewhere along the line, and people forgot how to walk and why to walk. In the urban sustainability debate, the role of walking is unavoidable (Cambra, 2012). Walking is often the only way that many people can access everyday activities, yet the streets and public spaces, once meant for pedestrians, struggle with degradation and invasion from private vehicles, with social life being drawn away from them (Krambeck & Shah, 2006; Abley & Turner, 2011).
From a social point of view, walking can be seen as the most equitable means of transportation, as it is cheap and needs only basic infrastructure (Lo, 2009). Walkable environments have been associated with more democratic and “civilised cities” since pedestrian facilities can provide accessibility benefits to a greater portion of the community compared to road or rail improvements. These benefits are extended in terms of population figures and across classes, including children, adults, older people, and low-income groups who may not have the financial capacity to own and operate automobiles (Forsyth & Southworth, 2008). Walking also brings life to streets; liveable streets contribute to safer urban environments. The contribution of walking to community safety, accessibility and social inclusion has emerged as a particular challenge to the design of the urban environment (Evans 2009), as over the past century, pedestrian access has declined steadily in most cities of the world (Forsyth & Southworth, 2008).
From the environmental point of view, walking is a “green” mode of transport, as it has low environmental impact, without air and noise pollution. The presence of walkable environments and transit systems may create alternatives to private car usage, thus reducing traffic congestion, noise, and emissions. From an economic perspective, for pedestrians, walking has little associated cost (Cambra, 2012). In general terms, it can be associated with less energy and resource consumption when compared to other means of transport. Other economic benefits include thriving local businesses such as street shopping and tourism and, at a larger scale, public health savings (Cambra, 2012). How a community is designed and built, such as its transportation system, recreational infrastructure, and commercial facilities, can either support or inhibit opportunities for walkability. However, available data is insufficient for a full assessment of the influence of the built environment on physical activity and sedentary behaviour among urban residents in Nigeria (NHF, 2014). In Nigeria, there is emerging evidence that favourable urban designs, such as increased access to destinations and commercial services, good aesthetic features and safety from crime and controlled traffic, are relevant to the promotion of walkability and physical activity (Oyeyemi et al., 2011; 2012; 2013).
i. Built-Environment Factors Influencing Walking
To this point, the distinction between types of walking has not been made. The general “walking” can be defined as walking for transport, exercise, or pleasure/recreation (Cambra, 2012). This distinction is of relevance because the attributes of the urban environment that influence walking behaviour have been different when relating to walking for transport or walking for exercise/recreation (Leslie et al., 2007). Walking for transport, or utilitarian, becomes a means of reaching a destination, be it a resource, activity, or function, like going to school or to work, shopping, meeting friends, etc. (Cambra, 2012). Walking for pleasure or recreation becomes an end, being for exercise, relaxation, contemplation, etc. Although the latter is of greater importance in terms of physical activity, mobility studies have always paid more attention to utilitarian walking than recreational walking (Schmid, 2006). There have been many interpretations of “built environment”, and the lack of an agreed-upon conceptualisation of the term has been an apparent cause of the inconsistent approach to defining and measuring dimensions of the built environment (Handy, 2005). The “built-environment” concept this research has followed has been the one used by Cervero (1997), which defined built-environment as “the physical features of the urban landscape (i.e., alterations to the natural landscape) that collectively define the public realm, which might be as modest as a sidewalk or a neighbourhood retail shop, or as large as a new town.”
As with the different types of walking, at each spatial scale, different characteristics of the built environment are relevant, and the influence of the built environment on physical activity at one spatial scale may depend on the influence of the built environment at another spatial scale (Handy, 2005). Ewing and Handy (2009) divided the built environment into two dimensions: the objective and the perceived. In urban planning literature, perception is defined as the process of attaining awareness and understanding of sensory information (Cambra, 2012). What are perceived results from “interplays between past experiences, one’s culture and the interpretation of the perceived” (Ewing & Handy, 2009). It should then be noted that physical objective features of the environment influence the quality of the walking environment both directly and indirectly through the perceptions and sensitivities of the individuals (Cambra, 2012). It should also be noted that only some urban design features are objective and can be assessed with some degree of objectivity (Cambra, 2012). Other features, such as a sense of comfort or level of comfort, are mainly perceptions and may produce different reactions in different people, as stated by Ewing and Handy (2009).
The relationship between the built environment and walking behaviour has been studied from different perspectives. Although it is a recent field of research, it has been gaining growing attention from various research fields, mainly transportation, public health, and urban planning. The two planning groups that are more active in the walking-related field are transportation planners and urban designers (Park, 2008). Transportation researchers have traditionally focused on understanding and institutionalising the space design for motorised modes of transportation, unlike pedestrian transportation, which is a more recent addition to their planning processes (Lo, 2009). The dominant documents shaping the pedestrian environment have been developed from engineering road design manuals (Cambra, 2012). The purpose of these manuals was to create efficient traffic flow, and it wasn’t until the early 1970s that walking behaviour was included in them. Still, some derived studies continue to adapt traffic engineering concepts to walking (Park, 2008).
These concepts dealt with walking speed, spacing between pedestrians, and flow of the pedestrian movement. Methods to estimate the demand (pedestrian volume) and the supply (mainly the sidewalk as basic pedestrian infrastructure) have been developed from them (Cambra, 2012). The main objective of these methods was to obtain an optimum level of service (LOS), accomplished with unobstructed pedestrian movement, or, in other words, to design a sidewalk wide enough to provide unobstructed movement for a given number of pedestrians (Park, 2008). Concerns towards biased motorised transport modes have introduced pedestrian planning guidelines in the Highway Capacity Manual (TRB, 2000), providing methods for grading the pedestrian infrastructure in terms of LOS and comparing the performances of pedestrian and other transportation facilities (Lo, 2009). However, this approach has had some criticism from the urban planning point of view since “it reflects a gross lack of understanding about the difference between vehicles and people; the standard treats pedestrians as atomistic and antisocial entities” (Lo, 2009). In practice, busy pedestrian sidewalks in the city centres can be rated with a lower mark than empty sidewalks in industrial areas. Additionally, the presence of other people has been considered by these guidelines as a source of potential conflict whilst being regarded as a sign of street vitality in the urban planning literature (Cambra, 2012).
ii. Built-Environment Correlates
It can be understood that the spatial arrangement of the physical elements of a given urban area determines the distance (or the proximity) of a trip. Density is a critical element of the urban pattern that significantly influences the distances between origins and destinations (Cambra, 2012; Jabbari et al., 2021). Density can be defined as the number of a given entity in a designated area, and several types of density are usually used in urban analysis, including population density, housing density, employment density, etc. (Cambra, 2012). It can be admitted that a high population density is usually associated with an equally high density of physical structures (buildings, infrastructures, amenities) where activities and functions take place. In this case, because there are many potential origins and destinations in the same area, the trip distance can be lower, affecting modal choice (Frank & Pivo, 1994; Bramson et al., 2021). Another factor that can influence the proximity between origin and destination is the spatial distribution of the activities in the urban fabric. Functional mix can be understood as the extent to which a given area hosts different activities and functions, such as commerce, services, houses, etc. (Cambra, 2012). If the area hosts a single type of activity, accessing other activities and functions will involve an increased effort, as it will be needed to reach different areas. On the other hand, an area that hosts diverse (but compatible) activities and functions can reduce the travel effort, given that there is no need to reach different areas (Schmid, 2006).
Density and Diversity have been complemented with Design in Cervero’s (2010) seminal work on the relationship between environment and travel patterns. His research in San Francisco’s Bay Area has found that density, land use diversity and pedestrian-oriented designs could generally reduce trip rates and influence travel mode choice, favouring non-motorised transport. These results were considered statistically significant but only with a “fairly marginal” influence (Cervero, 2010). The elasticities between built-environment dimensions and travel demand have been considered “modest to moderate” but “certainly not inconsequential” (Cervero & Kockelman, 1997). These findings supported the “New Urbanism” movement, which arose in the United States in the early 1980s, advocating for creating mixed-use, compact, walkable neighbourhoods. These findings have been widely accepted as relating positively to three main dimensions of the built environment: density, Diversity, and design, with walking behaviour (Cambra, 2012). Having a diversity of options (destinations or opportunities) within a walking range can be translated into having good pedestrian accessibility, as accessibility can be defined as the ease of accessing an opportunity in the form of activity, function, destination, etc. (Cambra, 2012).
Other built environment features widely accepted as relevant to influence the choice to walk include proximity and connectivity (Leslie et al. 2007). In these studies, proximity has also been defined as a broad concept, reflecting density and land use mix (also understood as density and Diversity). Connectivity was also described in the literature as the directness of routes between households, stores, and workplaces, being walking facilitated, where interconnecting streets exist. The presence of retail activities within urban neighbourhoods is a significant inducer of choice of walking as a transport mode (in connection to transit), as the presence of convenience and grocery stores near residences would encourage transit commuting by allowing workers to shop on the way to their homes (Cervero & Kockelman, 1997). The public health field, being the most active in researching this subject, has been the source for identifying correlations between the built environment and physical activity (Cambra, 2012). Nevertheless, walking is a form of physical activity in the urban space, and therefore, the correlations drawn from the public health field have been accepted in walkability studies (Cambra, 2012).
Schmid (2006) observed that the urban environment tends to be organised and structured, and because of that, many of the attributes that can influence walking appear usually spatially connected, creating this phenomenon referred to as “spatial multicollinearity”. Such “spatial multicollinearity” has suggested that some of the relations between the built environment and walking are, in fact, complementary (Cambra, 2012). For this reason, the interpretation of the relative contribution of each factor may be highly challenging (Schmid, 2006; Frank et al., 2005). The use of a composite index has been suggested as a way of providing a better estimation of the factor’s effects (Cambra, 2012). Using such a method, the combination of interrelated variables could provide a valuable tool for “explaining to planning professionals and policymakers that multiple design variables need to be considered simultaneously in creating ‘walking friendly’ communities” (Frank et al., 2005). Moreover, measuring the influence of a single element of the built environment in travelling patterns has proven to be “fruitless”, given the observed high multicollinearity and statistical interaction of built-environment variables (Cervero & Kockelman, 1997).
Built environment correlates to walking behaviour (and physical activity in general), which has been proven to be the object of study by many research fields (Cambra, 2012). Because it is a recent and complex subject, results are to be handled cautiously, as the relations’ effect on walking are often only moderated and are in ways that are not fully understood. This study, therefore, sets out to measure walkability in urban residential neighbourhoods using specific built-environment attributes identified in the literature, such as density, Diversity, and connectivity. The findings of this study will further expand the frontiers of knowledge on how characteristics of the built environment influence or inhibit walking, whether for leisure or utilitarian purposes.
The Study Area
Enugu, the present capital city of Enugu state, is located at approximately latitude 06030’00” N and longitude 07030’00” E in the South-eastern part of Nigeria (Geo-information, 2012). The city is bounded by Igbo-Etiti and Isi-Uzo Local Government Areas in the north, Udi Local Government Area in the west, Nkanu West and part of Nkanu East Local Government Areas in the south, and Nkanu East Local Government Area in the east (see Figure 3). The metropolis comprises three local government areas: Enugu East Local Government Area, Enugu North Local Government Area, and Enugu South Local Government Area. The city covers a total land area of about 556 km2, with Enugu East Local Government Area covering about 383 km2 (68.9%) of the city’s land area and Enugu North and Enugu South Local Government Areas covering 106 km2 (19.1%) and 67 km2 (12%) of the city’s land area respectively.
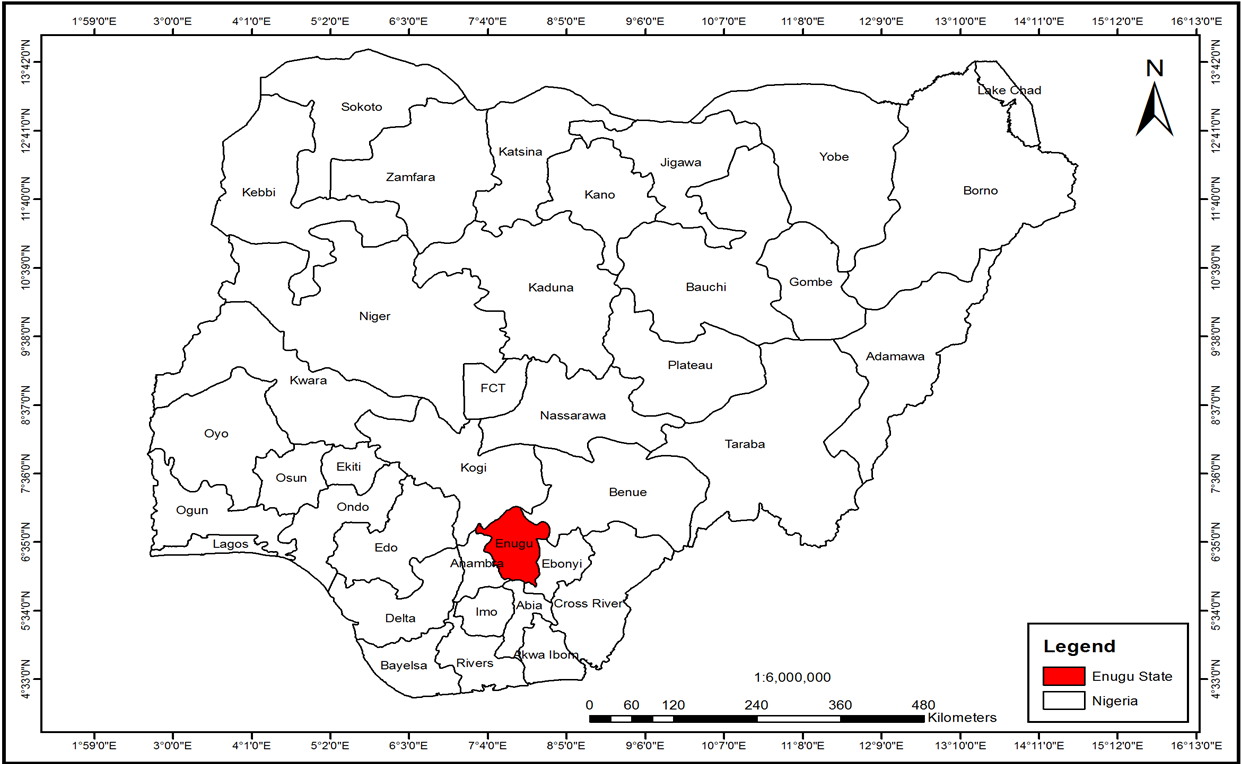
Figure 1: Enugu State in the Context of Nigeria.
According to the 2006 Nigerian census and the 2015 projections, the Enugu metropolitan area has an estimated population of 952,410 (NPC, 2015). Enugu metropolis consists of 19 major residential neighbourhoods, which include Akuke, Amaechi, Achara Layout, Abakpa, Asata, Emene, Garriki, GRA, Iva-Valley, Independence Layout, Mary Land, New Haven, Nike, Obeagu, Ogui, Ogbete, Trans-Ekulu, Ugwuaji, and Uwani, among many other minor residential estates. Four of these residential neighbourhoods are in Enugu East Local Government Area, seven are in Enugu North Local Government Area, and eight are in Enugu South Local Government Area (see Figure 3).
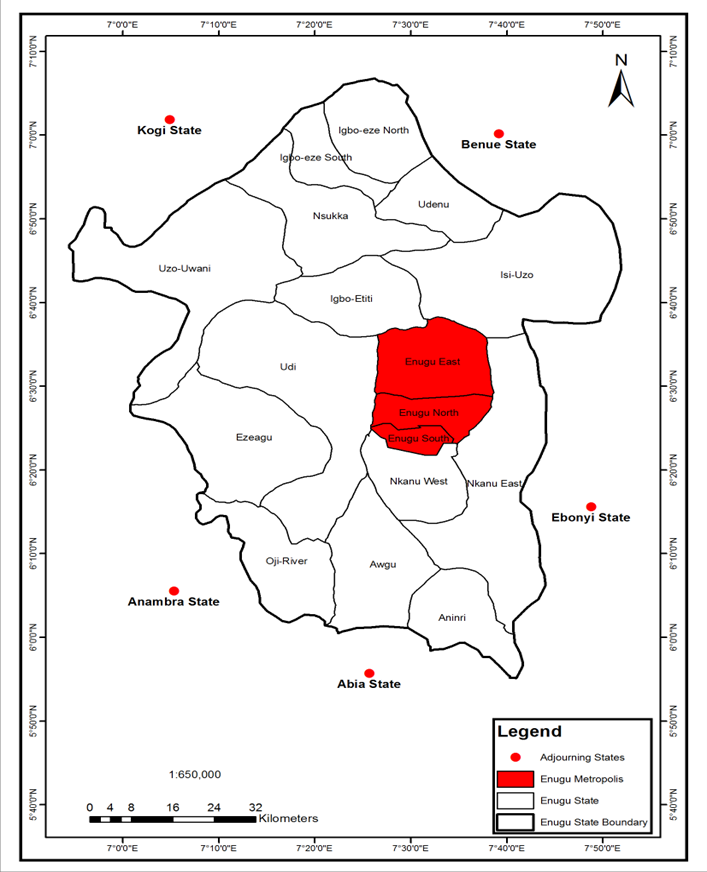
Figure 2: Enugu Metropolis in Enugu State.
The residential neighbourhoods in Enugu Metropolis are comprised of low, medium, and high-density residential neighbourhoods. Among the low-density residential neighbourhoods are Independence Layout, Trans-Ekulu, and GRA. The medium-density residential neighbourhoods in the city include New Haven, Achara Layout and Uwani, while the high-density neighbourhoods include Asata, Garriki, Abakpa, Nike, Obeagu, Akwuke, Amaechi, Emene, Ogbete, Ogui, Iva-Valley, Ugwuaji, and Mary Land.
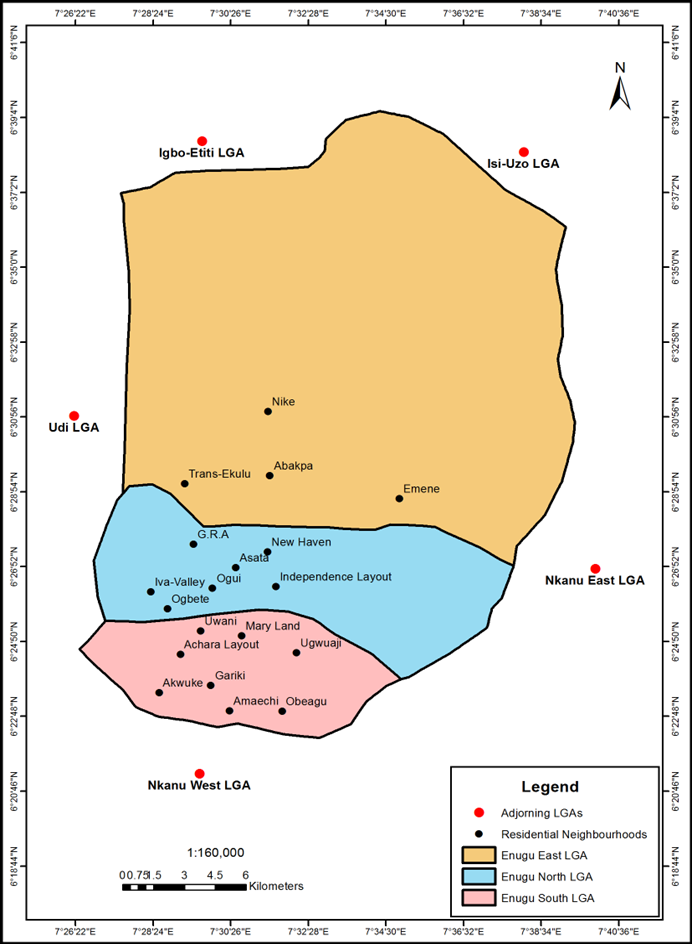
Figure 3: Residential Neighbourhoods in Enugu Metropolis.
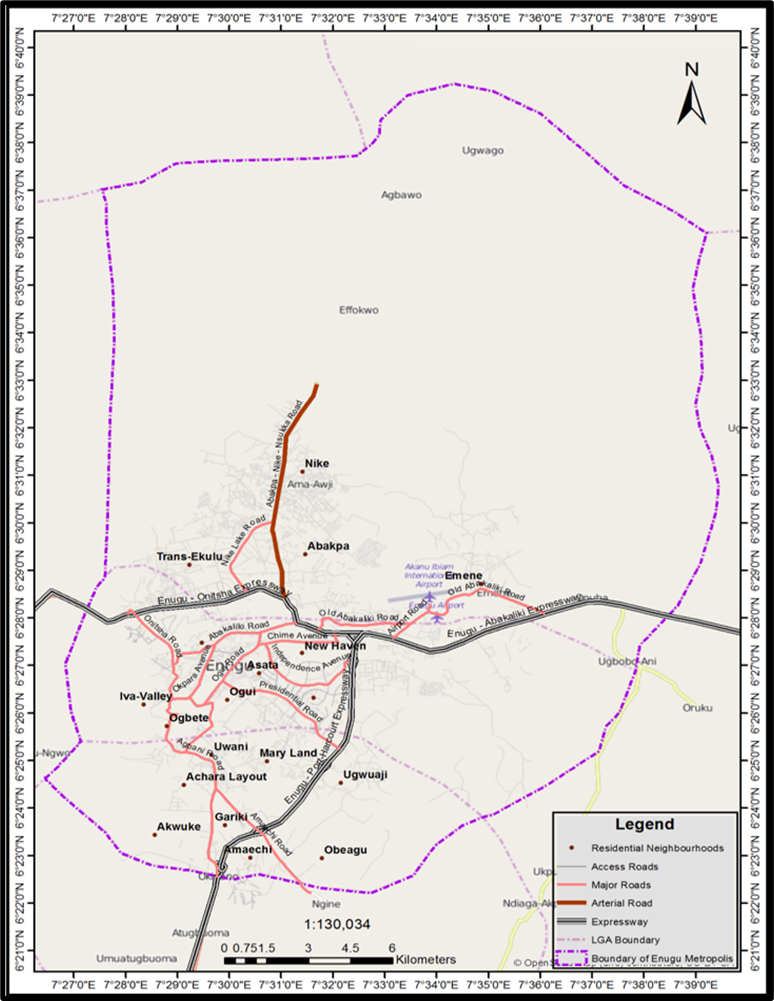
Figure 4: Road Map of Enugu Metropolis.
Nicknamed the Coal City, Enugu’s economy in the early 20th century depended on coal mining in the Udi plateau; this industry pushed the city’s growth (Little, 2004). The Nigerian Coal Corporation has been based in Enugu since its creation in 1950 when it controlled coal mining (Udo, 1970). With the creation of the Eastern Line, Enugu related to the sea via Port Harcourt to its south and later connected to the city of Kaduna to Enugu’s north (Kibly, 1969). The Nigerian Civil War brought widespread devastation that forced a decline in coal production due to damage or destruction of equipment.
METHODOLOGY
The key variables for this study are density (residential), Diversity (land use mix), and connectivity (intersection density). Information on the number and classification of the residential neighbourhoods in Enugu metropolis was sourced from Enugu State Ministry of Lands, Survey and Urban Planning. Aerial images and road maps of the selected residential neighbourhoods were sourced from the Google Earth application and digitised with ArcGIS 10.2. data on residential density, land use mix/diversity and street connectivity in the selected low, medium, and high-density residential neighbourhoods in the study area was extracted from the generated maps for further analysis. The target population of this study are the residential neighbourhoods of Enugu metropolis. The distribution of the neighbourhoods according to LGAs and density is presented in Table 1.
Table 1: Distribution of Residential Neighbourhoods in Enugu Metropolis
| Enugu North
LGA |
Residential Density | Enugu South LGA | Residential Density | Enugu East LGA | Residential Density |
| Independence Layout | Low | Achara Layout | Medium | Trans-Ekulu | Low |
| G.R.A | Low | Uwani | Medium | Abakpa | High |
| New-Haven | Medium | Amechi Awk. | High | Emene | High |
| Asata | High | Mary Land | High | Nike | High |
| Ogbete | High | Akwuke | High | – | – |
| Ogui | High | Obeagu | High | – | – |
| Iva-Valley | High | Garriki | High | – | – |
| – | – | Ugwuaji | – | – | – |
Source: Enugu State Ministry of Lands, Survey and Town Planning, 2022.
To achieve the aim of this study, through representative data collection from the target population, purposive sampling technique was used to select three residential neighbourhoods from the three Local Government Areas that make up Enugu metropolis. Each selected neighbourhood represents the different (low, medium, and high) residential densities in the study area. The purpose of selecting the residential neighbourhoods according to their residential densities is to enable the researcher to objectively compare the neighbourhood environment of the neighbourhoods and determine how walkable each of the neighbourhoods is through the measurement of specific built-environment characteristics in the neighbourhoods and the generated walkability index. The data collected from the selected neighbourhoods was used to measure walkability and generate a composite walkability index of the residential neighbourhoods.
Table 2: Distribution of the Selected Residential Neighbourhoods
| S/N | Selected Residential Neighbourhoods | Residential Density | LGA |
| 1 | Trans-Ekulu | Low | Enugu East |
| 2 | New Haven | Medium | Enugu North |
| 3 | Garriki | High | Enugu South |
Source: Authors’ Sample, and Enugu State Ministry of Lands, Survey and Town Planning, 2022.
Calculation of Walkability Index
Walkability index is a tool used to measure the characteristics of the built environment that contribute to walkable neighbourhood designs. Three measurable built-environment characteristics were identified and chosen as indicators for measuring walkability in this study area. These indicators include density (residential density), Diversity (land use mix) and connectivity (intersection density). The collected data on these indicators were analysed as follows.
A. Density (Residential Density)
In the analysis of residential density, Household Density was chosen instead of Population Density. This choice was made because households are residential units of one or more people who live together and may consist of a single-family or some other grouping of people; therefore, they are more strongly related to measures of residential density such as Household Density. Thus, data on the number of households in the selected residential neighbourhoods had to be generated using the following expression:
- Estimated number of persons per household = 6 persons in low-density residential neighbourhoods, eight persons in medium-density residential neighbourhoods and 10 persons in high-density residential neighbourhoods.
- Total number of households = total population of people in the neighbourhood/estimated No. of persons per households
B. Diversity (Land Use Mix)
This study incorporates the Diversity factor by employing the Entropy Index, which illustrates the Diversity of the built environment. The Entropy Index shows how the spatial arrangement of land uses in an area affects walkability, positively or negatively. Suppose there is a low level of redundancy (meaning the Entropy Index has a value close to 0). In that case, a positive walkability result is expected because the given area is characterised by diverse land use. If there is a high level of redundancy (meaning the Entropy Index has a value close to 1), walkability will be affected negatively.
C. Connectivity (Intersection Density)
In this study, Connectivity was determined using the Street centreline vector data, considering the number of actual intersections and excluding street intersections on highways or interchanges because they are unsuitable for walking. ArcGIS was used to select actual intersections and crossroads that were too close or closer than fifteen meters, which were merged and treated as one intersection. Other studies also recommend fifteen meters (Frank et al., 2009; Dobesova & Krivka, 2012; Bramson et al., 2021).
The walkability index calculation expression adopted for this study is as follows:
Walkability index = 6 x (z-score) Land Use Mix + (z-score) Net Residential Density + (z-score) Intersection Density
Where z-score means a normalised value that has been generated.
Land use mix is an expression of entropy, given by:
Entropy index =
p = proportion of land use (measured in terms of floor area),
k = quantity of different uses (considering residential, commercial, institutional, etc.),
Net residential density is measured by the number of households per hectare of residential land use and is given by:
total number of households in a neighbourhood/total area of residential land use (Ha)
Intersection density: is measured by the number of intersecting points of 2 or more streets in a neighbourhood and is given by:
total number of street intersections in a neighbourhood/total land area of the neighbourhood (Km2)
This walkability index calculation expression is known as the Global Walkability Assessment Technique. It was developed by Frank et al. (2005) and adopted by Schmid (2006). It has been applied to a single neighbourhood in the original version and to a whole city (all its neighbourhoods) in the adopted version.
RESULT AND DISCUSSION
Over the last two decades, there has been considerable progress regarding the measurement of walkability, and different measurable features of the built environment have been incorporated as models, and different approaches have been developed (Agampatian, 2014; Telega et al., 2021). The first method is based on interviews or self-administered questionnaires, a subjective measure of walkability. The second approach uses built-environment characteristics obtained by systematic observations or audits that quantify the environmental attributes of an area, including the presence or absence of features hypothesised to affect walking. The third method uses geospatial databases and Geographic Information Systems (GIS) to assess or develop relevant walkability indicators. This method is more objective, and it is the method adopted in this study. GIS aids the preparation, presentation, and interpretation of facts that pertain to the surface of the earth (Agampatian, 2014), and it considers the physical location of areas, boundaries, people, and services, as well as types of land use and natural features. This section presents the results of an objective measure of walkability in the study area.
Table 3: Walkability Index
| Residential Neighbourhoods | Density | Indicator Scores | Overall Walkability | ||
| Residential Density | Land Use Mix | Intersection Density | |||
| Trans-Ekulu | Low | 8.3 | 0.90 | 57.7 | 4.51 |
| New Haven | Medium | 36.4 | 0.68 | 45.7 | 5.97 |
| Garriki | High | 39.3 | 0.69 | 59.8 | 5.29 |
Source: Authors’ GIS Analysis, 2023.
1. Density (Residential Density)
Table 3 presents the weighted scores of the built environment characteristics used as walkability indicators in three selected residential neighbourhoods in the study area, representing low, medium, and high-density residential neighbourhoods and their respective walkability scores. The data indicates that Trans-Ekulu scored 8.3 in the residential density indicator, while New Haven and Garriki scored 36.4 and 39.3, respectively. This means that Garriki is the most densely populated neighbourhood among the three selected neighbourhoods, while Trans-Ekulu is the most sparsely populated neighbourhood. This result is not surprising because Trans-Ekulu is a low-density residential neighbourhood with a total population of 23,309 people and a land area of 6.48km2, while Garriki is a high-density residential neighbourhood with a total population of 37,724 people and a land area of 1.94km2. On the other hand, New Haven is regarded as a medium-density residential neighbourhood with a total population of 41,201 people and a land area of 3.02km2. Residential density was calculated as the total number of households in each residential neighbourhood divided by the total land area of residential land use in each residential neighbourhood.
2. Diversity (Land Use Mix)
Mixed land use supports various uses in relative proximity, shortening trip distances and promoting walking. However, the data in Table 3 shows that Trans-Ekulu scored 0.90, New Haven scored 0.68, and Garriki scored 0.69 on the land use mix indicator. The Entropy Index was employed and calculated for each selected neighbourhood to capture the homogeneity or heterogeneity of land use in the selected residential neighbourhoods. If the Entropy Index has a value close to 0, it means that diverse land uses characterise the area, but if the Entropy Index has a value close to 1, it means that land use in the area is homogenous. It can then be inferred from the presented data that New Haven has the most heterogeneous land use among the selected residential neighbourhoods, followed by Garriki, while Trans-Ekulu is characterised by homogenous land use. This means that there is a diversity of activities in proximity at New Haven and Garriki, and as such, these activity areas can be accessed on foot, while activity locations in Trans-Ekulu are dispersed. This can be seen from the land use maps of the three neighbourhoods, as shown in Figures 5, 6, and 7.
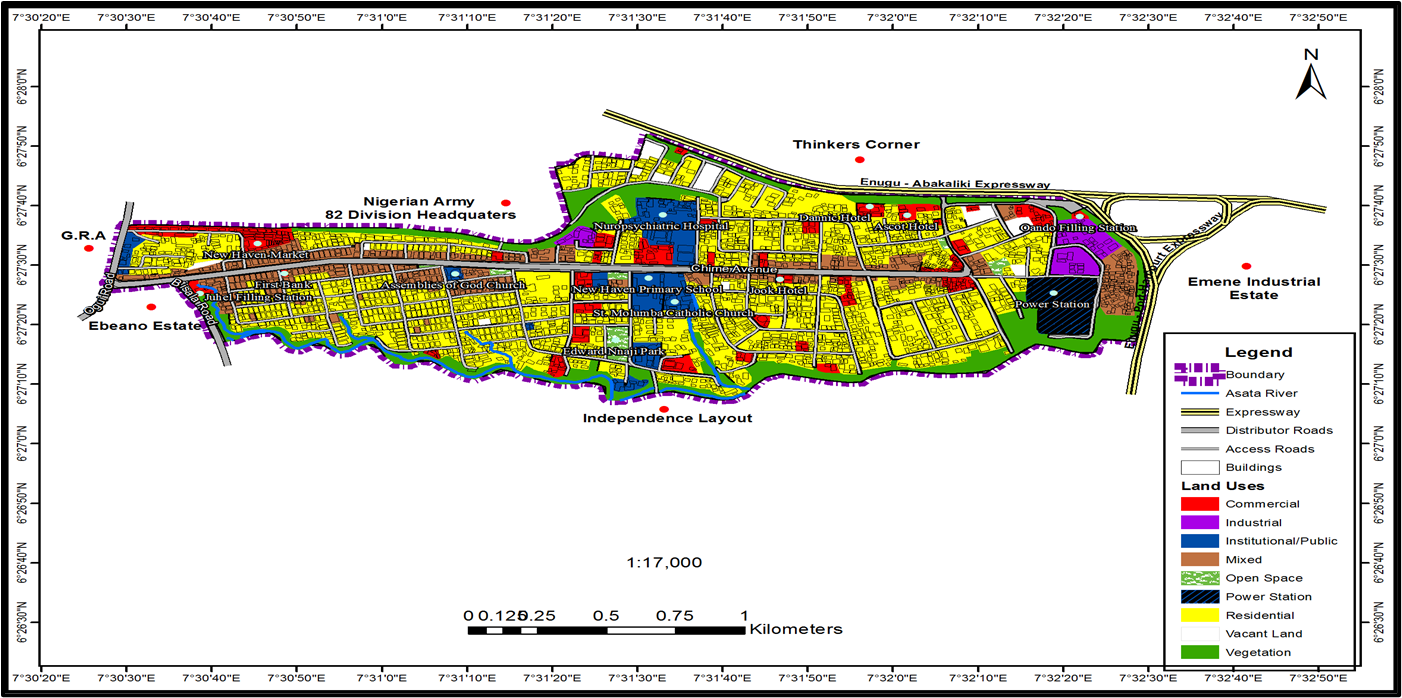
Figure 5: Land Use Map of New Haven, Enugu.
Source: Authors’ Field Survey & GIS Analysis, 2022.
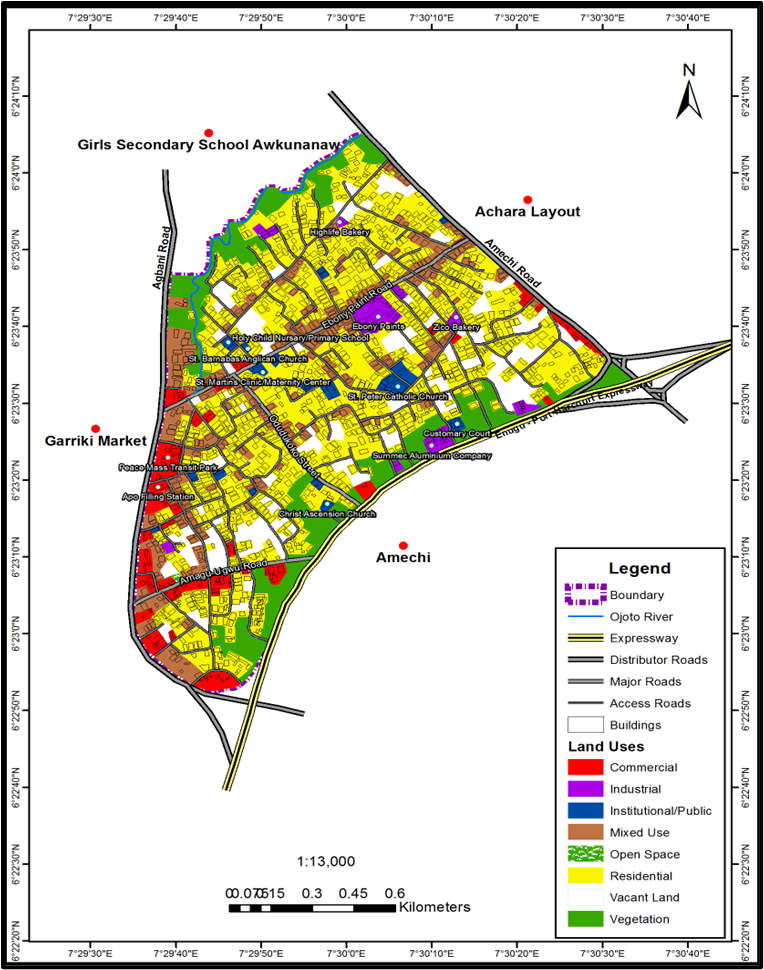
Figure 6: Land Use Map of Garriki, Enugu.
Source: Authors’ Field Survey & GIS Analysis, 2022.
![]()
Figure 7: Land Use Map of Trans-Ekulu, Enugu.
Source: Authors’ Field Survey & GIS Analysis, 2022.
3. Connectivity (Intersection Density)
Connectivity affects the ease of travel between origin and destination. It shows the degree to which roads, pedestrian walkways and trails are connected so that moving from place to place by walking is relatively easy. Table 3 shows that Trans-Ekulu scored 57.7 in the street connectivity indicator, while New Haven and Garriki scored 45.7 and 59.8, respectively. This means that Garriki has more connected streets among the selected residential neighbourhoods, while New Haven has the lowest connected streets among the selected residential neighbourhoods. This can be attributed to the fact that Garriki, a high-density residential neighbourhood, has shorter streets and the smallest land area than the other neighbourhoods, while Trans-Ekulu has a better road network among the selected residential neighbourhoods. Street Connectivity was calculated as the total number of street intersections per km2 in each chosen neighbourhood. This measure was preferred instead of counting only the number of intersections within the neighbourhoods because the geographic size of one neighbourhood might be twice or even triple the size of another. Given this, normalising the number of intersections of each neighbourhood by the total area of each neighbourhood was considered more appropriate for the analysis.
4. Walkability Index
The overall walkability score of the selected residential neighbourhoods, as shown in Table 3, indicates that Trans-Ekulu scored 4.51, while New Haven and Garriki scored 5.97 and 5.29, respectively. The Walkability Index was calculated using three walkability indicators: residential density, land use mix, and street connectivity. A walkability score ranging from 1 to 10 was used, and a score closer to 1 indicates low walkability, while a score closer to 10 indicates high walkability. Thus, it can be inferred that New Haven is the most walkable neighbourhood, while Trans-Ekulu is the least walkable residential neighbourhood among the selected neighbourhoods. This result aligns with the findings of urban planning, transportation planning and public health literature (Schmid, 2006; Cervero, 2010; Cambra, 2012; Agampatian, 2014; Telega et al., 2021; Chan & Li, 2022).
The land use mix indicator result revealed that New Haven and Garriki have relatively heterogeneous land use, making them more supportive of walkability than Trans-Ekulu, which has a very poor land use mix/diversity. Furthermore, this study’s walkability index result slightly differs from the general conception that high-density residential neighbourhoods are mostly more walkable than medium and low-density residential neighbourhoods (Cervero & Kockelman, 1997; Cambra, 2012; Chan & Li, 2022). Surprisingly, the result reveals that a medium-density residential neighbourhood is more walkable than other residential neighbourhoods. This further proves that a singular indicator cannot determine walkability measurement. There must be a balance among the built-environment characteristics (density, Diversity, connectivity, etc.) that influence walkability.
SUMMARY OF FINDINGS
The walkability index of the sampled residential neighbourhoods in the study area revealed that Garriki has the highest residential density among the selected residential neighbourhoods, with 39.3 households per hectare of the land area used for residential purposes. It was followed by New Haven, with 36.4 households per hectare of the land area used for residential purposes in the neighbourhood. In comparison, Trans-Ekulu has 8.3 households per hectare of the land area used for residential purposes in the neighbourhood. The study further revealed that New Haven has the most heterogeneous land use among the selected residential neighbourhoods in the study area. It is also the most walkable residential neighbourhood among the sampled residential neighbourhoods in the study area, followed by Garriki.
In contrast, Trans-Ekulu, a low-density residential neighbourhood with homogenous land use, is the least walkable neighbourhood among the sampled residential neighbourhoods in the study area. Although the streets in Trans-Ekulu are more connected and in better condition than the streets in the other neighbourhoods, Trans-Ekulu still scored low in the walkability index. It was, however, discovered that land use mix/diversity is a significant influencer of walkability, meaning that areas with heterogeneous land use proved to be more walkable than areas characterised with homogenous land use because it is the intensity and proximity of activities within a neighbourhood that provides an opportunity for spatial interaction among the activity areas. The proximity of these activities encourages the residents of the neighbourhoods to access them on foot, thereby enhancing neighbourhood walkability.
CONCLUSION AND RECOMMENDATIONS
This study identified and elucidated a gap in the existing literature on the built-environment factors that constrain walkability in the residential neighbourhoods of Enugu metropolis. Nevertheless, the built environment’s characteristics can enhance and promote or hinder walkability in a particular environment. It is also established that density, diversity, and connectivity are the primary influencers of walking in any given environment. A method of measuring these characteristics of the built environment has also been established. However, the extent to which these built-environment characteristics affect walkability has not been statistically proven. Thus, there is a need to conduct a study that will statistically identify which density, diversity and connectivity influence or hinder walking more than the others. Furthermore, two types of walking (utilitarian and leisure walking) have been identified in the literature, but the built-environment attribute that promotes or hinders utilitarian or leisure walking is yet to be determined. Thus, there is a need to carry out further study that can provide that knowledge.
This study recommends the following strategies for improving walkability in the residential neighbourhoods of Enugu metropolis.
- Establishment of organised commercial and retail outlets near residences, especially in low-density neighbourhoods, to foster walking for transit and shopping convenience.
- Promote the diversification of land uses through increased commercial activities to attract other amenities like institutions and recreation, fostering interactions and walking.
- Strategic location of recreation parks and facilities within walkable distances to encourage leisure walking and enhance social interaction.
- Organise and regulate public transportation modes in residential areas to mitigate environmental pollution and improve walkability.
- Provide adequate lighting along inner streets to enhance safety and encourage evening walking, tailored to fit each neighbourhood’s density and structure.
REFERENCES
- Abley, S.J., & Turner, S. (2011). Predicting Walkability: Technical Report. New Zealand Transport Agency.
- Agampatian, R. (2015). Using GIS to Measure Walkability: A Case Study of New York City. Stockholm: Royal Institute of Technology.
- Alfonzo, M. (2005). To Walk or Not to Walk: The Hierarchy of Walking Needs. Environment and 37(6) 808-836.
- Bramson, A.L., Okamoto, K. and Hori, M. (2021). Comparing Methods for Measuring Walkability. Complex 30(4) 539-565, doi: 10.25088/ComplexSystems.30.4.539.
- Cambra, P. (2012). Pedestrian Accessibility and Attractiveness Indicators for Walkability Assessment. MSc thesis in Urban Studies and Territorial Management, Instituto Superior Técnico, Universidade Técnica de Available online at: https://fenix.tecnico.ulisboa.pt/downloadFile/2589873355564/Dissertacao.pdf
- Cervero, R. (2010) Built Environment and Mode Choice: Toward a Normative Framework. Transportation Research Part D. 7(4) 265–284.
- Cervero, R. (1997). Para Transit in America: Redefining Mass Transportation. Conn.: Praeger.
- Cervero, R., & Kockelman, K. (1997). Travel Demand and the 3Ds: Density, Diversity and Design. Transportation Research Part D: Transport and Environment. 2(3) 199-219.
- Chan and Li (2022). The Effects of Neighbourhood Attachment and Built Environment on Walking and Life Satisfaction: A Case Study of Shenzhen. 130. doi: 10.1016/j.cities.2022.103940.
- COST 358. (2010). PQN Final Report Part B1, Functional Needs. Cheltenham, UK: Walk 21.
- Dobesova, Z., & Krivka, T. (2012). “Walkability Index in the Urban Planning: A Case Study in Olomouc City”, in Burian, J. (Ed.). Advances in Spatial Planning. Available online at: http://www.intechopen.com/books/advances-in-spatial-planning/walkability-index-in-the-urban-planning-a-case-study-in-olomouc-city
- Evans, G. (2009). Accessibility, Urban Design, and the Whole Journey Environment. Built Environment. 35(3) 366–385.
- Ewing, R., & Handy, S. (2009). Measuring the Unmeasurable: Urban Design Qualities Related to Journal of Urban Design. 14(3), 65-84.
- Forsyth, A., & Southworth, M., (2008). Cities Afoot: Pedestrians, Walkability, and Urban Design. Journal of Urban Design. 13(1) 1-3.
- Frank, L.D., Schmid, T.L., Sallis, J.F., Chapman, J., & Saelens, B.E. (2005). Linking Objectively Measured Physical Activity with Objectively Measured Urban Form: Findings from SMARTRAQ. American Journal of Preventive Medicine. 28(2) 117-125.
- Frank, L.D., & Engelke, P.O. (2001). The Built Environment and Human Activity Patterns: Exploring the Impacts of Urban Form on Public Health. Journal of Planning Literature. 16(2) 202-218.
- Geo-Information. (2014). The Ultimate Geography Information Resource Centre. http://geography blogspot.com.ng/2014/04/geography-e-store.html
- Glanz, T.A. (2011). Walkability, Social Interaction and Neighbourhood Design. A PhD Thesis Submitted to the Graduate School, University of Nebraska, Lincoln, USA.
- Handy, S. (2005). Critical Assessment of the Literature on the Relationships among Transportation, Land Use, and Physical Activity. Transportation Research Board and the Institute of Medicine Committee on Physical Activity, Health, Transportation, and Land Use. Resource Paper for TRB Special Report 282. http://onlinepubs.trb.org/onlinepubs/archive/downloads/sr282papers/sr282handy.f.
- Handy, S. (2004). Community Design and Physical Activity: What Do We Know, and What DON’T We Know? University of California, Davis. Presented at the National Institute of Environmental Health Sciences conference on “Obesity and the Built Environment: Improving Public Health through Community Design,” Washington, DC. Available online at: http://www.des.ucdavis.edu/faculty/handy/Handy_NIEHS_revised.pdf
- Jabbari, M., Fonseca, F. and Ramos, R. (2021). Accessibility and Connectivity Criteria for Assessing Walkability: An Application in Qazvin, Iran. Sustainability. 13(7). doi: 3390/su13073648.
- Kilby, P. (1969). Industrialisation in an Open Economy: Nigeria 1945–1966. Cambridge University Press
- Krambeck, H., & Shah, J. (2006). The Global Walkability Index: Talk the Walk and Walk the Talk. A Paper delivered at Better Air Quality Conference (BAQ), Held in Yogyakarta, Indonesia, on 14 June 2006.
- Layden, K.M. (2003). Social Capital and the Built Environment: The Importance of Walkable American Journal of Public Health. 93(9) 1546-1551.
- Lee, C., & Moudon, A. (2004). Physical Activity and Environment Research in the Health Field: Implications for Urban and Transportation Planning Practice and Research. Journal of Planning Literature. 19(2) 147-181.
- Leslie, E., Saelens, B., Frank, L., Owen, N., Bauman, A., & Hugo, G. (2007). Residents Perceptions of Walkability Attributes in Objectively Different Neighbourhoods: A Pilot Study. Health Place. 11 (5) 227
- Little, K. (2004). Urbanisation as a Social Process: An Essay on Movement and Change in Contemporary Africa (Reprint Ed.). London: Routledge.
- Lo, R.H. (2009). Walkability: What Is It? Journal of Urbanism: International Research on Placemaking and Urban Sustainability. 2(2) 145-166.
- National Population Commission. (2015). 1991 Census Community Result, Harmonized with 2006 LGA Census Result and 2015 Projection for Enugu State. Enugu: National Population Commission.
- Nigerian Heart Foundation [NHF]. (2014). Nigerian Report Card on Physical Activity for Children and Youth. Ibadan: Book Builders.
- Oyeyemi, A.L., Adegoke, B.O.A., Oyeyemi, A.Y., & Sallis, J.F. (2011). Perceived Environmental Correlates of Physical Activity and Walking in African Young Adults. American Journal of Health 25(5) e10-e19.
- Oyeyemi, A.L., Sallis, J.F., Adegoke, B.O.A., Oyeyemi, A.Y., & De-Bourdeaudhuij, I. (2012). Perception of Neighbourhood Safety is related with Physical Activity among Adults in Nigeria. BMC Public Health. 12(3) 294-317.
- Oyeyemi, A.L., Deforche, B., Sallis, J.F., De-Bourdeaudhuij, I., & Van-Dyck, D. (2013). Behavioural Mediators of the Association between Neighbourhood Environment and Weight Status in Nigerian Adults. American Journal of Health Promotion. 28(1) 23-31.
- Paranagamage, P., Simon A., Andrew P., & Fahmida, K. (2010). Social Capital in Action in Urban Environments: An Intersection of Theory, Research and Practice Literature. Journal of Urbanism: International Research on Placemaking and Urban Sustainability. 3(3) 231-252.
- Park, S. (2008). Defining, Measuring, and Evaluating Path Walkability, and Testing Its Impacts on Transit Users’ Mode Choice and Walking Distance to the Station. PhD Dissertation, University of California Transportation Centre, Berkeley.
- Schmid, J. (2006). The Relationship between the Built Environment and Physical Activity Moving on from Foot Shape. Bachelor Thesis, Submitted to Faculty of Geosciences and Environment, University of Lausanne, Switzerland.
- Silva, J.D.E. and Lucchesi, S.T. (2022). Land-Use Patterns, Location Choice, and Travel Behavior: Evidence from Sao Paulo. Journal of Transport and Land Use. 15(1). doi: 5198/jtlu.2022.2125.
- Telega, A., Telega, I. and Bieda, A. (2021). Measuring Walkability with GIS-Methods Overview and New Approach Proposal. Sustainability. 13(4) doi: 3390/su13041883.
- Toit, L.D., Cerin, E., Leslie, E., and Owen, N. (2007). Does Walking in the Neighbourhood Enhance Local Sociability? Urban Studies. 44(9) 1677-1695.
- Transport Research Board. (2000). Does the Built Environment Influence Physical Activity? Examining the Evidence. Special Report 282, Transportation Research Board, Washington, DC World Health Policy Brief – Health and Environment Linkages in the Urban Environment. http://www.who.int/heli/risks/urban/urbanenv/en/
- Udo, R.K. (1970). Geographical Regions of Nigeria. University of California Press.
- United Nations Human Settlements Programme [UN-Habitat] (2022). World Cities Report. Nairobi.