
Natural Radioactivity and Associated Radiological Hazard Indices in Carbonatite Rocks from Oldoinyo Lengai, Tanzania
- Erick Josephat Kalori
- 01-23
- Nov 27, 2023
- Environmental Impact
Natural Radioactivity and Associated Radiological Hazard Indices in Carbonatite Rocks from Oldoinyo Lengai, Tanzania
Erick Josephat Kalori
P.O.Box 47, Bagamoyo, Tanzania, Dr. Innocent J. Lugendo, P.O Box 35063, Dar es Salaam, United Repubilc of Tanzania
DOI: https://doi.org/10.51584/IJRIAS.2023.81101
Received: 07 November 2023; Revised: 11 November 2023; Accepted: 16 November 2023; Published: 27 November 2023
ABSTRACT
The distributions of naturally occurring radionuclides 232Th, 238U and 40K in carbonatite rocks from Oldoinyo Lengai region, Tanzania were determined. The Hyper-pure Germanium (HPGe) detector based on gamma spectroscopy located at Tanzania Atomic Energy Commission (TAEC) in Arusha was used in order to assess the radiological health hazards associated with the use of carbonatite rocks. The mean activity concentrations of 232Th, 226Ra and 40K were found to be 51.75 Bq/kg, 46.38 Bq/kg and 966.56 Bq/kg respectively. The results of mean activity concentration together with radiological hazard indices obtained in this study were all higher than their worldwide maximum recommended limits. This indicates that there exist radiation risks within the vicinity of carbonatite deposits in Oldoinyo Lengai. The region is known to be subjected to environmental degradations due to volcanic activities. Therefore, findings in this study could also serve as an important radiometric baseline data upon which future epidemiological studies and environmental monitoring initiatives could be based.
Key words: Natural radionuclides, Radiological hazard indices, Carbonatite Rocks, Oldoinyo Lengai, Excess lifetime cancer risk.
INTRODUCTION
Naturally Occurring Radioactive Materials (NORMs) are the major source of ionizing radiation exposure to humans (El Samad et al. 2013). Approximately 87% of radiation doses to which humans are exposed are from the naturally occurring radioactive isotopes of 232Th, 238U and their daughters as well as 40K (Shetty and Narayana 2010). Natural radioactivity exists in the earth’s environment through various geographical formations such as water, soil and rocks (Shetty and Narayana 2010). Carbonatite rocks are among the rocks that are essentially known to host significant amounts of natural radionuclides (Otwoma 2012).
Carbonatite rocks are carbonate-rich igneous rocks containing at least 50% of carbonate minerals and other various minerals such as silicate and phosphate in fewer amounts (Woolley and Kjarsgaard 2008). These rocks are economically valuable to human being as they are the host of Niobium (as pyrochlore) and rare earth element (REE) such as bastnaesite, monazite and vermiculite (Simandl 2014). Apart from hosting these elements, carbonatite rocks, like other rocks are also used in construction activities (Downes et al. 2012). Nonetheless, studies have shown that carbonatite rocks contain natural radioactive elements at different concentrations. In fact, some carbonatite deposits have been reported to have higher radioactivity than the recommended world average levels (Achola 2009).
In Tanzania, carbonatite rocks are found in Wingu Hill and Luhombero in Morogoro, Panda Hill and Senjeri Hill in Mbeya and Galapo in Mbulu (Boniface 2017). However largest deposits of carbonatite rocks are at Oldoinyo Lengai in Arusha region due to continually eruption and solidification of carbonatite lava (Boniface 2017). The region is highly important for the lives of people around especially the Maasai tribe.
The socio-economic activities around Oldoinyo Lengai include agriculture, pastoralism, house construction, minerals extraction and tourism (Haulle and Njewele 2017). The houses construction and agriculture activities depend on the soils resulted from weathered carbonatite rocks. The outcrops of carbonatite rocks are consumed by both humans and animals (Haulle 2014).
The above-mentioned socio-economic activities around Oldoinyo Lengai coupled with the possible presence of natural radionuclides in carbonatite rocks may lead to excessive exposure to natural radiation for communities within and in the vicinity of the deposits. People around Oldoinyo Lengai may be exposed to radiation directly from primordial radionuclides present in carbonatite rocks or indirectly through consuming carbonatite outcrops and inhalation of carbonatite dust. Literature show that prolonged exposure to radiation may lead to serious health effects including cancer (Qureshi et al. 2014, Spycher et al. 2015). Therefore, there is a need for assessing radioactivity level in carbonatite rocks as well as the associated radiological hazards that may be encountered by the people of Oldoinyo Lengai. Several studies conducted to analyze the carbonatite rocks at Oldoinyo Lengai, based on their geochemical properties and their origin but they are silent on their activity levels (Carmody 2012 and Fischer et al. 2009). Therefore, this study aligned itself towards investigating the level of natural radioactivity in the carbonatite rocks of Oldoinyo Lengai and assessing the associated radiation hazard indices.
MATERIALS AND METHODS
2.1. Sample collections
Oldoinyo Lengai region is in the proximity of Engaresero village, Ngorongoro district in northern west Arusha, Tanzania. The region consist of Mt Oldoinyo Lengai which is the active volcano that erupts the natrocarbonatite lavas which cools and solidifies leading to the formation of carbonatite rocks in different parts within the region such as Gelai, Ketumbeine and some parts of the lake Natron as shown in Fig 2.1 (Carmody 2012). However the availability of water falls within the Gregory rift just below the foot of Oldoinyo Lengai Mountain makes more important for domestic use by population around the region (Lengai et al. 2015). Thirty (30) samples of carbonatite rocks were randomly collected from different locations of Oldoinyo Lengai that is north, south, east and west of sampling area. The number of samples differed from sampling area to another due to the amount of carbonatite deposit available in a given location. The survey meter was used to identify the carbonatite deposit with high radiation in each location. Samples collection points were separated by a distance of 1 km and about 1 kg of each carbonatite rock sample were packed and transported to the TAEC laboratory for preparation and analysis.
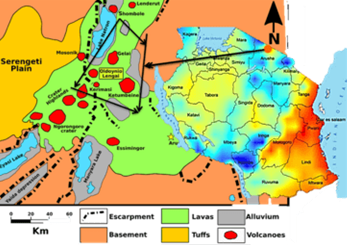
Figure 2.1: Geological location of Oldoinyo Lengai
2.2. Sample Preparations and measurement
The carbonatite rock samples were crushed and pulverized into smaller pieces so that the samples can be reduced into approximately 75 m size of fine powdered rock to enhance homogeneity of the element in the samples. Figure 2.2 shows the laboratory rock crusher.
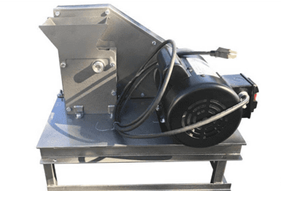
Figure 2.2: The Laboratory rock crusher/pulveriser (Kerur et al. 2010)
In order to remove the moisture, the samples were dried in the oven at 110o C for 24 hrs. Using the electronic beam balance with sensitivity of 0.01 mg, the weight of the dried sample was measured. By using a pressure sensitive tape for air tight, the 20 mm level canister was used to seal 150 g of each sample as well as reference materials in order to avoid any possibility for radon escape. Both samples and reference materials were left for twenty one days in a well-sealed canister in order to allow the secular radioactive equilibrium between 226Ra and its short lived decay products. When the equilibrium was reached, the samples were analyzed using the gamma – ray spectrometer with high purity germanium detector (HPGe)(Makundi et al. 2018). The activity of natural radionuclides present in the rock samples were measured using the n-type coaxial high purity germanium detector system (HPGe) model number GEM40-83-SMP and serial number: 57P51572A. The detector has relative efficiency of 49% and energy resolution of full width at half maximum (FWHM) of 1.8 Kev for 1332 KeV energy of 60Co. It was connected to Digital Spectrum Analyzer (DSA) with operating system of Gamma-version 8 software for data acquisition and analysis. The detector shielding consists of three layers of copper (30 mm thick), cadmium (30 mm thick) and lead (100 mm thick). This arrangement of shielding helps to reduce background scattering. In order for peaks to form, each sample was measured for 24 hours. Under the same condition as the measurement of the samples, the background level in counting room was measured and subtracted from spectra recorded from the samples. The activity concentration of 238U, 232Th and their decay product as well as 40K were calculated from the progeny photopeaks under the secular equilibrium assumption using equation (1).
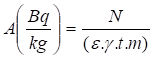 (1)
(1)
whereby A is the specific activity of radionuclides in Becquerel per kilogram (Bqkg-1), N is the net peak area under the most prominent photo peaks, is detector efficiency of the specific gamma ray, the absolute transition probability of gamma decay, t is the counting time in seconds and m is the mass of the rock samples in kilogram (kg) (Akkurt and Günoǧlu 2014) Evaluation of accuracy of gamma spectrometer needs calibration so that the relation between parameters such as spectrum channel number and energy as well as spectrum counts and activity can be well defined. To ensure accuracy of measurements, evaluation of detector efficiency and energy calibration were done daily before commencing analysis of the rock samples. The MBSS 2 standard source (with 137Cs, 60Co, 241Am radionuclides) among others was used in this study for evaluating the detection efficiency of the detector. Moreover for energy calibration, the canister containing the standard reference material (malt-nuclide) was placed on the top of the detector for 10 hours and the relationship between gamma photon energy with its corresponding channel number in the spectrum was observed. Calibrations was done using a computer program ISOCS (In-Situ Object Calibration Software) developed by Canberra Company. Figure 2.3 shows the energy spectrum for standard sources.
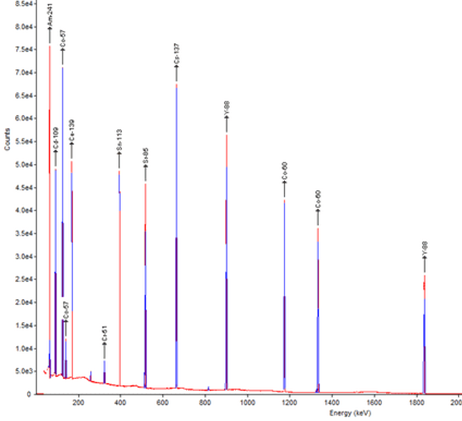
Figure 2.3: Energy spectrum for standard sources
The validation process of HPGe detector was done where by parameters such as linearity, detection limit as well as the degree of accuracy were investigated in order to avoid the wrong measurement of activity concentration of radionuclides of interest. The multi-nuclide standard with certificate No 9031-OL-022\13 type MBSS 2 from Czech Metrological Institute with reference date 8th February 2013 was used to check the validation of HPGe detector. By placing the canister containing standard reference material on the top of the detector for 36000 seconds, its activities for different energies were estimated and compared with the certified values calculated on the day of the measurement. The activity at the date of counting was calculated after correction for decay of the radionuclides. The obtained data were used in uncertainty evaluation associated with the measurements.
RESULTS AND DISCUSSION
3.1 Activity Concentration of Radionuclides in the Carbonatite Rock Samples
Table 3.1: The activity concentration of 232Th, 226Ra and 40K (Bqkg-1) in carbonatite rock samples
| Activity concentrations (Bqkg-1 ± SEM) | ||||
| Sample Region | Sample Name | 232Th | 226Ra | 40K |
| Gelai | GE1 | 44.44±2.39 | 37.68±2.47 | 968.62±46.85 |
| East | GE2 | 42.77±2.92 | 42.50±2.62 | 1138.60±53.24 |
| Gelai | GN1
GN2 |
41.44±2.30 | 44.62±2.79 | 823.60±41.02 |
| North | 43.41±2.95 | 41.5±2.65 | 1024.90±48.30 | |
| Gelai | GS1 | 46.72±2.45 | 39.38±2.67 | 1103.9±52.07 |
| South | GS2 | 40.90±2.51 | 44.4±2.45 | 761.94±35.73 |
| GS3 | 46.07±3.27 | 42.48±2.61 | 906.59±43.07 | |
| Gelai | GW1 | 70.62±3.95 | 58.18±3.42 | 1657±76.14 |
| West | GW2 | 73.04±4.84 | 52.31±3.51 | 1687.50±78.77 |
| GW3 | 121.15±6.06 | 95.53±4.46 | 1271.30±57.77 | |
| Ketumbeine | KE1 | 40.78±2.90 | 47.41±2.69 | 728.25±34.97 |
| East | KE2 | 46.60±3.23 | 42.36±2.66 | 815.24±39.81 |
| KE3 | 42.39±3.02 | 41.10±2.64 | 897.67±43.41 | |
| Ketumbeine | KN1 | 40.61±2.21 | 43.78±2.85 | 752.62±37.65 |
| North | KN2 | 37.85±2.40 | 49.12±2.73 | 810.13±38.81 |
| Ketumbeine | KS1 | 47.3±2.83 | 54.24±2.85 | 1002.50±47.70 |
| South | KS2 | 84.06±4.49 | 64.53±3.36 | 1391.70±62.88 |
| KS3 | 44.34±2.66 | 43.03±2.32 | 1121.10±50.31 | |
| Ketumbeine | KW1 | 90.68±5.31 | 65.03±3.36 | 1464.60±67.40 |
| West | KW2 | 36.18±1.86 | 35.45±1.73 | 737.15±32.42 |
| Natron | NE1 | 35.62±2.53 | 32.84±2.02 | 700.94±33.30 |
| East | NE2 | 36.47±2.50 | 34.58±2.13 | 729.12±35.34 |
| Natron | NN1 | 30.66±2.38 | 25.42±1.62 | 625.84±30.39 |
| North | NN2 | 35.05±2.10 | 27.78±1.66 | 538.76±25.68 |
| Natron | NS1 | 111.23±5.75 | 85.49±4.12 | 1185.80±55.24 |
| South | NS2 | 41.70±2.52 | 40.95±2.44 | 854.63±40.52 |
| Natron | NW1 | 42.10±2.22 | 40.22±1.98 | 1029.70±40.52 |
| West | NW2 | 48.29±2.56 | 39.82±2.16 | 795.71±36.32 |
| NW3 | 47.27±3.10 | 42.59±2.24 | 703.14±33.80 | |
| NW4 | 42.88±2.49 | 37.16±2.20 | 768.36±35.55 | |
| Average activity | 51.754±3.09 | 46.383±2.647 | 966.564±16.968 | |
| Concentration Std. Dev. | 22.44±1.11 | 15.03±0.66 | 293.42±13.3 | |
Key: SEM – Standard error of the mean
The activity concentrations of radionuclides in carbonatite rocks at Oldoinyo Lengai were observed to vary depending on the site where the samples were taken. As Table 3.1 shows, the activity concentration of carbonatite rock samples varied from 25.42 to 95.53 Bqkg-1 with an average concentration of 46.383 ± 2.647 Bqkg-1 for 226Ra. The activity ranged from 30.66 to 121.15 Bqkg-1 with an average concentration of 51.754 ± 3.09 Bqkg-1 for 232Th and the activity concentration of 40K varied from 538.76 to 1464.6 Bqkg-1 with an average concentration of 966.564 ± 16.968 Bqkg-1. Data presented in Table 3.1 reveal that 40K has the highest activity concentration among the radioisotopes identified in this study. This is due to the fact that carbonatite rocks of Oldoinyo Lengai are naturally rich in potassium (Mitchell 2005). From Table 3.1, it is also observed that the activity concentration of 232Th in carbonatite rock samples is higher than activity concentration of 226Ra. The reason may be the large difference in the mobility of the two elements. Uranium, the parent of 226Ra is quite mobile while thorium is much less mobile compared to uranium. Therefore, thorium concentration is more likely to remain higher in the carbonatites than Uranium (Achola 2009). The distribution of 226Ra, 232Th, and 40K at different sampling sites along with their respective Global Average Values (GAV) are displayed in Figure 3.1
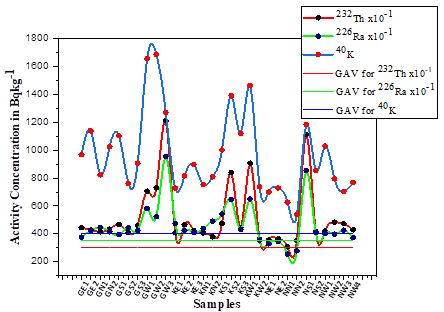
Figure 3.1: The activity concentration of 232Th, 226Ra and 40K for all samples.
The data revealed by Figure 3.1 show that in some of collected samples the activity concentration was found to be high compared to other samples. For instance the highest activity concentration for both 226Ra and 232Th were detected in sample GW3 which was collected from Gelai west whereas for sample NN1 which was collected from Natron north, the activity concentration of both 226Ra and 232Th was low. On other hand, the highest activity concentration for 40K was detected in the sample KW1 from Ketumbeine west. The lowest concentration of 40K was seen in sample NN3 collected from Natron north. Figure 3.1 reveals that the activity concentrations for 226Ra, 232Th and 40K were almost uniform is some samples such as KE1, KE2 and KE3. In some samples such as GN1, KS2 and KW2 the activity concentrations were completely not uniform. These variations of activity concentration were due to variations of concentrations of radionuclides and their geographical formation at different sampling sites. The global average activity concentrations for 226Ra, 232Th and 40K are 35 Bq/kg, 30 Bq/kg and 400 Bq/kg respectively (UNSCEAR 2000 and Akkurt et al. 2010). However, it can be observed from Figure 3.1 that for all collected carbonatite rock samples in this study, the activity concentration of both 232Th and 40K were above the recommended GAV. It is only in few samples the activity concentration of 226Ra was below the recommended GAV. This indicates that the activity concentration of 226Ra, 232Th and 40K in carbonatite rocks of Oldoinyo Lengai are higher than the tolerable limit.
The variation of each radionuclide concentration in carbonatite rock sample was expressed by its standard deviation via its frequency distribution curve. It was observed from Figure 3.2 that the standard deviation of 40K was high compared to that of 232Th and 226Ra. Thus 40K demonstrated the wide bell curve. This indicates that difference in concentration for 40K was high throughout all samples compared to the difference in concentration for 232Th and 226Ra in one sample to another. In addition to that, the wide bell curves and their asymmetry nature of radionuclide distribution exhibited by 232Th, 226Ra and 40K indicate the inconsistence in concentrations and multi-modal feature of radionuclides in carbonatite rocks from Oldoinyo Lengai. This multi-modal feature indicates the complexity of minerals in carbonatite rocks.
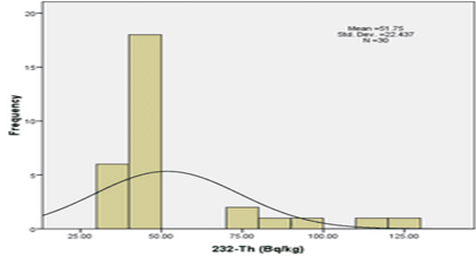
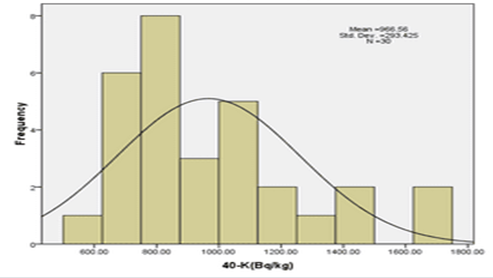
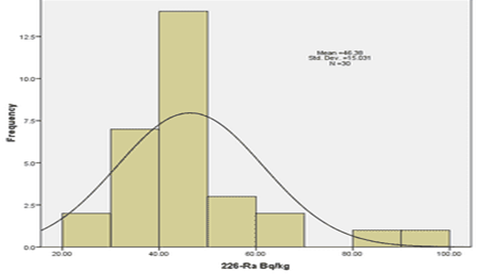
Figure 3.2: Frequency distribution curves of 232Th, 226Ra and 40K
3.2 Comparison of Radionuclide Concentrations in Carbonatite Rocks from different Areas.
Due to complexities in composition of carbonatite rocks, results of this study were compared to results reported from other areas associated with carbonatite rocks.
Table 3.2: Comparison of radionuclide concentrations (Bq/kg) in carbonatite rocks from different areas.
| Country | Region | 232Th | 226Ra | 40K | Reference |
| Kenya | Lambwe East | 1396.8 | 178.69 | 508.67 | Achola et al. 2012 |
| Mrima hills | 500 | 207 | 805 | Kebwaro et al 2011 | |
| Homa bay | 409 | 195 | 915 | Otwama et al 2012 | |
| Turkey | Inspatra | 244.4 | 231.4 | 1743 | Coban 2019 |
| volcanic areas | |||||
| Norway | Rauhaugite (carbonatite | 600 | 120 | 60 | Sundal 2004 |
| associated rocks) | |||||
| Rodberg (carbonatite | 3100 | 70 | 310 | Sundal 2004 | |
| associated rocks) | |||||
| Tanzania | Oldoinyo Lengai | 51.754 | 46.383 | 966.564 | Present study |
| World Average | 30 | 35 | 400 | UNSCEAR 2000 and Akkurt et al. 2010 |
The data revealed by Table 3.2 show that radionuclide concentrations were also high in carbonatite rocks of different areas. Carbonatite rock such as that of Lambwe East in Kenya and in Rodberg (carbonatite associated rocks) in Norway had extremely high concentration of 232Th compared to carbonatite rocks of Oldoinyo Lengai. This is due to the fact that they contain large amount of monazite minerals which acts as the chief source of thorium (René 2017). However, low concentration of 232Th in carbonatite rocks of Oldoinyo Lengai may be due to their less amounts of monazite minerals. A large difference in the concentration of 40K in different carbonatite rocks was also observed. For instance, as shown by Table 3.2, the concentration of 40K carbonatite rocks from Rauhaugite and Rodberg in Norway and Lambwe East Kenya were low compared to that found in Oldoinyo Lengai. Table 3.2 shows that, in the rocks of Isparta volcanic area, the concentration of radionuclide 226Ra, 232Th and 40K were high since the origin of Isparta potassic volcanism was associated with a common and enriched mantle source, which interacted with the carbonatite melts (Çoban, 2019).
3.3 Comparison of Radionuclide Concentrations in Carbonatite Rocks of Oldoinyo Lengai with other type of Rocks.
As reported by various studies, the various radionuclide concentrations are not only found in carbonatite rocks but also in other different type of rocks. In other rocks, the concentration of 226Ra, 232Th and 40K were even higher compared to carbonatite rocks of Oldoinyo Lengai and much higher when compared to the recommended average global value as indicated in Table 3.3.
Table 3.3: Concentrations of radionuclides (Bqkg-1) in different rocks from different regions
| Place | Type of rock | 2323Th | 226R | 40K | References |
| Turkey | Sedimentary | 31.92 | 34.66 | 243.08 | Akkurt and Günoǧlu 2014 |
| India (Dhanbad) | Mainly Calc-silicate rocks and crystalline limestone | 18.45 | 51.34 | 311.74 | Zubair 2015 |
| China (Cuihua ) | Granite and migmatite | 30.1 | 10.7 | 1009.5 | Lu and Zhang 2008 |
| Egypt | Gneiss | 37.7 | 28.4 | 1167.6 | Harb et al. 2012 |
| Granite | 90.5 | 118 | 2208 | Harb et al. 2012 | |
| Basalt | 67.7 | 59.4 | 718.5 | Harb et al. 2012 | |
| India (North Karnataka) | Basalt in Gulbarga area | 73.27 | 47.05 | 1061.99 | Kerur et al. 2010 |
| Basalt in Gadag area | 7.25 | 4.89 | 120.66 | Kerur et al. 2010 | |
| Basalt in Kottur area | 20.86 | 45.91 | 874.92 | Kerur et al. 2010 | |
| Yemen (Juban town) | Granite | 127 | 53.6 | 1742.8 | Abd El-mageed et al. 2011 |
| Gneiss | 121 | 55 | 2341 | Abd El-mageed et al. 2011 | |
| Malaysia (Johor) | Granite | 52 | 39 | 611 | Alnour et al. 2012 |
| Iran | Granite | 75 | 72.2 | 1192.5 | Asgharizadeh et al. 2012 |
| India (Punjab) | Granite | 315.4 | 65.9 | 653 | Bathan et al.2009 |
| Sand stones | 102 | 37 | 246 | Bathan et al.2009 | |
| Tanzania | Carbonatite | 51.76 | 46.38 | 966.56 | Present study |
| World global average | 30 | 35 | 400 | UNSCEAR 2000 |
Table 3.3 shows that, 40K concentration was extremely high in other rocks such as granite rock of Iran, Yemen (Juban town), Egypt and China (Cuihua) as well as basalt rocks of Kottur area in India. The concentrations of 226Ra and 232Th were also high in other rocks such as granite rocks of India (Punjab) and Egypt. This indicated that like in carbonatite rocks of Oldoinyo Lengai, even other rocks may have radioactivity levels that are intolerable to human beings. Since the activity level play the significant role in determining radiation exposure, then from Table 3.3, one should note that radiation exposure in a given area depends on carbonatite rocks together with other types of rocks.
3.4 Evaluation of Hazards Associated with Radionuclides in Carbonatite Rocks at Oldoinyo Lengai.
Radiation health risks are health effects resulting from one’s exposure to high level of radiation. The source of radiation may be the naturally occurring radioactive materials present on the earth’s environment. High level of radionuclide concentrations in the environment, results to high level of radiation exposure to the surroundings. Although low level of radiation may not cause the immediate health problems, long-term exposure to such radiations may contribute to long-term health problems. That is, long term exposure to radiation, even at the level of natural background radiation results to long-term health effect such as cancer and cardiovascular diseases (Spycher et al. 2015). In this study, radiation health risk assessment was done via radiological hazard indices by considering the activity concentrations of radionuclides. These indices were given by the United Nations Scientific Committee on the Effects of Atomic Radiation (UNSCEAR) to determine the tolerable level at which one can be exposed to radiation without any significant harm (Akkurt et al. 2010). Table 3.4 presents the radiological hazard indices values calculated from 226Ra, 232Th and 40K concentrations in carbonatite rocks of Oldoinyo Lengai.
Table 3.4: Radiological hazard indices values
| Sample | Do | Din | AEDo | AEDin | Raeq | Hex | Hin | ECLR | |||||||
| GE1 | 84.64±4.5 | 161.04±8.6 | 0.1±0.006 | 0.8±0.01 | 847.07±41.96 | 0.47±0.03 | 0.58±0.03 | 0.7 | 1.34 | 0.0028 | |||||
| GE2 | 92.95±5.2 | 177.24±9.9 | 0.11±0.006 | 0.9±0.01 | 980.38±47.79 | 0.52±0.03 | 0.63±0.04 | 0.7 | 1.47 | 0.003 | |||||
| GN1 | 79.99±4.4 | 152.52±8.4 | 0.1±0.005 | 0.7±0.01 | 738.05±37.66 | 0.45±0.02 | 0.57±0.03 | 0.6 | 1.26 | 0.0026 | |||||
| GN2 | 88.13±5 | 167.92±9.5 | 0.11±0.006 | 0.8±0.01 | 892.75±44.06 | 0.49±0.03 | 0.61±0.04 | 0.7 | 1.39 | 0.0029 | |||||
| GS1 | 92.45±4.9 | 175.93±9.3 | 0.11±0.006 | 0.9±0.01 | 956.19±46.27 | 0.52±0.03 | 0.62±0.03 | 0.7 | 1.47 | 0.003 | |||||
| GS2 | 76.99±4.1 | 146.79±7.9 | 0.09±0.005 | 0.7±0.01 | 689.58±33.55 | 0.44±0.02 | 0.56±0.03 | 0.6 | 1.21 | 0.0025 | |||||
| GS3 | 85.26±5 | 162.29±9.4 | 0.1±0.006 | 0.8±0.01 | 806.43±40.45 | 0.48±0.03 | 0.6±0.04 | 0.7 | 1.35 | 0.0028 | |||||
| GW1 | 138.6±7.1 | 263.77±14 | 0.17±0.009 | 1.3±0.02 | 1435.05±67.7 | 0.77±0.04 | 0.93±0.05 | 1.1 | 2.2 | 0.0045 | |||||
| GW2 | 138.7±7.8 | 263.47±15 | 0.17±0.01 | 1.3±0.02 | 1456.13±71.08 | 0.77±0.04 | 0.92±0.05 | 1.1 | 2.2 | 0.0045 | |||||
| GW3 | 170.3±8.1 | 322.86±15 | 0.21±0.01 | 1.6±0.02 | 1247.68±57.61 | 0.99±0.05 | 1.25±0.06 | 1.3 | 2.7 | 0.0055 | |||||
| KE1 | 76.9±4.5 | 146.74±8.5 | 0.09±0.005 | 0.7±0.01 | 666.48±33.76 | 0.44±0.03 | 0.57±0.03 | 0.6 | 1.21 | 0.0025 | |||||
| KE2 | 81.71±4.8 | 155.45±9.2 | 0.1±0.006 | 0.8±0.01 | 736.73±37.93 | 0.46±0.03 | 0.58±0.04 | 0.6 | 1.29 | 0.0027 | |||||
| KE3 | 82.02±4.9 | 156.25±9.2 | 0.1±0.006 | 0.8±0.01 | 792.92±40.38 | 0.46±0.03 | 0.57±0.03 | 0.6 | 1.3 | 0.0027 | |||||
| KN1 | 76.14±4.2 | 145.16±8.1 | 0.09±0.005 | 0.7±0.01 | 681.37±35 | 0.43±0.02 | 0.55±0.03 | 0.6 | 1.2 | 0.0025 | |||||
| KN2 | 79.34±4.3 | 151.64±8.3 | 0.1±0.005 | 0.7±0.01 | 727.05±36.05 | 0.45±0.02 | 0.58±0.03 | 0.6 | 1.25 | 0.0026 | |||||
| KS1 | 95.43±5 | 182.13±9.6 | 0.12±0.005 | 0.9±0.01 | 893.80±43.63 | 0.54±0.03 | 0.68±0.04 | 0.8 | 1.5 | 0.0031 | |||||
| KS2 | 138.6±6.9 | 263.17±13 | 0.17±0.006 | 1.3±0.02 | 1256.3±58.2 | 0.79±0.04 | 0.96±0.05 | 1.1 | 2.2 | 0.0045 | |||||
| KS3 | 93.41±4.8 | 178.05±9.1 | 0.11±0.008 | 0.9±0.01 | 969.68±44.86 | 0.52±0.03 | 0.64±0.03 | 0.7 | 1.48 | 0.003 | |||||
| KW1 | 145.9±7.6 | 276.74±14 | 0.18±0.006 | 1.4±0.02 | 1322.44±62.85 | 0.83±0.04 | 1.01±0.05 | 1.2 | 2.32 | 0.0048 | |||||
| KW2 | 68.97±3.3 | 131.38±6.2 | 0.08±0.009 | 0.6±0.01 | 654.79±29.35 | 0.39±0.02 | 0.48±0.02 | 0.5 | 1.09 | 0.0023 | |||||
| NE1 | 65.92±3.8 | 125.47±7.3 | 0.08±0.004 | 0.6±0.01 | 623.50±31.28 | 0.37±0.02 | 0.46±0.03 | 0.5 | 1.04 | 0.0022 | |||||
| NE2 | 68.41±4 | 130.26±7.5 | 0.08±0.005 | 0.6±0.01 | 648.15±32.92 | 0.39±0.02 | 0.48±0.03 | 0.5 | 1.08 | 0.0022 | |||||
| NN1 | 56.36±3.5 | 107.18±6.5 | 0.07±0.005 | 0.5±0.01 | 551.16±28.42 | 0.32±0.02 | 0.39±0.02 | 0.4 | 0.89 | 0.0018 | |||||
| NN2 | 56.47±3.1 | 107.21±5.9 | 0.07±0.004 | 0.5±0.01 | 492.75±24.44 | 0.32±0.02 | 0.4±0.02 | 0.4 | 0.89 | 0.0018 | |||||
| NS1 | 156.1±7.7 | 295.87±15 | 0.19±0.004 | 1.5±0.02 | 1157.61±54.88 | 0.91±0.02 | 1.14±0.06 | 1.2 | 2.47 | 0.005 | |||||
| NS2 | 79.74±4.3 | 151.91±8.3 | 0.1±0.009 | 0.7±0.01 | 758.65±37.24 | 0.45±0.02 | 0.56±0.03 | 0.6 | 1.26 | 0.0026 | |||||
| NW1 | 86.95±3.9 | 165.69±7.5 | 0.11±0.008 | 0.8±0.01 | 893.29±36.36 | 0.49±0.04 | 0.59±0.03 | 0.7 | 1.38 | 0.0028 | |||||
| NW2 | 80.75±4.1 | 153.41±7.7 | 0.1±0.005 | 0.8±0.01 | 721.57±33.79 | 0.46±0.02 | 0.57±0.03 | 0.6 | 1.28 | 0.0026 | |||||
| NW3 | 77.55±4.3 | 147.43±8.2 | 0.1±0.005 | 0.7±0.01 | 651.60±32.7 | 0.44±0.02 | 0.56±0.03 | 0.6 | 1.23 | 0.0025 | |||||
| NW4 | 75.11±4 | 142.82±7.6 | 0.09±0.006 | 0.7±0.01 | 690.12±33.13 | 0.43±0.03 | 0.53±0.03 | 0.6 | 1.19 | 0.0025 | |||||
| Mean | 93±4.97 | 176.9±9.45 | 0.11±0.006 | 0.87±0.01 | 864.65±41.84 | 0.53±0.03 | 0.65±0.04 | 1.47 | 0.74 | 0.003 | |||||
| Std.Dev | 30 | 56.74 | 0.34 | 0.28 | 260.17 | 0.17 | 0.21 | 0.48 | 0.24 | 9.7×10⁻⁴ | |||||
3.4.1 Outdoor Absorbed Dose Rate (Do)
The absorbed outdoor terrestrial radiation dose rate in air at a height of 1 m above the ground surface was computed from Equation (2)
![]() (2)
(2)
based on the guidelines provided by UNSCEAR 2000. The calculation formula was obtained from Akkurt et al. 2010 and Mehra et al. 2009. As shown in Table 4.4, the outdoor absorbed dose rate ranged from 56.36 to 170.32 nGy⋅h−1 with mean value of 93 ± 4.97 nGy⋅h−1 which was above the global average value of 55 nGy⋅h−1 (UNSCEAR 2000 and Akkurt et al. 2010). It was also observed that, Do values vary from one site to another. This variation is displayed in Figure 3.3.
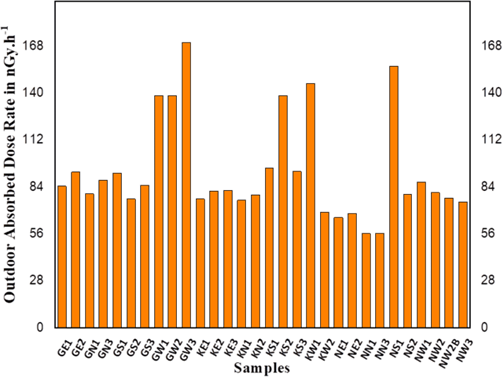
Figure 3.3: Variation of Do at Oldoinyo Lengai.
3.4.2 Indoor Absorbed Dose Rate (Din)
The imparted indoor gamma dose by the emission of gamma-ray from 232Th, 226Ra, and 40K in carbonatite rock samples when used as the building materials was calculated based on Equation (3),
![]() (3)
(3)
The equation was obtained from Isinkaye and Emelue 2015 and Qureshi et al. 2014 for a standard room of dimensions 4 m x 5 m x 2.8 m. Table 4.4 shows that, the indoor absorbed dose rate ranged from 107.18 to 322.86 nGy⋅h−1 with mean value of 176.93 ± 9.45 nGy⋅h−1 which was above the global average value of 84 nGy⋅h−1 (Isinkaye and Emelue 2015). The variation of Din was observed to vary from one site to another as shown in Figure 3.4.
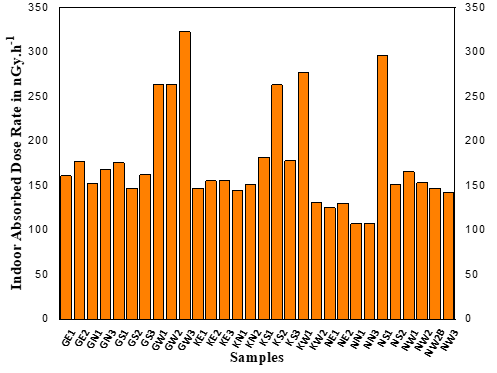
Figure 3.4: Variation of Din at Oldoinyo Lengai.
Moreover, from Figure 3.4, it was observed that the Din values were higher than Do values. This indicates that using carbonatite rocks of Oldoinyo Lengai as building materials leads to higher amount of indoor absorbed dose rate. The Din and Do values were also used to determine the annual outdoor and indoor effective doses.
3.4.3 The Annual Outdoor Effective dose rates (AEDo)
In order to test the health effect of the outdoor absorbed dose rates, the annual outdoor effective dose rates were obtained. The annual effective dose equivalent for adults from outdoor terrestrial gamma radiation was calculated from Equation (4)
![]() (4)
(4)
which was given by Akkurt and Günoǧlu 2014 and Kljajevi et al. 2012. From Table 4.4, the annual outdoor effective dose rate values varied from 0.07 to 0.21 mSv⋅y−1 with the mean value of 0.11±0.06 mSv⋅y−1. The obtained outdoor effective dose rate was greater than the global average value of 0.07 mSv⋅y−1 in areas with the normal background radiation (UNSCEAR 2000 and Kljajevi et al. 2012). The variation of AEDo in all sites is displayed in Figure 3.5.
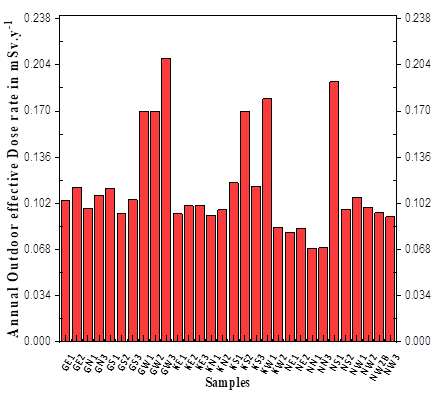
Figure 3.5: Variation of AEDo at Oldoinyo Lengai.
3.4.4 The Annual Indoor Effective dose rates (AEDin)
Annual indoor effective dose equivalent to the population due to radioactivity in carbonatite rock samples was computed from Equation (5)
![]() (5)
(5)
The equation was given by UNSCEAR 2000 and Isinkaye and Emelue 2015. Table 4.4 shows that the overall mean for the annual indoor effective dose rate was 0.87±0.01 mSv.y-1 with range values from 0.53 – 1.58 mSvy-1. However, the AEDin was greater than the world’s average value of 0.41 mSv.y-1 (UNSCEAR 2000 and David 2012). The variation of AEDin from one site to another is displayed in Figure 3.6.
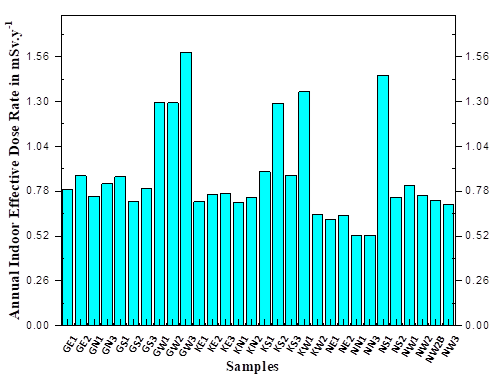
Figure 3.6: Variation of AEDin at Oldoinyo Lengai.
Moreover, from Figure 3.6, it was observed that the annual indoor effective dose rates were higher than that of the outdoors. This signifies that more radiation health effect results from absorbed indoor dose rate.
3.4.5 Comparison of hazard indices due to radionuclides in carbonatite rocks at Oldoinyo Lengai with the indices reported elsewhere.
The rate of radiation health effect as determined via annual effective doses varies depending on annual absorbed doses of a given area (David 2012). In that context, results from this study were compared to results reported from other areas associated with carbonatite rocks. As Table 3.5 shows, in other areas associated with carbonatite rocks, the values of Do, Din and AEDo were higher than that of Oldoinyo Lengai. For instance, areas such as Lambwe East and Homa bay in Kenya had higher values of Do and Din than the global recommended limit hence resulting to high values of AEDo. This signifies high radiation exposure in those areas than in Oldoinyo Lengai. Furthermore, the data shown in Table 3.5 reveal that, although the population of Oldoinyo Lengai faces intolerable level of radiation exposure, the populations of Lambwe East and Homa bay in Kenya are more likely to encounter radiation health risks.
Table 3.5: Comparison of Do, Din AEDo and AEDin of carbonatite rocks in Oldoinyo Lengai region and other areas associated with carbonatite rocks.
| Country | Region | Do | Din | AEDo AEDin | Reference |
| Kenya | Lambwe East | 2326 | – | 5.7 – | Achola et al. 2012 |
| Mrima hills | 440.7 | 1.1 – | Kebwaro et al 2011 | ||
| Homa bay | 383.3 | – | 4.9 – | Otwama et al 2012 | |
| Norway | Rauhaugite (carbonatite associated rocks) | – | 200 | – 1 | Sundal and strand 2004 |
| Rodberg (carbonatite associated rocks) | – | 110 | – 0.06 | Sundal and strand 2004 | |
| Tanzania | Oldoinyo Lengai | 93 | 176.9 | 0.11 0.87 | Present study |
| World Average | 55 | 84 | 0.07 0.41 | UNSCEAR 2000 and David 2012 |
Meanwhile, the elevated values of Din, Do, AEDo and AEDin were also observed in other type of rocks. As Table 3.6 shows, granite rocks of Egypt and Yemen (Juban) resulted to high radiation exposure due to their high values in Do and AEDo. It was also observed that AEDo due to granite and sand stones rocks in Punjab, India as well as basalt rocks of Gulbarga area was higher than that of Oldoinyo Lengai and the recommended global average value. These variations in hazard indices depends on the amount of radionuclide concentration present in a given type of the rock (Kljajevi et al. 2012). Therefore, the information revealed in Table 3.6 indicates that radiation exposure together with its health effects can be enhanced by varieties of rocks around a given area.
Table 3.6: Comparison of hazard indices due to radionuclide in carbonatite rocks at Oldoinyo Lengai with the indices reported in other rocks.
| Place | Type of rock | Do | Din | AEDo | AEDin | References |
| Turkey | Sedimentary | 45.43 | – | 0.056 | – | Akkurt and Günoǧlu 2014 |
| India (Dhanbad) | Mainly Calc-silicate rocks and | – | – | 0.016 | 0.125 | Zubair 2015 |
| crystalline limestone | – | – | ||||
| China (Cuihua ) | Granite and migmatite | 69.7 | – | 0.086 | – | Lu and Zhang 2008 |
| Egypt | Gneiss | 92.7 | – | – | – | Harb et al. 2012 |
| Granite | 201.2 | – | – | – | Harb et al. 2012 | |
| Basalt | 97.35 | – | – | – | Harb et al. 2012 | |
| India (North Karnataka) | Basalt in Gulbarga area | 110.3 | – | 0.14 | – | Kerur et al. 2010 |
| Basalt in Gadag area | 11.65 | – | 0.014 | – | Kerur et al. 2010 | |
| Basalt in Kottur area | 70.3 | – | 0.09 | – | Kerur et al. 2010 | |
| Yemen (Juban town) | Granite | 173.3 | – | – | – | Abd El-mageed et al. 2011 |
| Gneiss | 195.9 | – | – | – | Abd El-mageed et al. 2011 | |
| Malaysia (Johor) | Granite | 74.8 | – | 0.09 | – | Alnour et al. 2012 |
| Iran | Granite | 0.3 | – | Asgharizadeh et al. 2012 | ||
| India (Punjab) | Granite | 253.9 | – | 0.31 | 1.2 | Bathan et al.2009 |
| Sand stones | 93.79 | – | 0.46 | 0.46 | Bathan et al.2009 | |
| Tanzania | Carbonatite | 93 | 176.9 | 0.11 | 0.87 | Present study |
| World global average | 55 | 84 | 0.07 | 0.41 | UNSCEAR 2000 |
3.4.6 Radium equivalent activity (Raeq)
Due to the non-uniform distributions of radionuclides in carbonatite rocks, radium equivalent activity is defined as a single radiological parameter that compares the specific activity of materials containing varying concentrations of 232Th, 226Ra and 40K (Isinkaye and Emelue 2015). The radium equivalent activity is a weighted sum of activities of the 226Ra, 232Th, and 40K radionuclides based on the assumption that 370 Bq/kg of 226Ra, 259 Bq/kg of 232Th, and 4810 Bq/kg of 40K produce the same gamma-ray dose rate (Makundi et al. 2018). Radium equivalent activity was calculated from Equation (6)
![]() (6)
(6)
as suggested by El-mageed et al. 2011and Uosif et al. 2015.
From Table 4.4, the observed radium equivalent activity in this study ranged from 492.75 Bqkg-1 to 1456.13 Bqkg-1 with an average value of 864.65 ± 41.84 Bqkg-1. As recommended by UNSCEAR, this mean value was 2.3 times higher than the maximum permissible limit of 370 Bqkg-1 for radium equivalent activity (El-mageed et al. 2011). Therefore from the radiological protection point of view, the carbonatite rocks can lead to a potential radiation risk when used as materials especially in activities such as building construction. The radium equivalent was observed to vary from one site to another as shown in Figure 3.7.
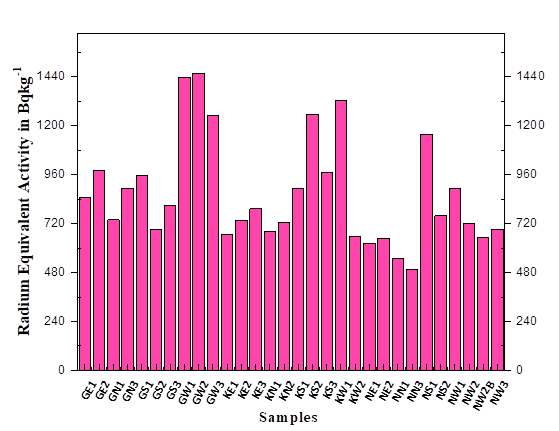
Figure 3.7: Variation of radium equivalent at Oldoinyo Lengai.
3.4.7 External and Internal Hazard Indices
The assessment of external exposure risks due to gamma rays was also done by considering the external and internal hazard indices (Hex and Hin). The external or internal exposure to radiation is generally said to be insignificant if the Hex and Hin are respectively less than unity. Both the Hex and Hin are evaluated by using the value of radium equivalent (Raeq). For the radiation exposure, the Raeq must be less than 370 Bqkg-1. In this work, the Hex for each sample was calculated according to Equation (7)
![]() (7)
(7)
(Makundi et al. 2018 and Akkurt and Günoǧlu 2014). Meanwhile, if the maximum concentration of radium is half that of the normal acceptable limit then Hin will be less than 1.0 (UNSCEAR 2000, David 2012). The internal hazard index (Hin) due to the emitted gamma rays for each sample was calculated according to Equation (8)
![]() (8)
(8)
(Isinkaye and Emelue 2015, David 2012). Figure 3.8 displays both the Hex and Hin.
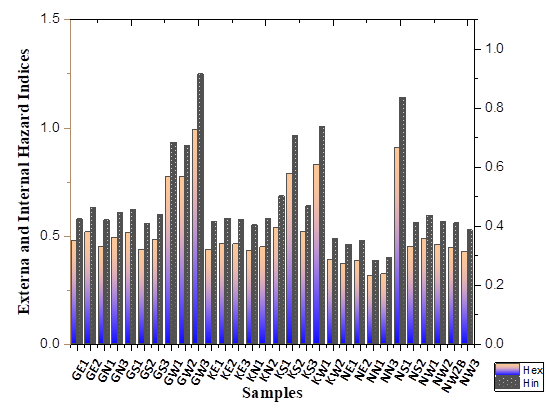
Figure 3.8: The external and internal hazard index for all samples at Oldoinyo Lengai.
Table 3.4 shows that, external hazard index varied between 0.32 and 0.99 with a mean value of 0.53± 0.03 while the internal hazard index ranged from 0.39 and 1.25 with a mean value of 0.65±0.04. The mean values were lower than the recommended global unit. Although the mean of Hex and Hin were less than a unit, Figure 3.8 reveals that Hex and Hin in some of collected carbonatite rock samples used in this study are higher than unity. A high value of both Hex and Hin in these samples is a good indicator of the significant radiation exposure due to the carbonatite rocks of Oldoinyo Lengai.
3.4.8 Representative level index (Iγτ )
In order to estimate the level of gamma radiation hazards associated with natural radionuclides in the carbonatite rock samples, the representative level index was determined. According to the ICRP-60 recommendation, this value should not exceed a unit (David 2012). In this work, the representative level index was calculated using Equation (9)
![]() (9)
(9)
(El-mageed et al. 2011). It was observed that the values of the representative level index ranged from 0.89 to 2.79 with a mean value of 1.5, which is above the recommended limit. Figure 3.9 displays the variation of representative level index among various sites at Oldoinyo Lengai.
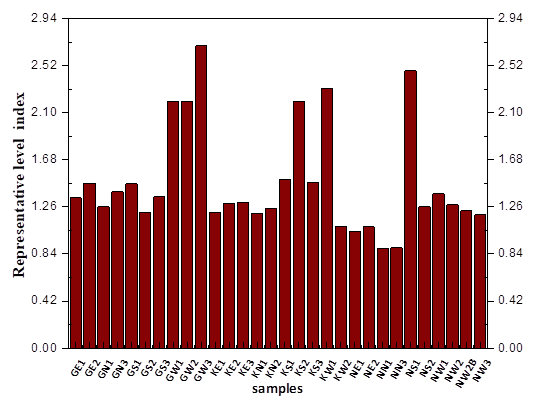
Figure 3.9: Variation of representative level index at Oldoinyo Lengai.
3.4.9 Gamma Activity Index (Iγ )
In order to assess the excess external and indoor gamma radiation from carbonatite rocks, the gamma activity index was used. As proposed by the European Commission (EC), the gamma activity index should not exceed a unit. It was calculated using Equation (10)
![]() (10)
(10)
(David 2012). It was found that, the values of the gamma activity index ranged from 0.45 to 1.35 with a mean value of 0.74, which is below the recommended limit. However, as shown in Figure 3.10, in some samples such as GW1, GW2, GW3, KS2, KW1 and NS1 collected from Gelai, Ketumbeine and along Lake Natron, the gamma activity index was above the recommended limit. This indicates the excessive gamma radiation in some sites of Oldoinyo Lengai.
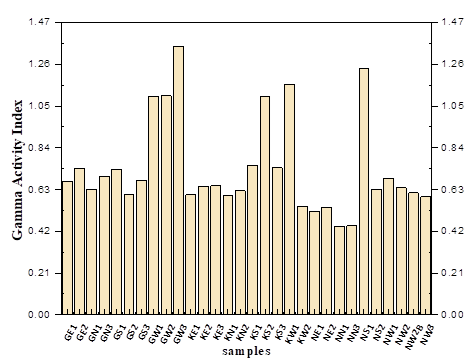
Figure 3.10: Variation of gamma activity index at Oldoinyo Lengai.
3.4.10 Excess lifetime cancer risk (ELCR).
In order to assess the probability or extra risk of developing lung cancer due to the indoor exposure to gaseous radionuclides incurred over the lifetime of an individual, the excess life time cancer risk index was evaluated using Equation (11)
![]() (11)
(11)
(Qureshi et al. 2014 and SureshGandhi et al. 2014). It was found that the ELCR due the indoor exposure ranged from 1.8 x 10⁻³ to 5.5 x 10⁻³ with an average value of 3 x 10⁻³. The ELCR obtained for the carbonatite rock samples collected from Oldoinyo Lengai was about 2.6 times higher than the global average value of 1.16 x 10⁻³ (Qureshi et al 2014). This indicates that people living at Oldoinyo Lengai for a long time have a higher risk of developing cancer problems. Figure 3.11 shows the excess lifetime cancer risk for different sites at Oldoinyo Lengai.
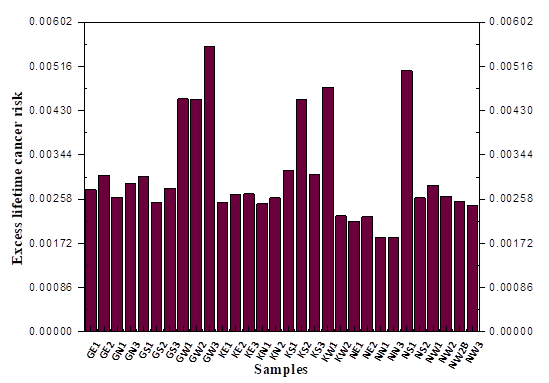
Figure 3.11: Excess lifetime cancer risk in different sites at Oldoinyo Lengai.
CONCLUSION AND RECOMMENDATIONS
4.1 Conclusion
In this study, radioactivity levels of thirty (30) carbonatite rock samples from Oldoinyo Lengai and the associated radiation risks were assessed. Such an assessment was important because excessive exposure to the low level natural background radiation may result to several health effects including cancer. The determination of activity concentrations of radionuclides of interest in carbonatite rocks was carried out using gamma ray spectrometry. All sample analyses were carried out at the TAEC laboratory in Arusha.
The analysis revealed that, carbonatite rocks from Oldoinyo Lengai contain 226Ra, 232Th and 40K at different concentrations. The average activity concentrations of 226Ra, 232Th and 40K in all collected carbonatite rocks were found to be 46.38 Bqkg-1, 51.75 Bqkg-1 and 966.56 Bqkg-1 respectively. The concentration of 40K was higher than that of 226Ra and 232Th perhaps due to the fact that carbonatite rocks of Oldoinyo Lengai are more potassic in nature (Mitchell 2005). Furthermore, the concentrations of all radionuclides in the carbonatite rocks from Oldoinyo Lengai were above the global average values and maximum limits given by the UNSCEAR. This means that the radioactivity levels at Oldoinyo Lengai due to carbonatite rocks are higher than the tolerable limits. Therefore, people at Oldoinyo Lengai seem to be exposed to high background radiation doses.
This study has also observed that, the elevated radioactivity levels in carbonatite rocks of Oldoinyo Lengai results into higher risks to radiation effects as indicated by the values of radiation hazard indices. Hazard indices such as Do, Din, AED, and ELCR were found to exceed the recommended global average limits. This signifies radiological health hazards at Oldoinyo Lengai. The higher values of Raeq and AED indicated that carbonatite rocks of Oldoinyo Lengai might be unsafe for uses as building materials. Hence, the intolerable radioactivity levels of 226Ra, 232Th and 40K in carbonatite rocks together with the elevated values of radiation hazard indices show that the population around Oldoinyo Lengai is at high risk of being affected by ionizing radiation from the carbonatite rocks.
4.2 Recommendations
This study has revealed high concentrations of radioactive elements in the carbonatite rocks at Oldoinyo Lengai, which hosts large deposits of carbonatite rocks. Following the weathering process, carbonatite rocks transform to soil, which may be rich in radioactive elements. Since soil is important for various activities including agriculture, the crops grown around Oldoinyo Lengai may also contain significant levels of radioactive elements leading to various problems to the consumers. Besides, when the soil is used as the building material, it may result to high indoor concentrations of radon gas, which may lead to lung cancer. The authors therefore recommend that a comprehensive study should be conducted to evaluate the radioactivity levels in soil and crops from Oldoinyo Lengai especially around the carbonatite deposits.
Meanwhile, volcanic eruptions caused by the active Mount Oldoinyo Lengai produces large quantities of volcanic carbonatite ashes, which may be inhaled by animals and humans living around the region. Thus, the authors of this work recommend that another study should be conducted at Oldoinyo Lengai to determine the amounts of carbonatite in the volcanic ashes and quantify the radioactivity concentrations in the ashes. This will help to understand the biological effects, which may arise from inhalation of volcanic ashes with high concentrations of radioactive elements.
The author of this work also recommend that, to mitigate the heightened radiation risks associated with the elevated levels of radioactive elements in the Oldoinyo Lengai carbonatite rocks, immediate measures should encompass strict protective protocols for workers and residents, continual monitoring, public education campaigns, environmental assessments, and research initiatives. Implementing regulations, setting local exposure limits, exploring alternative materials, and undertaking targeted remediation efforts can collectively minimize exposure and potential health hazards, ensuring the safety of the community and the environment in the vicinity of these rocks.
REFERENCES
- Abd El-mageed AI, El-Kamel AH, Abbady A, Harb S, Youssef AMM and Saleh II 2011 Assessment of and anthropogenic radioactivity levels in rocks and soils in the environments of Juban town .Radiat. Phys. Chem 80(6): 710-715.
- Achola SO 2009 Radioactivity and elemental analysis of carbonites rocks from parts of Gwasi area, south western Kenya. M.Sc. Thesis, University of Nairobi.
- Achola SO, Patel JP, Mustapha AO and Angeyo HK 2012 Natural radioactivity and associated radiation characteristics of the new high background radiation area of Lambwe East. Southwestern Kenya. Radiat Prot Dosim 152: 423–428.
- Agnello M, Botta E, Bressani T, Bruschi M, Bufalino SD, Napoli M and Zoccoli A 2009 Study of the Performance of HPGe Detectors Operating in very high Magnetic Fields. Nucl. Instrum. Methods Phys. Res. A: Accel. Spectrom. Detect. Assoc. Equip. 606(3): 560-568.
- Akkurt I and Günoǧlu K 2014 Natural radioactivity measurements and radiation dose estimation in some sedimentary rock samples in Turkey. Sci. Tech. Nucl. Install 2014: 1-6.
- Alnour IA, Wagiran H, Ibrahim N, Laili Z, Omar M, Hamzah S and Idi BY 2012 Natural Radioactivity Measurements in the Granite Rock of Quarry sites, Johor, Malaysia. Radiat. Phys. Chem. 81(12): 1842-1847
- Asgharizadeh F, Abbasi A, Hochaghani O and Gooya ES 2012 Natural Radioactivity in Granite Stones used as Building Materials in Iran. Radiat. Prot. Dosim, 149(3): 321-326.
- Barron AR and Raja PMV 2020 Principles of Gamma-ray Spectroscopy and Applications in Nuclear Forensics. OpenStax CNX, 17–20.
- Bathan K, Mehra R, Sonkawade RG and Singh S 2009 Use of Gamma Spectroscopy for assessment of Natural Radioactive Dose in Some Samples of Building materials. Asian J. Chem. 21 (10): 207-211.
- Baym G 2018 Interaction of Radiation with Matter. Lectures on Quantum Mechanics: 262-301.
- Bennun A 2021 High Energy Dimensioning the Quantum Space-Time of the Electron High energy Dimensioning the Quantum space-time of the Electron. June 2020.
- Berkesi M, Bali E, Bodnar RJ and Guzmics T 2020 Carbonatite and Highly Peralkaline Nephelinite Melts from Olodinyo Lengai Volcano, Tanzania. The role of natrite-normative fluid degassing. Gondwana Research 85: 76–83.
- Boniface N 2017 Crystal Chemistry of Pyrochlore from the Mesozoic Panda Hill Carbonatite Deposit, Western Tanzania. J. Afr. Earth Sci 126: 33-44.
- Carmody L 2012 Geochemical characteristics of carbonatite-related volcanism and sub-volcanic metasomatism at Oldoinyo Lengai, Tanzania. PhD Dissertation, University College London, UK.
- Chakhmouradian AR, Reguir EP and Zaitsev AN 2016 Calcite and dolomite in intrusive carbonatites. I. Textural variations. Mineralogy and Petrology 110: 333–360.
- Cherry SR, Sorenson JA and Phelps ME 2012 Electronic Instrumentation for Radiation Detection Systems. Med Phys: 107–124.
- Çoban H 2019 Derleme Makalesi/Review Article Investigation of the High Radiation Levels in Plio- Volcanic and Pyroclastic Rocks Used as Building Raw Materials in Isparta Volcanic Isparta (GB Türkiye) Volkanik Alanında Yapı Malzemesi Olarak Kullanılan Pli. 8: 77–83.
- Cohen J 2013 Statistical power analysis for the behavioral sciences. Academic press.
- David O 2012 An Investigation of the Radioecology of the Carbonatite deposits in the Homa Mountain region in South Nyanza, Kenya. December.
- Demir N and Kuluöztürk ZN 2021 Determination of Energy Resolution for a NaI(Tl) Detector Modeled with FLUKA code. Eng. Techno. 53(11): 3759–3763.
- Downes H, Wall F, Demeny A and Szabo C 2012 Continuing the carbonatite controversy: preface. Mineral Mag 76:255-257.
- Dutra M, Silva R and Silva MDR 2016 Livro : Evolution of ionizing radiation research/Cap . 8 Ionizing radiation detectors Ionizing Radiation Detectors. September.
- El-Gamal H and El-Haddad M 2019 Estimation of natural radionuclides and rare earth elements concentration of the rocks of Abu Khuruq Ring complex, Egypt. Symmetry 11(8): 1041.
- El-mageed AIA, El-kamel AH, Abbady A, Harb S, Youssef AMM and Saleh II 2011 Assessment of Natural and Anthropogenic Radioactivity levels in Rocks and Soils in the Environments of Juban town in Yemen. Radiat. Phys. Chem. 80(6): 710–715.
- El Samad O, Baydoun R, Nsouli B and Darwish T 2013 Determination of Natural and Artificial Radioactivity in Soil at North Lebanon Province. J Environ Radioact 125:36-
- Fischer TP, Burnard P, Marty B and Hilton DR 2009 Upper-mantle volatile chemistry at Oldoinyo Lengai volcano and the origin of carbonatites. Nature 459(7243): 77–80.
- Gupta M 2019 Analysis of the Representation of Orbital Errors and Improvement of their Modelling Mini Gupta. September 2018.
- Harb S, Abbady AEB, El-Kamel AEH, Saleh II and Abd El-Mageed AI 2012 Natural Radioactivity and their Radiological Effects for Different types of Rocks from Egypt. Radiat. Phys. Chem. 81(3): 221-225.
- Haulle E 2014 Assessment of Communities` Coping Mechanisms to Geodisaster Risks in the Vicinity of Oldoinyo Lengai in Northern Tanzania. Ph.D Thesis, University of Dar es Salaam.
- Haulle E and Njewele D 2017. Fertility Myth of Oldoinyo Lengai and Its Impacts To the Maasai Community of Northern Tanzania. Journal of the Geographical Association of Tanzania 36(2): 21–34.
- Hossain I, Sharip N and Viswanathan KK 2012 Efficiency and Resolution of HPGe and NaI (Tl) Detectors Gamma-ray Spectroscopy. Sci. Res. Essays. 7(1): 86-89.
- Hulett SRW, Simonetti A, Rasbury ET and Hemming NG 2016. Recycling of subducted crustal components into carbonatite melts revealed by boron isotopes. Nat Geosci. 9:904–908.
- Hyun J, Piot P and Sen T 2018 Optics and bremsstrahlung estimates for channeling radiation experiments at FAST. arXiv preprint arXiv:1802.06113.
- ICRP 2008 Radiation Dose to Patients from Radiopharmaceuticals. Addendum 3 to ICRP Publication 53. ICRP Publication 106. Ann. ICRP 38 pp1e2.
- Isinkaye MO and Agbi JI 2013 Natural radioactivity and associated radiation hazards of some commonly used building materials in southwest Nigeria. Radioprotection 48: 355e365.
- Isinkaye MO and Emelue HU 2015 Natural Radioactivity Measurements and Evaluation of Radiological Hazards in Sediment of Oguta Lake, South East Nigeria. Radiat. Res. Appl. 8(3): 459–469.
- Kadhim NF 2016 Measurement the radioactivity of some local and imported oil products and for AL-Dora Refinery using gamma spectroscopy. Ph.D Thesis, Al – Mustansiriyah University.
- Jibiri NN and Okeyode IC 2012 Evaluation of Radiological Hazards in the Sediments of Oguta River, South-Western Nigeria. Radiat. Phys. Chem. 81(2): 103–112.
- Jing L, Lei Z, Zhang G, Pilon AC, Huhman DV, Xie R, Xi W, Zhou Z and Sumner LW 2015 Metabolite Profiles of Essential Oils in Citrus Peels and their Taxonomic Implications. Metabolomics, 11(4): 952–963.
- Kebwaro JM, Rathore IVS, Hashim NO and Mustapha AO 2011 Radiometric Assessment of Natural Radioactivity levels around Mrima Hill, Kenya. Int. J. Phys. Sci, 6(13): 3105–3110.
- Kerur BR, Rajeshwari T, Kumar SA, Narayani K, Rekha AK and Hanumaiah B 2010 Radioactivity levels in rocks of North Karnataka, India.
- Kervyn M, Ernst GGJ, Klaudius J, Keller J, Mbede E and Jacobs P 2008 Remote sensing study of sector collapses and debris avalanche deposits at Oldoinyo Lengai and Kerimasi volcanoes, Tanzania. Int. J. Remote Sens 29(22): 6565–6595.
- Kimaro EE and Mohammed NK 2015 Natural Radioactivity Levels in the Area around the Uranium Deposit of the Bahi District in Dodoma Region, Tanzania. res. j. pure appl: 1-10.
- Khandaker MU 2011 High Purity Germanium Detector in Gamma-ray Spectrometry: High-Purity Germanium Detector. J. Fundam. Phys. 1(2): 42-46.
- Kljajevi L, Vukanac I, Poznanovi M, Mihajlovi A and Pavlovi V 2012 Science of the Total Environment Vertical distribution of natural radionuclides in soil : Assessment of external exposure of population in cultivated and undisturbed areas. 429: 309–316.
- Knoll GF Radiation Detection and Measurement (4th). University of Michigan Press.
- Kohse G 2014 High Resolution Gamma Ray Spectroscopy. Lab Guide 2: 1–13.
- L’Annunziata MF 2020 The atomic nucleus, nuclear radiation and the interaction of radiation with matter: In Handbook of Radioactivity Analysis pp. 1-243. Academic Press.
- Le Maître RW 2002 Igneous rocks: a classification and glossary of terms Cambridge University Press, Cambridge (UK).
- Lengai O, Amour KO and Mohammed NK 2015 Heavy Metal Concentrations in Soil and Green Vegetables (Vigna unguiculata) around Volcanic. 8(3): 178–185.
- Lu X and Zhang X 2008 Natural radioactivity Measurements in Rock Samples of Cuihua National Geological Park, China. Radiat. Prot. Dosim. 128(1): 77–82.
- Mahuvava C 2015 Monte Carlo evaluation of the dose perturbation effect of various hip during pelvic megavoltage photon radiotherapy. PhD Thesis. University of the Free State.
- Makundi IN, Nyaki MM and Mohammed NK 2018 Assessment of radioactivity levels in coal and coal ash in Kiwira coal mine using gamma-ray spectrometry. Tanz. J. Sci 44(3):1-11.
- Mehra R, Sonkawade RG, Badhan K and Singh S 2009 Measurement of Natural Radioactivity in Brick Samples Using Gamma-Ray Spectrometry. Asian J. 21(10): 11–13.
- Michael P 2010 Radiation protection and dosimetry: An introduction to health physics, Radiat Prot Dosimetry 138: 407–409.
- Mitchell RH 2005 Carbonatites and carbonatites and carbonatites. Can. Mineral 43(6): 2049 –2068.
- Natron L, Ash S and Draft N 2007. Mitigating Positive Impacts. May.
- Oldham M 2014 Radiation Physics and Applications in Therapeutic Medicine. Educ. 36(6): 460 – 467.
- Otwoma D 2012 An investigation of the radioecology of the carbonatite deposits in the Homa mountain region in south Nyanza, Kenya. Ph.D. thesis, University of Nairobi.
- Otwoma D, Patel JP and Bartilol S 2012 Radioactivity and Dose Assessment of Rock and Soil Samples from Homa Mountain, Homa Bay County, Kenya. XI Radiation Physics & Protection Conference, 1(November): 33–42.
- Otwoma D, Patel JP, Bartilol S and Mustapha AO 2013 Estimation of annual effective dose and radiation hazards due to natural radionuclides in Mount Homa, southwestern Kenya. Radiat Prot Dosim 155(4), 497–504.
- Qureshi AA, Tariq SA Manzoor S and Waheed A 2014 Evaluation of excessive lifetime cancer risk due to natural radioactivity in the rivers sedimentsof Northern Pakistan. J App Sci 7(4): 438e447.
- Radenkovic M, Masaud A, Andric V and Miljanic S 2009 Radioactivity of sand from several renowned public beaches and assessment of the corresponding environmental risks. J. Seb. Chem 74(4): 461–470.
- Ragheb M 2011 Gamma Rays Interactions with Matter. Nuclear, Plasma and Radiation Science. Inventing the Future.
- René M 2017 Nature, Sources, Resources, and Production of Thorium. Descriptive Inorganic Chemistry Researches of Metal Compounds.
- Ridha A 2013 Determination of Radionuclides Concentrations in Construction Materials Used in Iraq. Ph.D. Thesis. AL-Mustansiriyah University.
- Ridikas D, Barzakh A, Blideanu V, David J, Doré D and Prévost A 2008 Measurements of Delayed Neutrons yields and Time Spectra from 1 GeV Protons interacting with Thick nat Pb,209 Bi and nat Fe Targets. Science And Technology, May 2014.
- Pires LF, Cássaro FAM, Pereira LAA and Oliveira JATD 2020 Gamma ray attenuation for soil density : laboratory experiments for Environmental Physics and Engineering courses. 42.
- Podgoršak EB 2014 Modes of Radioactive Decay: Compendium to Radiation Physics for Physicists, 693–786.
- Popic JM, Salbu B, Strand T and Skipperud L 2011 Assessment of radionuclide and metal contamination in a thorium rich area in Norway. J Monit. Assess 13(6): 1730-1738.
- Potter NJ, Kamenetsky VS, Simonetti A and Goemann K 2017 Different types of liquid immiscibility in carbonatite magmas: A case study of the Oldoinyo Lengai 1993 lava and melt inclusions. Geol 455: 376-384.
- Simandl GJ 2014 Geology and market-dependent significance of rare earth element resources. Mineral Depos 49(8): 889–904.
- Simandl GJ and Paradis S 2018 Carbonatites: related ore deposits, resources, footprint, and exploration methods. Earth Science 127: 1–30.
- Sharma R and Bhandari R 2015 Skewness, Kurtosis and Newton’s inequality. Rocky Mt J Math. 45(5): 1639-1643.
- Sherrod DR, Magigita MM and Kwelwa S 2013 Geologic map of Oldoinyo Lengai (Oldoinyo Lengai) and surroundings, Arusha Region, United Republic of Tanzania, S. Geol. Surv. Rep. 2013‐1306, 65 pp.
- Shultis JK and Faw RE 2016 Fundamentals of nuclear science and engineering. CRC Press.
- Shetty PK and Narayana Y 2010 Variation of radiation level and radionuclides enrichment in high background area. J. Environ Radioact 101: 1043e1047.
- Spycher BD, Lupatsch JE, Zwahlen M, Röösli M, Niggli F and Grotzer MA 2015 National Cohort Study Group. Background ionizing radiation and the risk of childhood cancer: a census-based nationwide cohort study. Environ. Health Perspect 123(6): 622-628.
- Stoppa F and Adrian 2009 Nyerereite from carbonatite rocks at Vulture volcano: implications for mantle metasomatism and petrogenesis of alkali carbonate melts. Central European Geo. 1 (2): 131–151.
- Sundal AV and Strand T 2004 Indoor Gamma Radiation and Radon Concentrations in a Norwegian Carbonatite area. J. Environ. Radioact 77(2): 175–189.
- SureshGandhi M, Ravisankar R, Rajalakshmi A, Sivakumar S, Chandrasekaran A and Pream D 2014 Measurements of Natural Gamma Radiation in Beach Sediments of North East Coast of Tamilnadu, India by Gamma-ray Spectrometry with Multivariate Statistical Approach. Radiat. Res. Appl. 7(1): 7–17.
- Tanaskovi I, Golobocanin D and Miljevi N 2012 Multivariate Statistical Analysis of Hydrochemical and Radiological Data of Serbian spa waters. 112(14): 226–234.
- Tsoulfanidis N 2010 Measurements and Detection of Radiation (3rd). CRC Press.
- Uosif MAM, Issa SAM and El-Salam LMA 2015 Measurement of natural radioactivity in granite sand its quartz-bearing gold at El-Fawakhir area (Central Eastern Desert), Egypt. J Radiat Res Appl Sci 8:1–6.
- UNSCEAR 2010 Sources and effects of ionizing radiation: United Nations Scientific Committee on the Effects of Atomic Radiation I, pp. 156.
- UNSCEAR 2000 SOURCES AND EFFECTS United Nations Scientific Committee on the Effects: Vol. I.
- Vukašinović I, Todorović D, Životić L, Kaluđerović L and Đorđević A 2018 An analysis of naturally occurring radionuclides and 137 Cs in the soils of urban areas using gamma-ray spectrometry. J. Environ. Sci. Technol. 15(5):1049-1060.
- Woolley AR and Kjarsgaard BA 2008 Carbonatite occurrences of the world: Map and database: Geological Survey of Canada, Open File Report 5796.
- Wymer D 2005 Application of international safety standards to work involving exposure to natural radiation. Naturally Occurring Radioactive Materials, NORM IV, p.419.
- Zubair M 2015 Measurement of Natural Radioactivity in Rock Samples Using Gamma ray Spectrometry. Radiation Protection and Environment. 38(1): 11.