
Optimization of Electric Power Distribution in Ilorin Metropolis
- T.O. Aliu
- S.F. Issa
- K. Issa
- Y.T. Owolabi
- 474-485
- Jun 21, 2024
- Mathematics
Optimization of Electric Power Distribution in Ilorin Metropolis
T.O. Aliu, S.F. Issa, K. Issa, and Y.T. Owolabi
Department of Mathematics and Statistics, Kwara State University, Malete, Kwara State, Nigeria
DOI: https://doi.org/10.51584/IJRIAS.2024.905042
Received: 02 May 2024; Accepted: 21 May 2024; Published: 21 June 2024
ABSTRACT
Electricity supply to the people in Ilorin has been faced with a lot of inadequacies and often met with several complains by the consumers (IBEDC 2016). This research optimized the efficiency level of Ibadan Electricity Distribution Company (IBEDC) in Ilorin using Linear Programming approach. Newton Gregory Interpolation Method was used to develop an efficiency distribution model. MATLAB and MAPLE were used for numerical computation of results. The findings reveled that IBEDC in Ilorin, has not been functioning to the best of their capacity. The study was able to predict future efficiency levels for the next five years (2022-2026) in the following order 72.16%, 75.84%, 80.22%, 93.43% and 93.43%. Based on this work, it is recommended that IBEDC in Ilorin need to ensure effective distribution of energy received from the Generating Companies (GENCOS), devoid of unnecessary lost. Government and policy makers are also advised to engage in an effective, verifiable and accountable investment towards ensuring allocated resources geared towards boosting power generation are judiciously used for targeted purposes to ensure and measure the growth in the power sector with time.
Keywords: Electricity, Linear Programming, Power Distribution, Optimization.
I. INTRODUCTION
The significance of electricity or steady power supply in any modern society today cannot be over emphasized because it is the most versatile form of energy which plays a very important role in the social and economic prosperity (Adekoya and Jeremiah 2019, Addeh 2021). Nwokoye et al (2017) Submitted that electricity is one of the most important blessings that science has given to mankind. It is important to our civilization, security, job creation and other aspects like health care systems (Simon 2021). It is often converted easily to numerous forms of energy for example lighting, heating, cooling, refrigeration and for operating appliances, computers, electronics, machinery, and other public transportation systems (Bhalla et al 2003). Olatunji et al (2018) observed that electricity is normally generated from conventional energy sources like fossil fuels (natural gas, coal), water power (hydro and pumped storage), biotic, fission etc., or non-conventional (renewable) energy sources like solar, wind, water power (tidal and waves), biofuels (biomass and biogas), geothermal, ocean thermal, or combination of both sources.
In Nigeria, a better part of her electricity is generated largely from natural or primary conventional energy sources like fossil fuels (gas), hydro power, which is unfortunately, grossly inadequate (Adenikinju 2005). Presently, the total electricity output in Nigeria is below 5,000MW despite having the capacity to generate up to 12,000MW which is insufficient for a rustic of over 195 million people that require about 40,000MW or more to sustain the essential needs of the population (Tena 2021). The electricity sector in Nigeria, as the biggest economy in Africa generates, transmits and distribute megawatts of electrical power that is significantly less than what is needed to meet basic household and industrial needs (Oladipo 2018). South Africa, the second largest economy with a 60 million population is generating 58,000 Megawatts. Egypt, the third largest economy with a 100 million population is generating 55,000 Megawatts (USAID 2021). The amount of electrical power generated usually fall as low as 1,750MW as a result of electricity theft from unauthorized connections, power loss in transmission, vandalism of kit, lack of proper maintenance of transformer, poor management and corruption among others are some of the reasons for sub-optimal production of electricity in Nigeria (Okpare and Okreghe 2020)
II. POWER DISTRIBUTION IN KWARA STATE
Kwara is a state in the Middle Belt region of the Federal Republic of Nigeria, bordered to the east by Kogi State, to the north by Niger State, and to the south by Ekiti, Osun and Oyo States, while its western border makes up part of the international border with Benin Republic (IBEDC 2016). Kwara has three Senatorial District, Kwara North, South and Kwara Central. Ilorin, the state capital of Kwara State has 20 political wards which comprise three Local Government Areas, Ilorin East, Ilorin West and Ilorin South with a total population of about 1 million people (IBEDC 2016). The Kwara region of Ibadan Electricity Distribution Company (IBEDC) comprising Challenge district, Omu- Aran, Jebba, Baboko, parts of Ekiti, parts of Kogi, parts of Oshogbo and Niger with total distribution output not more than 131.4 megawatts, is said to require at least 270 megawatts of electricity to ensure 24 hours power supply in Ilorin, the Kwara State capital, and its environs, according to (IBEDC 2016). The company had struggled over the years to deliver efficient electricity supply to both individual and industrial customers known as Maximum Demand customers (MDs) and Non-Maximum Demand customers (Non-MDs) in the city but due to certain constraints the electricity distribution has not been able to meet the efficient demand of the entire population in Ilorin metropolis (Tena 2021) Poor power supply situation in Ilorin could easily be blamed on: Inadequate generation of power supply to the state, power loss, energy theft, household energy consumption pattern and occasional system failures (Ejor 2021). According to Vanguard News published on the 18th March 2019, thirty communities in Ilorin, Kwara State capital on one Monday morning staged a peaceful protest over total blackout being experienced in the affected communities over the last six months. They said the last time they were supplied power by IBEDC, in the affected communities was on November 20, 2018. The affected communities are Alore, Oloje, Ita-Merin, Banni, Abayawo, Gunniyan, Anifowose, Pakata, Alfa-Yahaya, Oke-Agodi, Agbarigidoma, Gaa Oke-Idi emi, Ogidi, Temidire, Others are Abemi, Adeta, Aiyekale, Ifesowapo, Sakele, Olomoda, Albarika, Iberuoluwa, Ajegunle, Gaa-Osibi, Ifedayo,among others (IBEDC 2016).
III. MATERIALS AND METHODS
3.1 Data Description
This study utilized data set collected from IBEDC Unit of Ilorin Metropolis, Kwara State Nigeria. The data contained a record of the total amount of energy received and energy billed on a monthly basis from January 2015 to December 2021. It also included the billing details of various districts in Ilorin Metropolis. MATLAB and MAPLE were used for numerical computation of results.
3.2. Research Methodology
3.2.1. Linear Programming Method
The general linear programming problem is of the form:
Optimize \(Z = c_1x_1 + c_2x_2 + c_3x_3 + \cdots + c_nx_n\) (Objective function)
Subject to:
\(a_{11}x_1 + a_{12}x_2 + a_{13}x_3 + \cdots + a_{1n}x_n \leq b_1\)
\(a_{21}x_1 + a_{22}x_2 + a_{23}x_3 + \cdots + a_{2n}x_n \leq b_2\)
\(a_{31}x_1 + a_{32}x_2 + a_{33}x_3 + \cdots + a_{3n}x_n \leq b_3\)
\(\vdots\)
\(a_{m1}x_1 + a_{m2}x_2 + a_{m3}x_3 + \cdots + a_{mn}x_n \leq b_m\) \((3.1)\)
Where \(x_1, x_2, x_3, \ldots, x_n \geq 0\)
and \(\leq\) means \(\leq\), \(\geq\), or = sign.
Note: In this research work, we denote all the parameters in the general formula as follows:
\(c_i\) = Energy billed for the years under review
\(x_i\) = Efficiency in power distributed for the years under review
\(a_{ij}\) = Energy billed for the months in the years under review
\(b_{ij}\) = Energy received for the month in the years under review
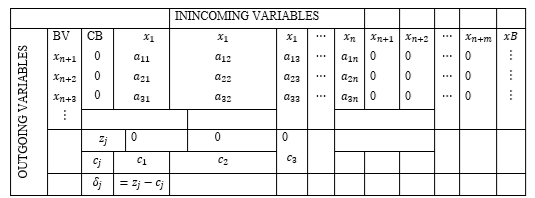
Table 3.1: General Simplex Table. Source [6]
3.2.2. Newton Gregory Forward Difference Interpolation Method
Suppose the function \(y = f(x)\) is known at \((n + 1)\) equispaced points \(x, x_1, \ldots, x_n\) and they are \(y_0, y_1, \ldots, y_n\) respectively, i.e., \(y_i = f(x_i), i = 0, 1, \ldots, n\). Let \(x_i = x_0 + ih\) and \(u = \frac{x – x_1}{h}\) where \(h\) is the step length. The Newton Gregory Forward Interpolation formula is:
\[
y = f(x) = y_0 + u\Delta y_0 + \frac{u(u-1)}{2!}\Delta^2 y_0 + \cdots + \frac{u(u-1)\cdots(u-n+1)}{n!}\Delta^n y_0
\] \((3.2)\)
Newton Gregory Backward Difference Interpolation Method
This formula is useful when the value of \(f(x)\) is required near the end of the table. \(h\) is called the step length of the difference and: u=((x-an))/h,
\[
f(a + nh – uh) = f(a + nh) + u\nabla f(a + nh) + \frac{u(u+1)}{2!}\Delta^2 f(a + nh) + \cdots + \frac{u(u+1)\cdots(u+n-1)}{n!}\Delta^n f(a + nh)
\] \((3.3)\)
Difference Table
Suppose we have a set of values of an unknown function \( y_1, y_2, y_3, \ldots, y_n \) corresponding to a set of values of the (known) independent variable \( x_1, x_2, x_3, \ldots, x_n \) where \( x_1 < x_2 < x_3 < \cdots < x_n \). To obtain the value of \( y \) corresponding to any \( x \) (where \( x_1 < x_2 < x_3 < \cdots < x_n \)), we use the values of the \( n + 1 \) data entries. Hence \( y_{r+1} – y_r \) is called the first difference of \( y_r \) denoted by \( \Delta y_r \): \( \Delta y_r = y_{r+1} – y_r \).
Similarly, \(\Delta y_{r+1} – \Delta y_r\) is the second difference: \(\Delta^2 y_r = y_{r+1} – \Delta y_r\).
For example, \(\Delta^2 y_0 = \Delta y_1 – \Delta y_0 = (y_2 – y_1) – (y_1 – y_0) = y_2 – 2y_1 + y_0\).
Similarly, \(\Delta^2 y_1 = \Delta y_2 – \Delta y_1 = (y_3 – y_2) – (y_2 – y_1) = y_3 – 2y_2 + y_1\).
In general terms, \(\Delta^2 y_r = y_{r+2} – 2y_{r+1} + y_r\) for \(r = 0, 1, 2, \ldots, n-2\).
The third difference: \(\Delta^3 y_r = y_{r+3} – 3y_{r+2} + 3y_{r+1} – y_r\). r=0,1,2,⋯n-3
Clearly successive differences can be calculated and put into a table as shown below:
| x | y | \(\Delta y\) | \(\Delta^2 y\) | \(\Delta^3 y\) | \(\Delta^4 y\) | \(\Delta^5 y\) |
|---|---|---|---|---|---|---|
| \(x_0\) | \(y_0\) | \(\Delta y_0\) | \(\Delta^4 y_0\) | |||
| \(x_1 = x_0 + h\) | \(y_1\) | \(\Delta y_1\) | \(\Delta^2 y_0\) | \(\Delta^5 y_0\) | ||
| \(x_2 = x_0 + 2h\) | \(y_2\) | \(\Delta y_2\) | \(\Delta^3 y_2\) | |||
| \(x_3 = x_0 + 3h\) | \(y_3\) | \(\Delta y_3\) | \(\Delta^2 y_3\) | |||
| \(x_4 = x_0 + 4h\) | \(y_4\) | \(\Delta y_4\) | ||||
| \(x_5 = x_0 + 5h\) | \(y_5\) |
Table 3.2: General Forward Difference Table. Source [5].
IV. RESULTS AND DISCUSSIONS
From the raw data collected from IBEDC unit Ilorin for the years under review, it was observed that the amount of energy that is being distributed on a monthly basis is usually lesser than the amount of total energy received.
Total Energy Received: 1548.2266
Total Energy Billed: 1179.32025
The efficiency in Power distribution was calculated using the formula:
\[
ED = \left(\frac{EB}{ER}\right) \times 100
\]
Where:
- \(ED\) is efficiency of distribution
- \(EB\) is energy billed
- \(ER\) is energy received
MATLAB was employed for the optimization process, with MAPLE used for estimation of the forward and backward difference interpolations.
| YEAR/MONTH | JAN | FEB | MAR | APR | MAY | JUN | JUL | AUG | SEPT | OCT | NOV | DEC |
| 2015 | 78.8524 | 94.4132 | 94.9621 | 91.8377 | 90.5824 | 90.5824 | 75.6261 | 88.2795 | 91.9991 | 95.2961 | 92.5816 | 97.0761 |
| 2016 | 86.7526 | 80.7016 | 86.2481 | 89.8776 | 93.0758 | 91.3563 | 95.0034 | 95.2729 | 90.8887 | 88.9236 | 94.9526 | 9.5178 |
| 2017 | 74.39.54 | 93.4343 | 76.4639 | 74.8706 | 83.5264 | 56.8754 | 68.9415 | 76.9450 | 80.8125 | 67.6389 | 60.9375 | 60.1642 |
| 2018 | 89.9393 | 82.6591 | 67.9224 | 66.6525 | 66.0791 | 60.0984 | 81.2168 | 75.5864 | 53.2352 | 49.9026 | 81.2168 | 63.9991 |
| 2019 | 81.0861 | 80.8813 | 80.9789 | 80.9789 | 81.6104 | 81.0038 | 81.2267 | 80.7794 | 80.7271 | 80.5303 | 82.1650 | 81.0166 |
| 2020 | 81.4281 | 81.4563 | 79.6617 | 79.6616 | 48.4061 | 49.6413 | 56.1269 | 54.9873 | 55.5556 | 58.7715 | 66.5865 | 64.6139 |
| 2021 | 64.9146 | 66.1039 | 76.4639 | 76.4639 | 75.2445 | 62.8382 | 65.2909 | 56.9676 | 57.3422 | 68.2770 | 57.5157 | 60.3609 |
Table 4.1: Efficiency in Power Distribution Table
| AVERAGE EFFICIENCY (%) | |
| 2015 | 90.17 |
| 2016 | 90.31 |
| 2017 | 72.92 |
| 2018 | 69.88 |
| 2019 | 81.08 |
| 2020 | 64.74 |
| 2021 | 65.65 |
Table 4.2: Average Efficiency in Power distribution in Ilorin
| YEAR/MONTH | JAN | FEB | MAR | APR | MAY | JUN | JUL | AUG | SEPT | OCT | NOV | DEC |
| 2015 | 3.4816 | 1.01824 | 0.84298 | 1.33433 | 2.19597 | 1.64236 | 4.33529 | 2.18884 | 1.37004 | 0.87229 | 1.27029 | 0.50461 |
| 2016 | 2.36597 | 3.46597 | 2.73325 | 1.91249 | 1.29106 | 1.70433 | 0.9804 | 0.85659 | 1.59458 | 2.03713 | 1.00861 | 1.78051 |
| 2017 | 4.63972 | 1.1309 | 3.5874 | 4.60063 | 3.19191 | 7.89515 | 4.84254 | 3.59466 | 3.80204 | 6.1298 | 8.37132 | 8.27276 |
| 2018 | 1.99355 | 3.36786 | 5.31543 | 6.2512 | 6.14668 | 8.08544 | 3.73325 | 4.21081 | 8.11814 | 9.39106 | 3.73325 | 6.74859 |
| 2019 | 3.5816 | 3.50024 | 3.37298 | 3.40433 | 3.26587 | 3.47046 | 3.46249 | 3.68484 | 3.7614 | 3.30529 | 3..17849 | 3.76161 |
| 2020 | 3.03524 | 3.64314 | 4.12124 | 9.2526 | 9.849966 | 9.78040 | 8.11465 | 8.15659 | 8.0000 | 6.23717 | 6.00861 | 6.57051 |
| 2021 | 7.28624 | 6.56769 | 3.5874 | 4.60063 | 4.29742 | 6.15792 | 4.85287 | 8.50192 | 8.19647 | 5.48087 | 9.22908 | 8.57606 |
Table 4.3: Unused Electricity Power in Ilorin
| AVERAGE UNUSED POWER (%) | |
| 2015 | 1.76 |
| 2016 | 1.81 |
| 2017 | 5.01 |
| 2018 | 5.60 |
| 2019 | 3.48 |
| 2020 | 6.91 |
| 2021 | 6.44 |
Table 4.4: Average Unused Power in Ilorin
From table 4.1 and table 4.3 the Linear Programming Problem is formulated as follows:
Maximize \( Z = 188.9259x_1 + 203.5588x_2 + 159.7029x_3 + 157.7134x_4 + 180.4172x_5 + 143.0604x_6 + 143.6087x_7 \) (4.1)
Subject to:
\( 13.35462x_1 + 15.39392x_2 + 13.48093x_3 + 17.82168x_4 + 15.35462x_5 + 16.18402x_6 + 13.48093x_7 \leq 132.3108 \) (4.2)
\( 17.20766x_1 + 4.49392x_2 + 16.14219x_3 + 16.05362x_4 + 14.80766x_5 + 16.00306x_6 + 12.80824x_7 \leq 130.2146 \) (4.3)
\( 15.88982x_1 + 17.14219x_2 + 11.65469x_3 + 11.25512x_4 + 14.3535982x_5 + 16.14219x_6 + 11.65469x_7 \leq 121.6592 \) (4.4)
\( 15.01319x_1 + 16.98123x_2 + 13.70715x_3 + 12.49441x_4 + 16.01319x_5 + 12.17799x_6 + 13.70715x_7 \leq 131.4505 \) (4.5)
\( 15.49392x_1 + 17.35455x_2 + 16.1818402x_3 + 11.97397x_4 + 14.49392x_5 + 9.241354x_6 + 13.06217x_7 \leq 128.0428 \) (4.6)
\( 15.79683x_1 + 18.01319x_2 + 10.41263x_3 + 12.17799x_4 + 14.79873x_5 + 9.641097x_6 + 10.41263x_7 \leq 129.9891 \) (4.7)
\( 15.45123x_1 + 18.64108x_2 + 10.74914x_3 + 16.14219x_4 + 14.98123x_5 + 10.38106x_6 + 9.128671x_7 \leq 123.8748 \) (4.8)
\( 16.48648x_1 + 17.2640x_2 + 11.99702x_3 + 13.05927x_4 + 15.48648x_5 + 9.96405x_6 + 11.25512x_7 \leq 126.7139 \) (4.9)
\( 15.75350x_1 + 15.84914x_2 + 16.01319x_3 + 19.2413x_4 + 15.75350x_5 + 10.74914x_6 + 10.74914x_7 \leq 128.0021 \) (4.10)
\( 17.67128x_1 + 16.35465x_2 + 12.80824x_3 + 9.354546x_4 + 13.67128x_5 + 9.354546x_6 + 11.79641x_7 \leq 124.4626 \) (4.11)
\( 15.83190x_1 + 18.97397x_2 + 13.05927x_3 + 16.14219x_4 + 14.64319x_5 + 11.97397x_6 + 12.49441x_7 \leq 135.9398 \) (4.12)
\( 16.75322x_1 + 16.99702x_2 + 12.49441x_3 + 11.99702x_4 + 16.05362x_5 + 11.99702x_6 + 13.05927x_7 \leq 135.5662 \) (4.13)
Where \( x_1, x_2, x_3, x_4, x_5, x_6, x_7 \geq 0 \). \( x_i \), \( i=1,2,…,7 \) denote the efficiency level of electricity distribution by the IBEDC Ilorin.
Adding the slack variables we have:
Maximize \( Z = 188.9259x_1 + 203.5588x_2 + 159.70291x_3 + 157.713x_4 + 180.4172x_5 + 143.0604x_6 + 143.6087x_7 \) (4.14)
Subject to:
\( 13.35462x_1 + 15.3939x_2 + 13.48093x_3 + 17.82168x_4 + 15.35462x_5 + 16.18402x_6 + 13.48093x_7 + x_8 = 132.3108 \) (4.15)
\( 17.20766x_1 + 4.49392x_2 + 16.14219x_3 + 16.05362x_4 + 14.80766x_5 + 16.00306x_6 + 12.80824x_7 + x_9 = 130.2146 \) (4.16)
\( 15.88982x_1 + 17.14219x_2 + 11.65469x_3 + 11.25512x_4 + 14.3535982x_5 + 16.14219x_6 + 11.65469x_7 + x_{10} = 121.6592 \) (4.17)
\( 15.01319x_1 + 16.98123x_2 + 13.70715x_3 + 12.49441x_4 + 16.01319x_5 + 12.17799x_6 + 13.70715x_7 + x_{11} = 131.4505 \) (4.18)
\( 15.49392x_1 + 17.35455x_2 + 16.1818402x_3 + 11.97397x_4 + 14.49392x_5 + 13.062x_6 + 13.062x_7 + x_{12} = 128.0428 \) (4.19)
\( 15.79683x_1 + 18.01319x_2 + 10.41263x_3 + 12.17799x_4 + 14.79873x_5 + 9.641097x_6 + 10.41263x_7 + x_{13} = 129.9891 \) (4.20)
\( 15.45123x_1 + 18.64108x_2 + 10.74914x_3 + 16.14219x_4 + 14.98123x_5 + 10.38106x_6 + 9.128671x_7 + x_{14} = 123.8748 \) (4.21)
\( 16.48648x
_1 + 17.264x_2 + 11.99702x_3 + 13.05927x_4 + 15.48648x_5 + 9.96405x_6 + 11.25512x_7 + x_{15} = 126.7139 \) (4.22)
\( 15.75350x_1 + 15.84914x_2 + 16.01319x_3 + 19.2413x_4 + 15.75350x_5 + 10.74914x_6 + 10.74914x_7 + x_{16} = 128.0021 \) (4.23)
\( 17.67128x_1 + 16.35465x_2 + 12.80824x_3 + 9.354546x_4 + 13.67128x_5 + 9.354546x_6 + 11.79641x_7 + x_{17} = 124.4626 \) (4.24)
\( 15.83190x_1 + 18.97397x_2 + 13.05927x_3 + 16.14219x_4 + 14.64319x_5 + 11.97397x_6 + 12.49441x_7 + x_{18} = 135.9398 \) (4.25)
\( 16.75322x_1 + 16.99702x_2 + 12.49441x_3 + 11.99702x_4 + 16.05362x_5 + 11.99702x_6 + 13.05927x_7 + x_{19} = 135.5662 \) (4.26)
Where \( x_1, x_2, x_3, x_4, x_5, x_6, x_7, x_8, x_9, x_{10}, x_{11}, x_{12}, x_{13}, x_{14}, x_{15}, x_{16}, x_{17}, x_{18}, x_{19} \geq 0 \).
The Objective function (Z) was derived from the sum of energy billed for the years under review while the unknown variable (Xi) stands for the efficiency of the distribution. We have 12 unique constraints, which simply cover all months in a year for all the years under review. The constraints were formulated from energy billed and energy received for the months in the years under review.
| BV | CB | \(x_1\) | \(x_2\) | \(x_3\) | \(x_4\) | \(x_5\) | \(x_6\) | \(x_7\) | \(x_8\) | \(x_9\) | \(x_{10}\) | \(x_{11}\) | \(x_{12}\) | \(x_{13}\) | \(x_{14}\) | \(x_{15}\) | \(x_{16}\) | \(x_{17}\) | \(x_{18}\) | \(x_{19}\) | XB | Ratio |
|---|---|---|---|---|---|---|---|---|---|---|---|---|---|---|---|---|---|---|---|---|---|---|
| \(x_8\) | 0 | 13.5462 | 15.49392 | 13.48093 | 17.82168 | 15.35462 | 16.18402 | 13.48093 | 1 | 0 | 0 | 0 | 0 | 0 | 0 | 0 | 0 | 0 | 0 | 0 | 132.3108 | 8.5395 |
| \(x_9\) | 0 | 17.20766 | 4.49392 | 16.14219 | 16.05362 | 14.80766 | 16.00306 | 12.80824 | 0 | 1 | 0 | 0 | 0 | 0 | 0 | 0 | 0 | 0 | 0 | 0 | 130.2146 | 28.9757 |
| \(x_{10}\) | 0 | 15.88982 | 17.14219 | 11.65469 | 11.25512 | 14.35982 | 16.14219 | 11.65469 | 0 | 0 | 1 | 0 | 0 | 0 | 0 | 0 | 0 | 0 | 0 | 0 | 121.2146 | 7.0971 |
| \(x_{11}\) | 0 | 15.01319 | 16.98123 | 13.70715 | 12.49441 | 16.01319 | 12.17799 | 13.70515 | 0 | 0 | 0 | 1 | 0 | 0 | 0 | 0 | 0 | 0 | 0 | 0 | 131.4505 | 7.7407 |
| \(x_{12}\) | 0 | 15.49392 | 17.35455 | 16.18402 | 11.97397 | 14.49392 | 9.241354 | 13.06207 | 0 | 0 | 0 | 0 | 1 | 0 | 0 | 0 | 0 | 0 | 0 | 0 | 128.0428 | 7.3781 |
| \(x_{13}\) | 0 | 15.79683 | 18.01319 | 10.41263 | 12.17799 | 14.79873 | 9.641079 | 10.41263 | 0 | 0 | 0 | 0 | 0 | 1 | 0 | 0 | 0 | 0 | 0 | 0 | 129.9891 | 7.216 |
| \(x_{14}\) | 0 | 13.45123 | 18.64108 | 10.74914 | 16.14219 | 14.98123 | 10.38106 | 9.128671 | 0 | 0 | 0 | 0 | 0 | 0 | 1 | 0 | 0 | 0 | 0 | 0 | 123.8748 | 6.6453 |
| \(x_{15}\) | 0 | 16.48648 | 17.26406 | 11.99702 | 13.05127 | 15.48648 | 9.964057 | &11.25512 | 0 | 0 | 0 | 0 | 0 | 0 | 0 | 1 | 0 | 0 | 0 | 0 | 126.7139 | 7.3398 |
| \(x_{16}\) | 0 | 15.7535 | 15.84914 | 16.01319 | 19.241354 | 15.7535 | 10.00000 | 10.74914 | 0 | 0 | 0 | 0 | 0 | 0 | 0 | 0 | 1 | 0 | 0 | 0 | 128.0021 | 8.0763 |
| \(x_{17}\) | 0 | 17.67128 | 16.35465 | 12.80824 | 9.354546 | 13.67128 | 9.354546 | 11.79641 | 0 | 0 | 0 | 0 | 0 | 0 | 0 | 0 | 0 | 1 | 0 | 0 | 124.4626 | 7.6102 |
| \(x_{18}\) | 0 | 15.8319 | 18.97397 | 13.05927 | 16.14219 | 14.64319 | 11.97397 | 12.49441 | 0 | 0 | 0 | 0 | 0 | 0 | 0 | 0 | 0 | 0 | 1 | 0 | 135.9398 | 7.1645 |
| \(x_{19}\) | 0 | 16.75322 | 15.99702 | 12.49441 | 11.99702 | 16.05362 | 11.99702 | 13.05927 | 0 | 0 | 0 | 0 | 0 | 0 | 0 | 0 | 0 | 0 | 0 | 1 | 135.5662 | 7.9759 |
| zj | 0 | 0 | 0 | 0 | 0 | 0 | 0 | 0 | 0 | 0 | 0 | 0 | 0 | 0 | 0 | 0 | 0 | 0 | 0 | |||
| cj | 188.9259 | 203.5588 | 159.7029 | 157.7134 | 180.4172 | 143.0604 | 143.6087 | 0 | 0 | 0 | 0 | 0 | 0 | 0 | 0 | 0 | 0 | 0 | 0 | |||
| δj= (zj-cj ) | -188.9259 | -203.5588 | -159.7029 | -157.7134 | -180.4172 | -143.0604 | -143.6087 | 0 | 0 | 0 | 0 | 0 | 0 | 0 | 0 | 0 | 0 | 0 | ||||
Table 4.5: Simplex Table
Hence, the efficiencies are:
- \(2015(x_1) = 0.298345760955721\)
- \(2016(x_2) = 2.189705298436050\)
- \(2017(x_3) = 0.951006449110309\)
- \(2018(x_4) = 0.019508936363763\)
- \(2019(x_5) = 4.066217803252357\)
- \(2020(x_6) = -0.000000000016371\)
- \(2021(x_7) = 0.831320172948608\)
Therefore,
\[
\text{Max } Z = 1510.05467 \tag{4.27}
\]
The indicated \(x\)-values represent the efficiency levels for the years under review from 2015 to 2021, which shows that IBEDC in Ilorin can perform better than their current outputs. Their performance in 2016 and 2019 have the highest efficiency levels. One of the factors responsible for this was there were significantly lesser amounts of unutilized power in those two years in comparison to the rest of the years in the study. The result, however, indicated a low level of efficiency in the year 2020, due to an exorbitant rate of unutilized power in the year and some other logistics and management problems according to a report by the IBEDC Kwara Region on one of their social media handles on the 21st of September, 2020 (IBEDC, 2020).
We observed that the amount of energy that is being distributed on a monthly basis is usually lesser than the amount of total energy received by the distribution unit. The result shows that the maximum solution obtained (equation 4.27) is higher than the total amount of energy used from the available energy, that is total energy billed for the years under review by the IBEDC unit of Ilorin Metropolis. The difference is about 330.7344 MW, which is enough to take care of at least another three years based on the capacity with which they are functioning presently.
Using the Newton Gregory Backward Difference Interpolation formula, we derived the prediction model from Table 4.2 by expanding the equation using MAPLE. Hence, the prediction model is given as:
\[
y(x) = 0.1915555556x^6 – 5.091333334x^5 + 53.16680555x^4 – 275.248333x^3 + 731.4616389x^2 – 920.3478334x + 481.5100000 \tag{4.29}
\]
Equation (4.29) is the prediction model of power distribution in Ilorin Metropolis.
Using the Newton Backward Difference Interpolation formula, we derived the lost in electrical power model from Table 4.4. Hence, the model is given as:
\[
y(x) = 0.03995833333x^6 – 1.0563750000x^5 + 9.513541666x^4 – 42.03145833x^3 + 95.44650000x^2 – 105.0621667x + 49.59000000 \tag{4.30}
\]
The Efficiency Model Curve of Power Distribution in Ilorin Metropolis
Power Distribution Efficiency
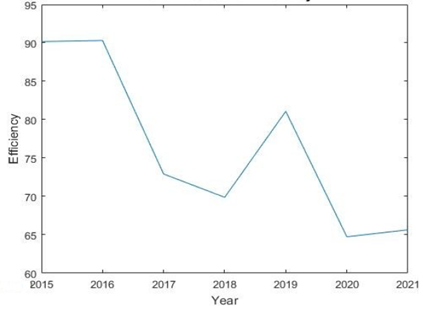
Figure 4.1: The efficiency model of Power Distribution in Ilorin
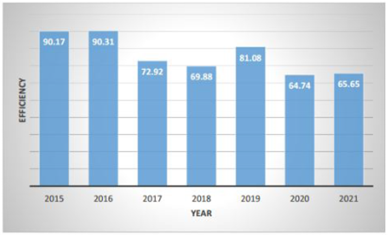
Figure 4.2: The Efficiency Chart of Power Distribution in Ilorin
From the curve in Figure 4.1 and chart in Figure 4.2 it was observed that between 2015 and 2019, the efficiency level was far above average based on the amount of energy received by IBEDC unit in Ilorin Metropolis and was judiciously distributed.
It was also observed that the efficiency level in year 2020 was the lowest due to a very high rate of unutilized power received by the distribution unit. Other factors that also influenced this include poor maintenance system, energy theft and loss in transmission as illustrated in Figure 4.3.
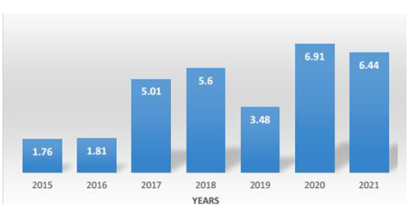
Figure 4.3: Lost in electrical power in Ilorin Metropolis
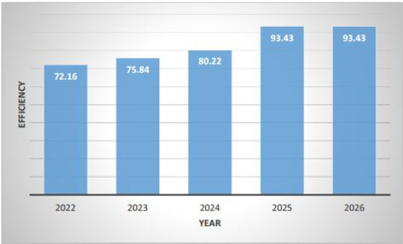
Figure 4.4: Efficiency prediction curve
The efficiency model (equation 4.28) was used to plot the efficiency curve in Figure 4.1 and the efficiency chart, Figure 4.2 and was also used for the prediction as illustrated in the Figure 4.4 It showed the gradual optimum values for the next five years to come based on the model of efficiency in power distribution in Ilorin.
V. CONCLUSION
This study investigated the efficiency level of power distribution in Ilorin using linear programming method of optimization technique. The result showed that IBEDC in Ilorin, despite receiving electric power that is not sufficient to serve the people of Ilorin effectively have not been functioning to their best based on the amount of power they are able to bill from the amount they are receiving currently. More so, the study also established that there is a significant loss of energy from the little available that can be distributed in order for the unit to function optimally for a better performance. The study was able to predict future efficiency levels for the next five years in the following order 72.16%, 75.84%, 80.22%, 93.43% and 93.43% using Mathlab and Maple for numerical computation of the efficiency model created by Newton Gregory Backward Difference Formula. From this research work, it can be concluded that despite the huge investments in the power sector since after independence, the country with over 180 million people has a recurring cycle with little or no development in the power sector. Particularly in Ilorin Metropolis the capital city of Kwara state, the research was able to establish that the IBEDC in Ilorin has been receiving voltage of electric power that is very small compare to the amount needed to serve the entire city effectively. Obviously, it is a public knowledge that there is a problem of low power generation from the national grid which directly influences the little available amount that is being transmitted and distributed to various states and to local government level. The energy sector can however be improved to function optimally if we reduce the amount of wasted energy on a monthly basis and make judicious use of the little being generated till the system becomes better.
REFERENCES
- Addeh E. 2021 NESO: Nigeria Generates Only 15.6% of National Electricity Requirement. This Day Live. https://www.thisdaylive.com/index.php/2021/07/21/neso-nigeriagenerates- only 15-6of-national -electricity-requirement/
- Adekoya F., and Jeremiah K. 2019 Nigeria’s struggle to go beyond 4000MW decades after independence. The Guardian https://www.guardian.ng/energy/nigerias-struggle-to-gobeyond4000 MW decades-after-independence/
- Adenikinju, A. F. 2005 Analysis of the cost of infrastructure failures in a developing economy: The case of the electricity sector in Nigeria. Nigerian Journal of Technology, 23(5), 113-115.
- Bhalla, V Bajpai, RP and Bharadwaj, LM. 2003 DNA electronics: DNA and electronics seem to be two different things, but a series of events has highlighted the unusual ability of DNA to form electronic components. EMBO reports, 4(5), 442-445.
- Butcher JC 2021. B-series: algebraic analysis of numerical methods (Vol. 55). Berlin: Springer.
- Byju’s 2022 Linear Programming. https://byjus.com/maths/linearprogramming/
- Ejor E. 2021. Power Generation: Nigeria’s average unutilized power rises 291 to 3,008.1MW in 8 Years Vanguard https://www.vanguardngr.com/2021/11/power-generation-nigeriasaverageunutilized-power-rises-291-to-3008-1mw-in-8-years/
- IBEDC 2016. Kwara Needs 270mw for 24-Hour Electricit. https://www.ilorin.info/fullnews.php?id=18082.
- Nwokoye, ES, Dimnwobi, SK., Ekesiobi, CS and Obegolu, CC. 2017. Power infrastructure and electricity in Nigeria: Policy considerations for economic welfare. KIU Journal of Humanities, 2(1), 5-17.
- Okpare, A, and Okreghe CO. 2020. Power energy distribution and consumption in Nigeria: The way forward for sustainable industrial and commercial development. Nigerian Journal of Technology, 39(3), 853-859.
- Oladipo, K, Felix AA, Bango, O, Chukwuemeka, O and Olawale, F. 2018. Power sector reform in Nigeria: challenges and solutions. IOP Conference Series: Materials Science and Engineering Vol. 413, No. 1, pp. 012037
- Olatunji O, Akinlabi S, Oluseyi A, Abioye, A, Ishola F, Peter M, and Madushele, N 2018 Electric power crisis in Nigeria: A strategic call for change of focus to renewable sources. IOP Conference Series: Materials Science and Engineering Vol. 413, No. 1, pp. 012053.
- Simon E.S. 2021 Nigeria Tops Countries with Poorest Electricity Access. Daily Trust. http://www.dailytrust.com/nigeria-tops-countiries-with-poorest-electricity-access
- Tena N. 2021 Major investments needed to deal with unutilized power challenge. ESI Africa https://www.esi-africa.com/industry-sectors/generation/major-investmentsneeded-to-deal-with-unutilised-power-challenge/
- USAID 2021 Power Africa Fact Sheet. https://www.usaid.gov/powerafrica/Nigeria