
Physicochemical Properties of Water Sources During the Wet Season in Enyigba and Ikwo Minig Districts of Ebonyi State, Nigeria.
- Ideozu, Richmond.Uwanemesor
- Udom, Godwin. Jeremiah
- Ejere Cornell
- 60-74
- Feb 1, 2024
- Environmental Impact
Physicochemical Properties of Water Sources During the Wet Season in Enyigba and Ikwo Minig Districts of Ebonyi State, Nigeria.
Ejere Cornell1., Udom, Godwin. Jeremiah 2 & *Ideozu, Richmond.Uwanemesor3
ˡ1nstitute of Natural Resources, Environment & Sustainable Development (INRES) University of Port Harcourt, Nigeria.
2 &3Department of Geology, Faculty of Science, University of Port Harcourt, Rivers State, Nigeria.
*Corresponding Author
DOI: https://doi.org/10.51584/IJRIAS.2024.90106
Received: 26 December 2023; Accepted: 03 January 2024; Published: 31 January 2024
ABSTRACT
This study evaluated the physicochemical properties of water sources in Enyigba and Ikwo Minig Districts of Ebonyi State, Nigeria. Water samples from surface water, mine pit water, and groundwater (borehole) were collected from the mining districts, while water samples Abakaliki served as Control. Temperature, pH, electrical conductivity (EC) and total dissolved solids (TDS) were read using a water Multi meter (TK303 PLUS) while K, Mg, Na and Ca were analyzed using AAS (Agilent Clara, CA) Model 55AA. Sulphate and Phosphate were analyzed using APHA procedure while Nitrate and Carbonate were analyzed using EPA 352.1 and SAP 1999 methods respectively. The mean concentrations of physical parameters in Enyigba and Ikwo Mining Districts are Temperature (27.07 °C and 29.57°C), pH (5.70 and 5.80), EC (430.00 mg/l and 357.33 mg/l) and TDS (214.67 mg/l and 178.67 mg/l) respectively. The mean values for the Control are temperature (29.70°C), pH (6.06), EC (799.00) and TDS (396.00) respectively. Whereas the mean concentrations of cations and anions in Enyigba and Ikwo Mining Districts are K (2.98 mg/l and 4.54 mg/l), Mg (11.16 mg/l and 7.23 mg/l), Na (16.07 mg/l and13.48 mg/l), Ca (29.97 mg/l and 39.36 mg/l), Nitrate (0.32 mg/l and 0.39 mg/l), Sulphate (0.0010 mg/l and 0.0010 mg/l), Phosphate (0.0027 mg/l and 0.0023 mg/l) and Ca (0.100 mg/l and 0.15 mg/l) respectively. Whereas the mean concentrations for the Control are K (2.61 mg/l), Mg (10.63 mg/l), Na (38.30 mg/l), Ca (48.93 mg/l), Nitrate (0.0010 mg/l), Sulphate (0.0010 mg/l), Phosphate (0.0020 mg/l) respectively. From the results, the physicochemical parameters in the study area are within the threshold limits of the WHO and NESREA standards except EC for Eyingba (430) and Control (799) is higher than the WHO threshold of 400 but lower than for NESREA. The implications of these results only EC has effects on the quality of water sources at Eyingba pose health risks which require mitigation measures during the rainy season whereas the rest physicochemical parameters do not pose health risks.
Key Words: Lead-Zinc, Heavy metals, Water sources, Water quality
INTRODUCTION
Mining activities in active and abandoned mine sites is a major source of water pollution especially heavy metal pollution in the study area (Alor, et al 2016). Several studies carried out within the study area suggests mining activities is a major source of water pollution. Water is a resource invaluable to living things, essential for the sustenance of life on earth due to its diversified uses like in drinking, washing, cooking, irrigation, and farming (Oyem, et al, 2014). The quality of drinking water is a powerful environmental determinant of health (WHO, 2010) hence, adequate supply of safe drinking water is universally recognized as a basic human need for good health, and one of the most essential factors of civilization (Oyem, et al, 2014). Millions of people in developing countries do not have access to adequate and safer water supply (Oyen, et al, 2014). It is estimated that about 65 million Nigerians have no access to safe drinking water (Majura et al 2010). Enyimgba and IKwo Mining Districts of the study area is subset of the statistics above. The quality of water has been affected by increase in anthropogenic activities and any pollution either physical or chemical causes changes to the receiving water body of the study area (Aremu et al 2011). Other source of water pollution may be open defecation estimated that about 80% of all sicknesses and diseases in the world may be caused by very to poor sanitation habits, polluted water, or unavailability of water (WHO 1997). Because of inadequate sources of safer drinking water, residents have resorted to the use of water sources such as abandoned mine pits scattered in the study area for domestic uses with the attendant health risk from water pollution causing tremendous diseases and sickness, as reported in the past of outbreak of guinea worm in the study area. This article valuated the physiochemical properties (Temperature, pH, Total dissolved Solids (TDS), Electrical Conductivity (EC), Sodium (Na), Potassium (K), Calcium (Ca), Magnesium (Mg), Sulphate, Phosphate, Nitrate and Carbonate of water sources of the mining districts of Enyigba, and Ikwo with Abakaliki as control. The pollution of water sources by unregulated artisanal mining activities in the study area prompted this research. The study area (Enyimgba and Ikwo Mining Districts including the Control) are in Ebonyi State and made up mainly of hydromorphic soils which consist of reddish brown, gravely and pale colored clayey sediments, shallow in depth. The topography is largely table land with the highest point 162m and lowest 15m above sea level, within the Cross-River Drainage Basin. The Major rivers in the study area is the Ebonyi River a tributary of the Cross River (Obasi, et al., 2020). The study area lies within the southern Benue Trough with a sedimentary succession of pre-Santonian periods that span from Albian to Turonian see Table 1. The Asu River Group (Albian) has lithofacies consisting of alternating shales and siltstones with occurrences of fine grained micaceous and feldspathic sandstones, mudstones, and limestones (Reyment 1965; Eyankware and Obasi 2021; Hoque, 1977). Reports of magmatic intrusions range from basic to intermediate igneous rocks within the Ishiagu area (Chukwu & Obiora, 2014) and pyroclastic intrusions within the Abakaliki area (Olade,1975). The Eze-Aku Group (Turonian) unconformably overlies the Asu River Group. The lead-Zinc mineralization occurs in veins as open space fillers which is structurally controlled and localized in fissures, fault zones and gently dipping veins (Murat, 1972). The veins are steeply dipping with depths over 150m but vary in width from less than a meter to 20m to 120m. The dominant ores in the area are mined from the fissures which contain lodes of sphalerite (ZnS), and /or galena (PbS) in association with smaller quantities of copper. The deposits have been mined on and off for several decades and is believed to be the source of various disease conditions at Enyigba, Ameri and Ameka areas near Abakaliki District (Wright, 1968; Nwachukwu, 1972; Eyankware and Obasi,2021). The post Albian mineralization is mined unregulated by authorities which in turn has played a major role in the introduction of heavy metals and increase in anions and cations into soil and water sources within the study area (Onyeobi, 1972; Yankware & Obasi 2021). The drainage system of the study area is dendritic with the Ebonyi River as the major river that drains the area. Most of the artisanal mines are scattered in small hilly areas which drain into distributaries in the lowlands. According to Eyankware, et al., (2020), the climate of the study area tends favors the dispersion of the resultant pollution from the mining and quarry activities. High amount rainfall results in surface runoff that transport heavy metals and assist its infiltration into groundwater (Eyankware & Obasi 2021). The study area falls within two major seasons- dry and wet seasons. The wet season is experienced from March to ending of October, while the dry season starts from October to ending of February. During the dry season, the temperature ranges from 25o C to 29o C, and between 16oC and 28o C during the wet season. (Eyankware et al., 2021). The study area is within the rainforest region of Southeastern Nigeria, with humid climate and evergreen vegetation. According to Eyankware et al (2021), the average monthly rainfall ranges from 3.1mm in January to 270mm in July. The annual rainfall ranges from 1750 in January to 2250mm in July. The study area comprises of vegetation with dense and underground creepers, the trees are mostly tall in some locations, with buttress roots around river bodies, while the vegetation is influenced by various factors including drainage, geology, topography, and rainfall. The major characteristic of the vegetation of the study area is the abundant combination of varied plant groups whose branches intertwine to form a continuous canopy of leaves within the Area. The predominant vegetation visible along this area is the grasslands, with scattered forests and woodland areas, as well as tropical rainforest which comprise of tall trees with thick undergrowth and less branches. (Anyahara, et al., 2021). The study area is located within latitude 6.26°N and 8.01°E (Fig 3.1). It may be assessed through 2 wide network of roads and has a total land area of 5,533km2 (Fig 1).
Table 1 Showing Stratigraphic column of the study area. [After Obasi et al. (2020)].
| Period | Age | Group | Formation | Member |
| Cretaceous | Turonian | Eze-Aku | Nkalagu Eze-Aku shales | |
| Albian | Asu River | Abakaliki Volcanics | Pyroclastics Dolerites/diorites | |
| Asu River shales | Shale and sandstones | |||
| Precambrian Basement Complex |
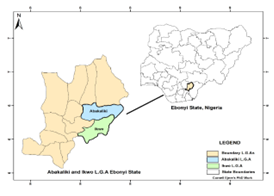
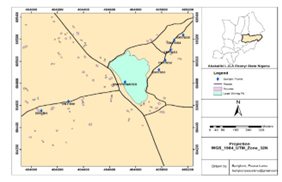
Fig 1a. Fig 1b.
Fig 1a. Map of Nigeria showing the study areas in Ebonyi State. Fig 1b. Map Showing Enyigba Sample locations.
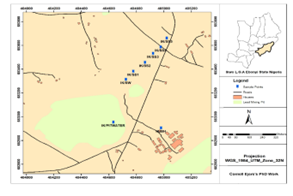
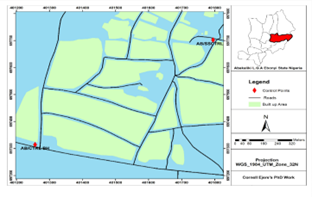
Fig 1c. Fig 1d.
Fig 1c Map Showing Ikwo Sample locations. Fig 1d Map showing Abakaliki Town (Control) sample locations.
MATERIALS AND METHODS
Methodology
Water samples were taken at Enyigba and Ikwo Mining Districts and Control Abakaliki District 3 samples from Enyigba [one (1) borehole, one (1) surface water, and one (1) pit water]; three samples from Ikwo [one (1) borehole, one (1) surface water, and one (1) pit water]; and Control site [one (1) borehole]. For the mining pit waters and surface waters, two 1-liter plastic container were used to collect water at a depth of 10 cm below the water surfaces for each, whereas, for borehole, the two 1-liter plastic container were used to collect a running water from the borehole. After collection, the samples for laboratory analysis were placed in ice pack for preservation while samples for physicochemical properties (pH, Temp, EC and TDS) were measured in the field (in-situ measurements) and results recorded. All samples for chemical analysis were properly taken and labeled before subsequent sending for laboratory analyses.
Water Sample Analysis
The water samples were analyzed for physicochemical parameters such as Temperature, pH, Electrical Conductivity (EC), and Total Dissolved Solid (TDS) at sight (in-situ) using a calibrated TK 303 PLUS Water Quality Meter, and results obtained.
Measurement of Temperature EC, TDS and pH
Temperature EC, TDS and pH was measured using the Multimeter (TK303 PLUS Water Quality Meter) and was carried out by dipping the probe of the multimeter into the sample, and thermometer button of the multi meter pressed to take the recording of temperature EC, TDS and pH at stable reading.
CHEMICAL ANALYSIS
Cations
Determination of Sulphate in water (APHA, 2017)
The UV/Visible Spectrophotometer, pH meter, Glass electrode, Mechanical shaker, Centrifuge and Water bath was used to determine the concentration of Sulphate.
Reagent:
Conditional reagent was prepared by dissolving 30g Magnesium chloride, 5g Sodium acetate, 1g Potassium nitrate, KNO3 and 20ml glycerol in 500ml distilled water and made up to 1000ml. Barium chloride crystals, 20-30mesh. Standard sulphate solution: 0.1479g anhydrous sodium sulphate, Na2SO4 was dissolved in distilled water and dilute to 1000ml.
1ml = 100 μg SO42- (μg/ml = mg/l= ppm).
Calibration
Prepare standard curve by carrying standard sulphate solution through entire procedure.
Space standards at 5mg/l increment in the 0 to 40 mg/l range. Read mg SO42- present in the sample from the standard curve.
Procedure
- 50 ml of sample was transferred into a 250ml Erlenmeyer flask.
- 20mL buffer solution was added and mixed well.
- 0.5g BaCl2 crystals was added while stirring. Continue stirring for 1 minute after addition of BaCl2.
- Pour suspension into an absorption cell of UV/visible Spectrophotometer.
Calculation
mg SO42-/l = [mg (SO42-) x 1000] / [vol of sample] ————(1)
Determination of Nitrate in water (EPA Method 352.1)
Apparatus: Spectrophotometer, Boiling tube, water bath, Pipette and Beaker.
Reagents:
Brucine-Sulphanilic acid solution: 0.1g brucine sulphate and 0.01g sulfanilic acid were dissolved in approximately 7ml hot distilled water. 0.3ml concentrated HCl was added, cooled, and made up to 100ml with distilled water.
Sulphuric acid (H2SO4) solution: 250ml concentrated H2SO4 was added carefully to 62.5ml distilled water. Then cooled to room temperature before using and kept tightly to prevent absorbance of atmospheric moisture.
Sodium chloride solution (NaCl); 30%: 30g NaCl was transferred quantitatively into 100ml volumetric flask and made up to mark with distilled water.
Stock Nitrate solution: 0.7218 g anhydrous potassium nitrate was dissolved and diluted with 1-Liter distilled water in a volumetric flask.
Standard nitrate solution: 2.5ml of stock nitrate solution was diluted with 25ml distilled water. Note: Prepare immediately before use.
Nitrate standard: 1.00, 2.00, 4.00, 7.00 and 10.00ml were diluted with 10 mL distilled water to have 0.1, 0.2, 0.4, 0.7, and 1.0mg/l N respectively.
Procedure:
- 10ml of water sample was transferred into a boiling tube.
- The boiling tube was put into a cool water bath and 2ml of 30% NaCl solution was added.
- It was thoroughly stirred and 10ml H2SO4 solution was added.
- It was swirled again, allowed to cool and 0.5ml Brucine-Sulphanilic acid solution was added.
- The tube was swirled to mix thoroughly, and the tube was placed in a well stirred boiling water bath that maintains a temperature of not less than 95o
- After exactly 20 minutes, the sample was removed and immersed in a cool water bath, allowed to cool to room temperature.
- Absorbance was measured at 410nm.
Calculation
mg N /L = {mg (NO3-N} / {vol of sample} —————–(ii)
Determination of Phosphate in water (APHA, 2017)
Apparatus: Spectrophotometer, filtration apparatus, Whatman No 42- filter paper.
Reagents:
(a) Phenolphthalein indicator aqueous solution: 0.5g phenolphthalein disodium salt was dissolved in distilled water and diluted to 100ml.
(b) Hydrochloric acid (HCl): concentrated.
(c) Activated carbon: remove fine particles by rinsing with distilled water.
(d) Vanadate-molybdate reagent:
Solution A: 12.5g ammonium molybdate {(NH4)6Mo7O24.4H2O} was dissolved in 150ml distilled water. Solution B: 0.625g ammonium metavanadate (NH4VO3) was dissolved by heating to boiling in 150ml distilled water. Cool and add 165ml of concentrated HCl. Solution B was cooled to room temperature, solution A was poured into B, mixed, and dilute to 500ml.
(e) Standard phosphate solution: 219.5mg anhydrous potassium dihydrogen orthophosphate (KH2PO4) was dissolved in distilled water and dilute to 1000ml.
Procedures:
35ml of sample was placed in a 50ml volumetric flask.
(a) For sample with pH greater than 10, 1 drop of phenolphthalein indicator was added to 50.0ml sample and discharge the red color with 1:1 HCL before diluting it to 100ml.
(b) Excessive color was removed in sample by shaking about 50ml with 200mg activated carbon in an Erlenmeyer flask for 5 minutes and filter to remove carbon. Check each batch of carbon for phosphate. 10 ml vanadate-molybdate reagent was added and diluted to the mark with distilled water. A blank was prepared in which 35ml distilled water is substituted for the sample and treat in the manner as sample. After 10 minutes the absorbance of the sample was measured against the blank at a wavelength of 470nm. A set of serially diluted standard solutions containing 2.0 – 12.0 and 16.0ml in 50ml final volume was prepared corresponding to 0.10 – 0.60 and 0.80mg PO43- – P respectively.
Calculation
mg P/L = {mg (P) x 1000} / (vol of sample) —————–(iii)
Determination of Carbonate in water (SAP, 1999).
Apparatus: Pipettes, Burette, Erlenmeyer flasks.
Reagents:
Methyl orange Indicator
Sulfuric Acid Solution (H2SO4), 0.05M: Add 28ml concentrated H2SO4, to about 600-800ml distilled water in a 1-liter flask, mix well, let it cool, and bring to 1-liter volume. This solution contains 0.5 H2SO4 solution (stock Solution) Pipette 10ml Stock Solution to 1-liter flask, and bring to volume with Deionized water. This solution contains 0.005M H2SO4.
Phenolphthalein Indicator.
Procedure
Pipette a suitable aliquot of water sample (10ml water sample) in a 250 ml Erlenmeyer flask. Add 1 drop phenolphthalein indicator. If pink color develops, add 0.005M H2SO4 by a burette, drop by drop, until the color disappears. Take the reading. Continue the titration with 0.005M H2SO4 after adding 2 drops 0.1% methyl orange indicator until the color turns to orange. Take the reading (T).
Calculation:
mg CO32- / L=0.94 x [(T – 5.0 x 10(pH – 10)) / (1 + 0.94 x 10(pH – 10))] —————-(iv)
Statistical Analysis
Statistical methods were employed for analysis of results obtained (mean, range, and standard deviation). Statistical analysis was carried out using SPSS version 23 software and Microsoft excel spread sheet. Comparisons of the results benchmarked against the following standards: WHO/FAO and NESREA.
RESULTS AND DISCUSSIONS
The results of this study are presented in Figs. 2 – 14 and Table 2 -3.
Results of the Physical Properties of Water Sources in wet season of the Study Area
Temperature
Mean Temperature of water sources in Enyigba Mining District was lowest (27°C) compared to Ikwo Mining District (29°C) and Control (29°C). The Control and Ikwo Mining District had the highest mean of Temperature, implying that the risk factor is least at Enyigba Mining District (Table 2 – 3 and Fig 3). However, the temperature in this study area in wet season was found within permissible limit WHO of 30°C, (Ezeribe, et al. (2012) reports similar result (29°C) of well waters in Nigeria.
pH
pH is an important parameter in evaluating the acid–base balance of water and also an indicator of acidic or alkaline condition of water status. The WHO recommended maximum permissible limit of pH range 6.5 – 8.5. The pH is determined by the amount of dissolved carbon dioxide (CO2), which forms carbonic acid in water. Mean pH level at Enyigba Mining District was lowest (5.6) compared to Ikwo Mining District (5.8) and Control (6.0). The Control had the highest mean pH (Table 2 – 3 and Fig 4). T-test (32.272) and significant value (P = 0.000), which is less than 0.05 level of significance (P< 0.05) suggests that the mean pH across the study area were significantly different from WHO/FAO Standards. However, the mean pH in study area was lower than WHO/FAO (8.5) and NESREA (8.5) standard respectively. This low pH suggests that the water sources in the Mining Districts and the Control is acidic. Present investigation was similar with reports by Aremu et al (2011).
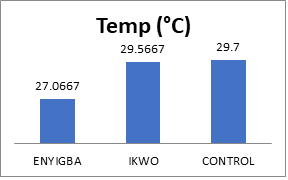
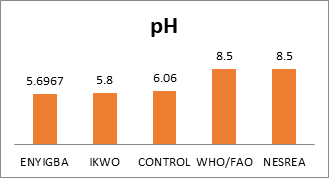
Fig. 3 Fig. 4
Fig 3 Mean Temperature of Water Sources of the Study Area – Wet Season. Fig 4 Mean Concentration of PH in water sources – Wet Season
EC
Pure water is not a good conductor of electric current, but it is a good insulator. Increase in ion concentration enhances the electrical conductivity of water. Mostly, the number of dissolved solids in water determines the electrical conductivity. EC measures the ionic process of a solution that enables it to transmit current. The permissible limit of EC by WHO is 400µS/cm. In the current study, the Mean concentration of EC at Ikwo Mining District was lowest (357.3333 µs/cm) compared to Enyigba Mining District (430.0000 µs/cm) and Control (799.0000 µs/c). The Control has the highest mean of EC (Table 2 – 3). T-test (0.440) and significant value (P = 0.675) is greater than the 0.05 level of significance (P> 0.05) suggesting the mean EC across the study area is significantly different from WHO/FAO Standards. However, the mean of EC in the study area is greater than WHO/FAO (400 µs/cm) but less than NESREA (1000 µs/cm) standard respectively (Fig 5). This indicates that water in the study area is highly ionized.
Table 2 Mean Concentrations of Physicochemical Properties of Water Sources in the Wet Season Water of the Study Area
| PARAMETERS | ENYIGBA | IKWO | ABAKALIKI (CONTROL) | WHO/FAO | NESREA |
| K (mg/l) | 2.9783 | 4.5390 | 2.6080 | 12 | N/A |
| Mg (mg/l) | 11.1597 | 7.2260 | 10.6290 | 50 | 20 |
| Na (mg/l) | 16.0703 | 13.4783 | 38.2960 | 200 | 200 |
| Ca (mg/l) | 29.9687 | 39.3590 | 48.9260 | 75 | 200 |
| Nitrate (mg/l) | 0.3160 | 0.3937 | 0.0010 | 50 | 50 |
| Sulphate (mg/l) | 0.0010 | 0.0010 | 0.0010 | 250 | 100 |
| Phosphate (mg/l) | 0.0027 | 0.0023 | 0.0020 | 1 | N/A |
| Carbonate (mg/l) | 0.1000 | 0.1533 | 0.1300 | 200 | 150 |
| Temp (°C) | 27.0667 | 29.5667 | 29.7000 | Ambient | Ambient |
| pH | 5.6967 | 5.8000 | 6.0600 | 6.5-8.5 | 6.5-8.5 |
| EC (µs/cm) | 430.0000 | 357.3333 | 799.0000 | 400 | 1000 |
| TDS (mg/l) | 214.6667 | 178.6667 | 396.0000 | 500 | 500 |
TDS
Water has the capacity to dissolve a wide range of inorganic and some organic minerals or salts such as potassium, calcium, carbonate, sodium, chlorides, magnesium sulphates phosphates, etc. these minerals produce un-wanted taste and diluted color in appearance of water. Water with high TDS value indicates that the water is highly mineralized. WHO/FAO and NESREA have permissible limit of TDS as 500mg/l for drinking water. The mean concentration level of TDS at Ikwo Mining District was lowest (178.6667 mg/l) compared to Enyigba Mining District (214.6667 mg/l) and Control (396.0000 mg/l). The Control had the highest mean of TDS. The T-test (4.714) and significant value (P = 0.003) is less than 0.05 level of significance (P< 0.05) implies that the mean TDS across the study area is significantly different from WHO/FAO Standards. However, the mean of TDS in study area is less than WHO/FAO (500 mg/l) and NESREA (500 mg/l) standard respectively (Table 2 – 3) indicating that the TDS of the study area is within acceptable limits. Similar value was reported by Meride & Ayenew (2016). High level of TDS in groundwater are generally not harmful to human, but high concentration of these may affect persons who are suffering from kidney and heath diseases (Meride & Ayenew, 2016). In addition, water containing high solid may cause laxative or constipation effects (Sasikaran et al. (2012).
Table 3 Range of Wet Season Physicochemical properties of Water Sources in the Study Area
| PARAMETERS | ENYIGBA (RANGE) | IKWO (RANGE) | ABAKALIKI TOWN (CONTROL) (RANGE) |
| K(mg/l) | 1.32-5.38 | 1.45-9.99 | 1.00-2.61 |
| Mg(mg/l) | 1.14-16.26 | 1.24-10.39 | 10.00-10.63 |
| Na(mg/l) | 0.77-28.97 | 1.20-27.57 | 3.80-38.30 |
| Ca(mg/l) | 3.12-46.70 | 32.86-47.11 | 4.93-48.93 |
| Nitrate(mg/l) | 0.00-0.48 | 0.00-1.10 | 0.00-0.00 |
| Sulphate(mg/l) | 0.00-0.00 | 0.00-0.00 | 0.00-0.00 |
| Phosphate(mg/l) | 0.00-0.01 | 0.00-0.00 | 0.00-0.00 |
| Carbonate(mg/l) | 0.02-0.21 | 0.13-0.18 | 0.13-0.13 |
| Temp (°C) | 24.30-28.70 | 29.20-30.10 | 29.70-29.70 |
| pH | 5.46-5.90 | 5.63-6.05 | 6.06-6.06 |
| EC (µs/cm) | 46.00-739.00 | 42.00-636.00 | 79.00-799.00 |
| TDS (mg/l) | 23.00-369.00 | 21.00-319.00 | 39.60-396.00 |
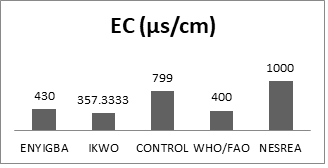
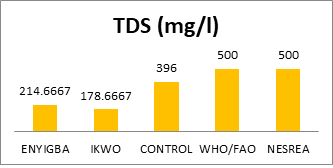
Fig. 5 Fig. 6
Fig 5 Mean Concentration of Electrical Conductivity in water sources – Wet Season. Fig 6 Mean Concentration of TDS in Water sources – Wet season
Results of Chemical Properties of Water Sources in the Wet Season of the Study Area
Potassium (K)
Potassium is silver white alkali found in igneous rocks, and is highly reactive with water. Because of its high solubility, Potassium is less common in sedimentary rocks. When it leeches, it recombines with other minerals. Hence, it is always found in small concentration in groundwater (Offodile, 2014). Potassium is necessary for living organism functioning hence found in all human and animal tissues particularly in plants cells. It is vital for human body functions like heart protection, regulation of blood pressure, protein dissolution, and muscle contraction. According to WHO standards, the permissible limit of potassium is 12 mg/1. Results of concentration of K is shown in Table 2 – 3. Present study is similar with reports by Aremu et al (2011). The Control had mean concentration of K (2.6080 mg/l) lower than that of Enyigba (2.9783 mg/l) and Ikwo Mining Districts (4.5390 mg/l) respectively. This reveals that the Control site is safer than the Mining Districts studied (see Tables 2 – 3). The T-test (7.108) and significant value (P = 0.000) is less than 0.05 level of significance (P<0.05) implies that the mean concentration of K across the sites were significantly different from WHO/FAO Standards. However, the mean concentration of level of K in all the sites was lower than WHO/FAO (12 mg/l) standard (Fig 7).
Magnesium (Mg)
Magnesium is essential for proper functioning of living organisms and found in minerals like Dolomite, magnetite etc. Human body contains about 25 g of magnesium (60 % in bones and 40 % in muscles and tissues). Magnesium occurs as carbonates, hydroxides, oxide, phosphates, and Silicates. Magnesium are readily soluble compared others (Offodile, 2014). It has the same effect on water as Calcium, producing hard water. It also improves soil fertility as calcium, and is an essential constituent of plant chlorophyl. Mean concentration level of Mg in Ikwo site was lowest (7.2260 mg/l) compared to Enyigba site (11.1597 mg/l) and Control (10.6290 mg/l). Enyigba site had the highest mean concentration of Mg, implying that the risk factor is least in Ikwo than Enyigba and Control respectively (Tables 2 – 3). T-test (17.372) and significant value (P = 0.000), which is less than 0.05 level of significance (P< 0.05), implies that the mean concentration of Mg across the sites were significantly different from WHO/FAO Standards (Appendix). However, the mean concentration of level of Mg in all the sites was lower than WHO/FAO (50 mg/l) and NESREA (20 mg/l) standard respectively (Fig 8).
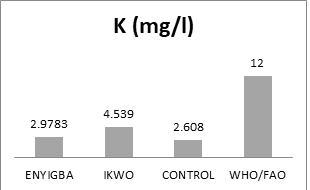
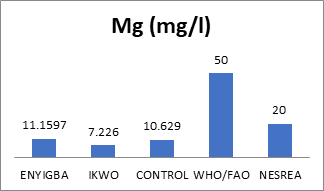
Fig. 7 Fig. 8
Fig 7 Mean concentration of K in water sources – Wet Season. Fig 8 Mean Concentration of Mg in Water Sources – Wet Season
Sodium (Na)
Sodium occurs widely in water and in many igneous rocks. It is an essential component of most ground water, but more abundant in saline water (Offodile, 2014).it readily soluble in water in compound form. The high concentration in soil is unfavorable for plant growth as it renders the soil alkaline by replacing Calcium and Magnesium that is good for plants. Ca and Mg rich waters reduces the high concentrations of Na in soil (Offodile, 2014). Excessive Na can be toxic for some plants. The mean concentration of Na in Ikwo Mining District was lowest (13.4783 mg/l) compared to Enyigba Mining District (16.0703 mg/l) and Control (38.2960 mg/l). The Control had the highest mean concentration of Na, suggesting that the risk factor is least at Ikwo than Enyigba Mining Districts and Control respectively (Table 2 – 3). The T-test (33.427) and significant value (P = 0.000), which is less than 0.05 level of significance (P< 0.05), implies that the mean concentration of Na across the study area is significantly different from WHO/FAO Standards. However, the mean concentration of Na in study area is lower than WHO/FAO (200) and NESREA (200 mg/l) standard respectively (Fig 9).
Calcium (Ca)
Ca is important for human cell physiology and bones. About 95 % of Ca in human body stored in bones and teeth. The high deficiency of calcium in humans may cause rickets, poor blood clotting, bones fracture etc. and the exceeding limit of Ca produced cardiovascular diseases. According to WHO (2012) the permissible limit in drinking water is 75 mg/l. In sulphate form, Ca is relatively less soluble in water, while very soluble in CaCl and Ca Nitrate (Offodile, 2014). High concentration of Ca in water tends to precipitate in laundry, domestic and industrial uses. It is an important mineral in agriculture and makes the soil friable and easily cultivated (Offodile, 2014). In the study, the mean concentration of Ca at the Control was highest (48.9260 mg/l) compared to Enyigba (29.9687 mg/l) and Ikwo (39.3590 mg/l) Mining Districts respectively. Enyigba Mining District had the lowest mean concentration of Ca, implying that the risk factor is greatest at Control than Enyigba and Ikwo Mining Districts respectively (Table 2 – 3). The T-test (6.379) and significant value (P = 0.001), which is less than 0.05 level of significance (P< 0.05), implies that the mean concentration of Ca across the sites were significantly different from WHO/FAO Standards (appendix). However, the mean concentration of level of Ca study area was lower than WHO/FAO (75) and NESREA (200 mg/l) standard respectively (Fig 10).
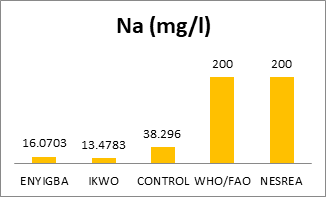
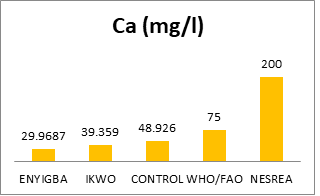
Fig. 9 Fig. 10
Fig. 9 Mean Concentration of Na in Water Sources – Wet Season. Fig 10 Mean Concentration of Ca in water sources – wet season.
Nitrate (NO3-1)
Nitrate is one of the most important diseases causing parameters of water quality particularly blue baby syndrome in infants. The sources of nitrate are nitrogen cycle, industrial waste, nitrogenous fertilizers etc. The WHO allows maximum permissible limit of nitrate 5 mg/l in drinking water.
Nitrate is an essential ingredient of plant nutrition. It occurs in soils, and can be fixed by leguminous plants. Nitrate is regarded as an indicator of pollution in public water supply (Offodile, 2014). The mean concentration of Nitrate at Control site was lowest (0.0010 mg/l) compared to Enyigba (0.3160 mg/l) and Ikwo (0.3937 mg/l) Mining Districts. Ikwo Mining District had the highest mean concentration of Nitrate, implying that the risk factor is least at Control than Enyigba and Ikwo Mining Districts respectively (Table 2 – 3). The T-test (319.410) and significant value (P = 0.000), which is less than 0.05 level of significance (P< 0.05), implies that the mean concentration of Nitrate across the study area was significantly different from WHO/FAO Standards. However, the mean concentration of level of Nitrate in study area was lower than WHO/FAO (50) and NESREA (50 mg/l) standard respectively (Fig 11). This result indicates that the study area is free from pollution of Nitrate, and as well lack one of the basic ingredients for plants growth.
Sulphate (SO4-2)
Sulphur is useful to plants (Offodile, 2014). Sulphate is derived from the dissolution of salts of Sulphuric acid and abundantly found in almost all water bodies. High concentration of sulphate may be due to oxidation of pyrite and mine drainage. Sulphate concentration in natural water ranges from a few to a several 100 mg/liter, but no major negative impact of sulfate on human health is reported. Sulphate occurs mostly as Calcium Sulphate (Gypsum) (CaSO4.2H2O) Sodium and Magnesium Sulphate are readily soluble in water while Calcium sulphate is less soluble.
In the study, the mean concentration level of Sulphate was the same (0.0010 mg/l) for all the sites monitored (Table 2 – 3). However, the mean concentration of level of Sulphate in all the sites was lower than WHO/FAO (250 mg/l) and NESREA (100 mg/l) standard respectively (Fig 12.). The result indicates that the soil of the study area lacks essential mineral required for the growth of plants.
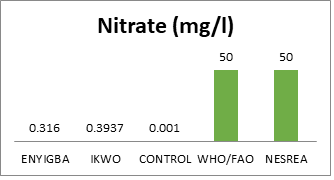
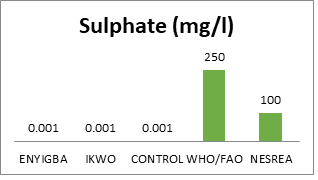
Fig. 11 Fig. 12
Fig 11 Mean Concentration of Nitrate in water – wet season. Fig 12 Mean Concentration of Sulphate in water – Wet Season.
Phosphate (PO4-3)
Phosphorus is a non-metallic element which is necessary for life and is found in rock as inorganic phosphates. As water runs over and passes through rocks, it carries off small amounts of the minerals such as Ca, Mg, and phosphates. Animals obtain their essential phosphorus from phosphates in water and plant material. Natural waters have a phosphorus concentration of approximately 0.02 parts per million (ppm) which is a limiting factor for plant growth. On the other hand, large concentrations of this nutrient can accelerate plant growth. High concentration of phosphate, if consumed can be toxic. It can cause diarrhea and calcification (hardening) of organs and soft tissue and can interfere with the body’s ability to use iron, calcium, magnesium, and zinc. Phosphate levels greater than 1mg/l may interfere with coagulation in water treatment plants. The mean concentration level of Phosphate at Control site was lowest (0.0020 mg/l) compared to Enyigba site (0.0027 mg/l) and Ikwo (0.0023 mg/l). Enyigba site had the highest mean concentration of Phosphate, implying that the risk factor is least at Control site than Enyigba and Ikwo sites respectively (Table 2 – 3). T-test (2074.260) and significant value (P = 0.000), which is less than 0.05 level of significance (P< 0.05) implies that the mean concentration of Phosphate across the sites were significantly different from WHO/FAO Standards. However, the mean concentration of Phosphate in study area was lower than WHO/FAO (1 mg/l) standard (Fig 13). The result indicates that the study area lacks phosphates that is essential for plant growth.
Carbonate (CO3-2)
Carbonate hardness makes water more basic and acts as a buffer to protect against pH instability, which means mineralized water is more able to resist changes in pH. Directly related is alkalinity, the measure of a solution’s ability to neutralize an acid. The combined effect of the Carbonates, and bicarbonates determines the pH value of water (Offodile ,2014). When in combination with calcium and magnesium, it causes carbonate hardness. It is dissolved from rocks and soil containing gypsum, Iron Sulphides, and other Sulphur compounds. Alkalinity is a measure of the presence of bicarbonate, carbonate or hydroxide constituents. Concentrations less than 100 ppm are desirable for domestic water supplies. Carbonate of Sodium and Potassium are water soluble while those of Calcium and Magnesium are insoluble. Water hardness can be determined based on these concentrations of calcium carbonate: Below 75 mg/L – is generally considered soft. 76 to 150 mg/L – moderately hard. 151 to 300 mg/L – hard. The mean concentration level of Carbonate at Enyigba site was lowest (0.1000 mg/l) compared to Ikwo site (0.1533 mg/l) and Control (0.1300 mg/l). Ikwo site had the highest mean concentration of Carbonate, implying that the risk factor is least at Enyigba site than Ikwo and Control sites respectively (Table 3). T-test (8201.728) and significant value (P = 0.000), which is less than 0.05 level of significance (P< 0.05) implies that the mean concentration of Carbonate across the sites were significantly different from WHO/FAO Standards (appendix). However, the mean concentration of level of Carbonate in all the sites was lower than WHO/FAO (200 mg/l) and NESREA (150 mg/l) standard respectively (Fig 14).
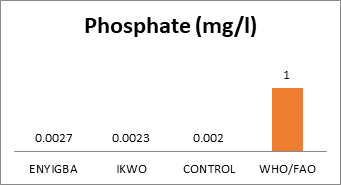
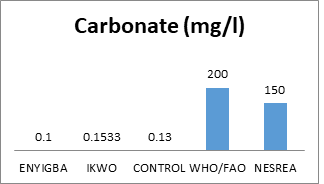
Fig. 13 Fig. 14
Fig 13 Mean Concentration of Phosphate in Water Sources – Wet Season. Fig 14 Mean Concentration of Carbonate in Water – Wet Season
CONCLUSIONS
The physicochemical properties of water sources in the study area are with the WHO/FAO and NESREA standard. Except for the EC in Ikwo Mining District which was below the WHO standard, the Enyigba Mining District was higher than the WHO standard of 400 while Control EC was very high than the WHO standard. The pH in all the Mining Districts and control had low pH indicating acidity of the study area. Cations such as of Na, K, Ca, Mg and Anions Nitrate, Sulphate, Phosphate and Carbonate are within permissible limit with no toxicity problem. The implications of these results only EC has effects on the quality of water sources at Eyingba pose health risks which require mitigation measures during the rainy season whereas the rest physicochemical parameters do not pose health risks.
ACKNOWLEDGEMENTS
This work is an extract of PhD thesis of Mr. Cornell Ejere supervised by Professor G. J. Udom and Dr. R. U. Ideozu titled ‘Environmental Effects of Artisanal Mining of Lead – Zinc in Parts of Ebonyi State, Nigeria.
REFERENCE
- Alor, G.O., Obasi, N. A., Chukwu, K. E., & Agu, A. N. (2016). Effects of lead-zinc mining activities on water and soil quality in Ameka mining area of Ezza South, Ebonyi State, Nigeria. International Research Journal of Natural and Applied Sciences, 3(7), 194-222.
- Aremu, Matthew & Olaofe, Olorunfemi & Ikokoh, P. Pius & Yakubu, M. (2011). Physico–chemical characteristics of stream, well and borehole water sources in Eggon, Nasarawa State, Nigeria. Journal of Chemical Society of Nigeria 0795-2066. Volume 36. Page 130-137.
- Anyahara, J. N., Nwosu, O. U., Awuchi, C. G., & Obinna, U. D. (2021). The Impact of Zinc and Lead Mining on Air Quality at Agalagu Alike in Ikwo LGA of Ebonyi State. International Journal of Advanced Academic Research.
- Chukwu A, Obiora SC. Whole-rock geochemistry of basic and intermediate intrusive rocks in the Ishiagu area; further evidence of an organic setting of the lower Benue rift, southeastern Nigeria. Turkish journal of Earth Science, 2014.23:427-443.
- Ezeribe Al, et al (2012) Physico-chemical properties of well water samples from some villages in Nigeria with cases of stained and mottle teeth. Sci World J 7(1); 1-13
- Eyankware, M. O., Nwankwo, N. P., & Ogwah, C. (2020). Impact of past mining activities on water resources around active and abandoned mines and quarries in Ebonyi State, South-Eastern Nigeria-A mini review. Hydro Science & Marine Engineering, 2(2).
- Eyankware, M. O., & Obasi, P. N. (2021). A holistic review of heavy metals in water and soil in Ebonyi SE, Nigeria; with emphasis on its effects on human, plants and aquatic organisms. World News of Natural Sciences, 38, 1-19.
- Hoque, M. Petrographic differentiation of tectonically controlled Cretaceous sedimentary cycles, southern Nigeria. Sedimentary Geology, 1977.17:235-245
- Meride, Y., Ayenew, B. Drinking water quality assessment and its effects on Residents health in Wondo genet campus, Ethiopia. Environ Syst Res 5, 1 (2016). https://doi.org/10.1186/s40068-016-0053-6
- Murat RC. Stratigraphy and paleogeography of the cretaceous and lower Tertiary in Southern Nigeria. In proc. Of the Conf. on African Geology held at Ibadan, Nigeria. 1972. Pp.251-266.
- Offodile, M. E. (2014). Hydrogeology: Ground Water Study and Development in Nigeria. Third Edition. Mecon Geology & Engineering Services Ltd. Jos, Nigeria. ISBN: 978-30956-4-1.
- Oyem, Hector., Oyem, Ifeanyi & Ezeweali, D. (2014). Temperature, pH, Electrical Conductivity, Total Dissolved Solids and Chemical Oxygen Demand of Groundwater in Boji-BojiAgbor/Owa Area and Immediate Suburbs. Research Journal of Environmental Sciences. 8. 444-450. 10.3923/rjes.2014.444.450.
- Reyment RA, (1965) Aspect of the Geology of Nigeria: The Stratigraphy of the Cretaceous and Cenozoic Deposits. Ibadan University press.
- Sasikaran S et al (2012) Physical, chemical and microbial analysis of bottled drinking water. J Ceylon Medical 57(3):111–116
- WHO, 2010. Guideline for Drinking Water Quality. 3rd, World Health Organization, Geneva, Switzerland.
- World Health Organization (1997) Basic Environmental Health, Geneva.
- Wright, J.B. (1989). Review of the Origin and Evolution of the Benue Trough in Nigeria. In Kogbe C.A. (Eds), Geology of Nigeria (pp359-364). Rock View International.