
Potential Impacts of Flooding on Alluvial Gold Mining Activities in Parts of Ilesha-Egbe Gold Field, Osun State, Nigeria.
- Christopher, O. A.
- 1 Obimba, H. O.
- Benibo, I.T.
- 1Abegunde, L. O.
- 186-193
- Dec 25, 2023
- Agriculture
Potential Impacts of Flooding on Alluvial Gold Mining Activities in Parts of Ilesha-Egbe Gold Field, Osun State, Nigeria.
*1Christopher, O. A., 1 Obimba, H. O., 2Benibo, I.T., 1Abegunde, L. O.
1COPINE/NASRDA, Obafemi Awolowo University (OAU) Campus, Ile-Ife, Osun State,
2National Center for Remote Sensing, Rizek, Jos, Plateau State, Nigeria.
*Corresponding Author
DOI: https://doi.org/10.51584/IJRIAS.2023.81116
Received: 08 November 2023; Revised: 20 November 2023; Accepted: 21 November 2023; Published: 25 December 2023
ABSTRACT
The study mapped mining communities in parts of Ilesha-Egbe gold field in Osun State, South-West (SW) Nigeria, with their respective mining sites, their elevation above sea level and the average depth of mining pits in meters. This was done with a view to determining the potential impacts of flooding on mining activities in these areas. Geological map from Nigeria Geological Survey Agency (NGSA), Advanced Space borne Thermal Emission and Reflection Radiometer- Global Digital Elevation Model (ASTER-GDEM) from Global Land Cover Facility (GLCF) and topographic map from Office of the Surveyor General of the Federation (OSGOF) in Nigeria were used for this study. Geology and topographic maps were interpreted for drainage channels and rivers. These and other information were incorporated in mapping and interpreting the mine localities with their respective characteristics. ASTER-DEM was used to generate elevation information like DEM and slope. Stream ordering was done for the digitized drainages and buffering analysis was done for the respective mining points to determine how the mines will be affected in the event of a flood. Results indicate that the study area is well drained with abundant alluvial gold deposit with mines lying on drainage channel. In the events of flood, mine pit will be filled or partially filled with water and areas with pay-streaks easily flooded. Water runs down slope rather than infiltrates and run-off causes flooding at the lower courses of the water body and this provides for gold dust recharge downstream, opening up new gold exploitation areas.
Keywords: Alluvial, Drainage channels, Topographic map, Stream ordering, Buffering analysis, Pay-streaks.
INTRODUCTION
Nigeria has a long, but discontinuous history of mining and the country was a prominent exporter of tin, columbite and coal. Traces of gold have been found in every area underlain by the Basement Complex and mining on a small scale has taken place in many areas. Probably 90% of Nigeria’s total gold production has been from alluvial deposits derived from primary gold mineralization in the basement complex (Obaje, 2009). All the gold producing areas have been in the western part of the basement where the schist belt is best developed. Four gold fields can be outlined for Nigeria, Ilesha-Egbe, Minna-Birnin Gwari, Sokoto and Yelwa (Woakes and Bafor, 1983).
Flooding is a natural process where rivers and other watercourses regularly exceed their capacity and spill out onto their floodplains (Chartered Institution for Water and Environmental Management, CIWEM, 2014). Gold is a major natural resource and its economic importance cannot be overemphasized. The potential impact of flooding on gold mining is limited to the locality around the mines as this small scale mines are generally not deep and majorly related to riverine alluvial deposits. Some illegal artisanal gold mining activities usually use inappropriate techniques or mining procedures and are not subjected to the standard health, safety and environment guidelines. Alluvial or river gold mining involves panning operations which includes the digging up of river channels, paleochannels, river banks and their floodplains as well as surface trenching. Sometimes it also involves the removal of the overburden layer to expose the gold bearing horizons as gold is panned over the area. Gold panning is dependent on the flow of water along the river channels and the entire gold mining process can be affected by flooding.
The broad aim of this work is to study the impacts of flooding on alluvial gold mining in Ilesha and environs. Also research will seek to provide information on the location of the mining communities, mapping the respective mining sites in the community with their elevation above sea level and depth of mining pit. Also examine the effects of flooding on mining activities along the water body and try to determine the most vulnerable mine site in the event of flooding.
The study area lies majorly in the Ilesha gold mining area of Osun State, which is part of the Ilesha-Egbe gold field, southwestern Nigeria. It consists majorly of four (LGA’s), that is; Atakunmosa East, Atakunmosa West, Ilesha East and Ilesha West, which is bordered by several other LGAs in Osun State. This lies between longitudes 40 30′ 30”E and 40 53′ 0”E and latitudes 70 13′ 0”N and 70 43′ 0”N (figure 1). Geologically, the study falls within the Ifewara area of southwestern Nigeria schist belts, which constitutes part of the Nigerian Basement Complex (Rahaman, 1988).
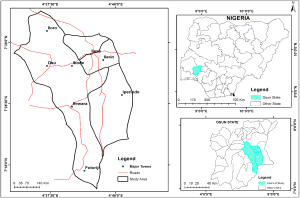
Figure 1: Study area showing major town as part of Ilesha-Egbe gold mining area of Osun State.
METHODOLOGY
Several data were used for this work, this includes: ASTER GDEM, 30 m (1 arc) spatial, Geology map, 1:250,000 and topographic map, 1:50,000. Field mapping was done in the study area to get the precise location of mining communities and their respective mining sites with their elevation and average depth in meters (table 1). This information was imputed into a database taking into cognizance the geology of the study area. Settlement, road, drainage and contour data were digitized from the topographic map and high resolution image of the area. ASTER DEM was also clipped for the study area in a GIS environment and these and other information were imputed into the database. Several maps were generated from the database such as: the buffered map of the respective location of the mine sites, drainage network map, Digital Elevation Model (DEM) map, rivers and stream network with their respective stream order and slope map. All these were subjected to analysis to interpret the effects of flooding on gold mining activities in the study area.
RESULTS
Rivers/Drainage Network and Mine Location
The result showed that Ilesha-Egbe gold field is drained by Osun River, which is part of Osun River Basin. Upper part of the basin originate from Ogbomosho, Offa and the Ilesha Hills. Study area is well drained with several rivers and drainage channels (figure 2). Thirty Seven (37) mining sites in ten (10) different communities was studied with all the required information taken (table 1). The selected communities are not the only settlements where gold is found but areas, which is less hostile and welcoming for ground truthing.
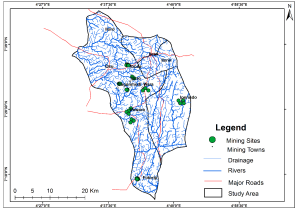
Figure 2: Rivers/drainage network and mine location.
Table 1: Mining communities with their respective mine sites.
| Mining Communities | Number of Mining Sites | (X) Longitude | (Y) Latitude | (Z) Elevation in Metres | Average Depth of Mine Pit in Metres |
| Ibodi | 1 | 684750 | 839837 | 363 | 3.0 |
| 2 | 684742 | 839986 | 350 | ||
| 3 | 684876 | 839944 | 354 | ||
| 4 | 684893 | 839768 | 351 | ||
| 5 | 684608 | 839750 | 360 | ||
| Itagunmodi | 1 | 682591 | 834263 | 366 | 3.2 |
| 2 | 682429 | 834209 | 356 | ||
| 3 | 682528 | 834111 | 344 | ||
| 4 | 682831 | 834188 | 356 | ||
| Igun | 1 | 684871 | 832470 | 309 | 3.4 |
| 2 | 684962 | 832444 | 303 | ||
| 3 | 684943 | 832321 | 307 | ||
| 4 | 684677 | 832436 | 305 | ||
| Epe | 1 | 685131 | 839759 | 375 | 2.9 |
| 2 | 685274 | 839782 | 380 | ||
| 3 | 685216 | 839643 | 397 | ||
| Iyemogun | 1 | 686961 | 835816 | 386 | 2.3 |
| 2 | 686321 | 836332 | 390 | ||
| Iwara Odo | 1 | 690236 | 832908 | 375 | 2.5 |
| 2 | 689524 | 832207 | 356 | ||
| 3 | 691118 | 832213 | 345 | ||
| Faforiji | 1 | 688031 | 806011 | 246 | 2.7 |
| 2 | 687746 | 805988 | 250 | ||
| 3 | 688201 | 805801 | 234 | ||
| 4 | 688024 | 805689 | 278 | ||
| 5 | 687846 | 805744 | 250 | ||
| Ifewara | 1 | 685359 | 826185 | 347 | 2.4 |
| 2 | 684700 | 825813 | 340 | ||
| 3 | 685360 | 825230 | 329 | ||
| 4 | 686012 | 826844 | 350 | ||
| Iperindo | 1 | 701393 | 829287 | 308 | 1.5 |
| 2 | 701582 | 828445 | 306 | ||
| 3 | 700558 | 828441 | 308 | ||
| 4 | 700043 | 829245 | 305 | ||
| Atorin | 1 | 686228 | 823594 | 361 | 2.1 |
| 2 | 685903 | 822667 | 370 | ||
| 3 | 686852 | 823184 | 370 | ||
| Total | 37 |
Digital Elevation Model (DEM)
DEM gives the topographic surface expression of an area. DEM data for this study is displayed in Triangulated Irregular Network (TIN) which is not completely continuous. The mining points in study area have elevations above sea level ranging between 234 and 397 while the general elevation in the four Local Government Areas (LGA) is between 178 and 653 (table 1, figure 3). DEM can be used to simulate flood inundation and therefore to interpret the effect of the flood on the mines.
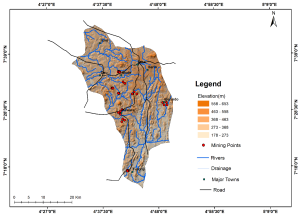
Figure 3: Digital elevation model.
Stream Order
Stream ordering of the areas around the mines indicates that most of the water bodies fall between stream orders 1 and 2. Also very few mines are closer to bigger water body of stream order 3 and 4 with higher discharge. Dominant stream 1 and 2 also indicates a high gradient of flow of water around most of the mines.
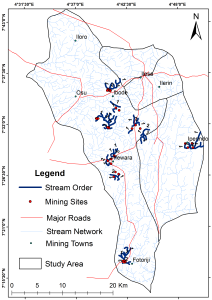
Figure 4: Stream ordering
Buffering
A buffer defines an area within a specified distance around a feature. The mine pits are located along the path of debris flow (figure 5). This has a severe temporary impact on gold production. It could also buffer the immediate effects on downstream as stream power decreases with increasing distance from the headwaters.
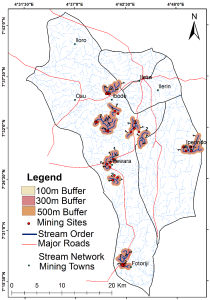
Fig 5: Buffering map
Slope
Slope is the relationship of vertical rise to horizontal run, expressed as a percentage or degree from the “toe” to “top” of a slope, Lehigh Valley Planning Commission (2008). The study area generally has steep slopes (figure 6). This indicates that in the events of flood, water will run down the slope rather than infiltrates. This downstream runoff can also cause flooding at the lower course, this will provide for gold dust recharge to areas downstream along the watercourse.
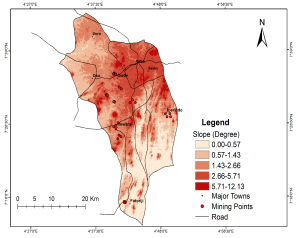
Figure 6: Steep slope.
DISCUSSION OF FINDINGS
The study area has abundant gold. Among the mining sites captured, Ibodi and Faforiji have the highest number of mining sites while Iyemogun settlement has the lowest mining site locations. DEM along the mines indicate that the mining is done along the high lying water bodies and therefore mines that are on the drainage or river channels like in most part of the study area are very likely to be affected by flood events. As gold is eroded from its original lode, gravity, wind, water and the other forces of nature moves it away and downwards until it eventually arrives at a streambed. Any place along the gold path where there is protection from the main flow of water is a good location to sample for gold. Gold is about six times heavier than other material found in the stream bed and tends to follow certain path in the events of flood. It runs mostly from inside bend to inside bend. Another important gold path during flood is when the river flow slows down on a large scale. This is a very common location in gold bearing rivers to find pay-streaks. Pay-streaks are important because they are large deposits as opposed to smaller, single type deposits like what you might find in a bedrock crevice along the general gold path. The comparison between pre and post flood gold concentrations shows that gold content increased up to an order of magnitude after the flood suggesting that this event triggered gold mobilization. Bank erosion and remobilization function as a source of gold during floods. Stream order range from order one to three in the study area. These implies that the mines are susceptible to floods in the events of a heavy rainfall. This can cause massive flows of water to shot down the mines. When this happens, huge amounts of dirt, gravels, rocks, and organic material are pushed downstream. When the flood is over, virgin grounds are exposed, and new sources of gold that were once deeply buried with overburden are now exposed. Buffering indicates that the mine pit is located along the path of debris flow. Areas well drained with abundant alluvial gold deposit with mines lying on drainage channels and in the events of flood, mine pit will be filled or partially filled with water and areas with pay-streaks easily flooded. This causes water to run down slope rather than infiltrates and downstream run off will also causes flooding at the lower river course this enables gold dust recharge to areas downstream along the watercourse.
REFERENCES
- CIWEM, (2014). “Floods and dredging – A reality check”. The blueprint for water. Lehigh Valley Planning Commission, (2008). Steep slopes. Guide/model regulations
- Obaje, N. G., (2009). “Geology and mineral resources of Nigeria”. Springer Dordrecht Heidelberg London New York.
- NASA/METI/AIST/Japan Space systems and US/Japan ASTER Science Team. ASTER Global Digital Elevation Model V003. 2018, distributed by NASA EOSDIS Land Processes DAAC https://doi.org/10.5067/ASTER/ASTGTM
- NGSA, (2006). “Geology and mineral resources of Osun State”. Scale: 1:250,000. Published by the authority of Federal Republic of Nigeria.
- Rahaman, M. A., (1998). “Recent advances in the study of the basement complex of Nigeria”. In: P.O. Oluyide (Ed.), Precambrian Geology of Nigeria. Geological Survey of Nigeria, pp. 11–43.1988.
- OSGOF; “Formally Federal Survey (1964). Topographic map of Nigeria”. Published by the authority of the Federal Republic of Nigeria.
- Woakes, M., Bafor B.E., (1983). “Primary gold mineralization in Nigeria”. In: GOLD ’82: In: Foster R.P. (ed), the geology, geochemistry and genesis of gold deposits. Geological society of Zimbabwe, special publication no. 1. Balkema, Rotterdam.