
Techno-Economic Study of Retrofitting Ammonia Unit to Reduce Carbon Dioxide Emission in a Typical Fertilizer Plant
- Hussaini Nuhu
- I. A. Mohammed-Dabo
- S. I. Dederi, Ismail Musa
- 256-268
- Mar 17, 2024
- Education
Techno-Economic Study of Retrofitting Ammonia Unit to Reduce Carbon Dioxide Emission in a Typical Fertilizer Plant
*Hussaini Nuhu1, I. A. Mohammed-Dabo2, S. I. Dederi, Ismail Musa3
Department of Chemical Engineering, Ahmadu Bello University, Zaria, Nigeria.1,2,3
DOI: https://doi.org/10.51584/IJRIAS.2024.90222
Received: 24 January 2024; Revised: 07 February 2024; Accepted: 12 February 2024; Published: 17 March 2024
ABSTRACT
This research presents a comprehensive techno-economic study of the CO2 removal section of a 3850 MTPD ammonia unit in a typical fertilizer plant. The focus is on retrofitting the CO2 removal section with a flash gas scrubber to capture significant CO2losses to the reformer fuel header and fuel gas. The captured Carbon dioxide is utilized in the downstream Urea Plant, enhancing the heating value of fuel gas and reducing environmental emissions. Aspen Hysys V8.8 was employed for simulation, using Activated Methyl Diethanolamine (AMDEA) as the absorbent. The results indicate a 95% Carbon dioxide absorption with the installed flash gas scrubber. Design parameters, economic evaluations, and savings calculations were carried out using Excel and Aspen Process Economic Analyzer. The payback period for the project is estimated to be 20 and 21 months for undiscounted and discounted scenarios, respectively. AutoCAD was used for the mechanical drawing of the flash gas scrubber.
Keywords: Carbon dioxide (CO2) CO2 Capture Absorbent Flash Gas Scrubber AMDEA Payback Period Aspen Hysys Ammonia Urea
INTRODUCTION
The escalating challenges posed by greenhouse gas emissions have sparked collective concerns among scientists, engineers, and policymakers, propelling an intensified quest for viable solutions. Regulatory measures, aimed at compelling emitters to curtail these emissions, are continually evolving. Among the various strategies being explored for reducing carbon emissions includes; Carbon Capture and Storage (CCS) holds particular promise (Madejski et al., 2022; Fawzy et al., 2020).
Amidst the increasing global momentum to combat climate change, there is a significant emphasis on improving the efficiency of energy conversion processes, transitioning to alternative fuels, and notably, employing carbon capture and storage (CCS) techniques. (Madejski et al., 2022; Fawzy et al., 2020). The need for sustainable agricultural practices and the corresponding rise in fertilizer demand, especially in regions such as Nigeria, where agricultural growth is prioritized for economic diversification, underscores the relevance of this study.
This research project centers on a critical facet of the fertilizer production process – the ammonia unit. Ammonia, a key industrial chemical globally, is essential for agricultural activities. The production of ammonia involves the chemical synthesis of nitrogen and hydrogen, where a 3:1 mole ratio is required (Hadi et al., 2010). Natural gas serves as a primary source for hydrogen, and depending on its composition, carbon dioxide (CO2) can be a byproduct of the reforming process. Excess CO2 can negatively impact the heating value of the fuel gas, as well as pose environmental concerns (Rufford et al., 2012).
The importance of addressing CO2 emissions in ammonia production has led to the incorporation of carbon dioxide removal sections in typical ammonia plants. Among various methods is the chemisorption process using amine solutions, particularly Paparazine-Activated Methyl-Diethanolamine (MDEA), had emerged as a cost-effective and operationally efficient means of CO2 removal (Jeong et al., 2022). This study specifically focuses on enhancing CO2 removal efficiency through the installation of a flash gas scrubber in the ammonia unit of a conventional fertilizer plant using: Aspen Hysys V8.8 for the simulation processes, utilizing Activated Methyl Diethanolamine (AMDEA) as the absorbent.
This paper explores the techno-economic evaluation of implementing a flash gas scrubber, including simulation outcomes, design specifications, and economic feasibility. By conducting material and economic analyses, it quantifies the potential advantages such as CO2 capture, natural gas conservation, and financial returns. Additionally, sensitivity analysis is utilized to assess the resilience of the proposed retrofit under various economic conditions, encompassing fluctuations in urea and natural gas prices, along with changes in the discount rate. The findings of this study offer valuable insights into the technical and economic viability of integrating flash gas scrubbers into ammonia production processes, highlighting their pivotal role in achieving sustainable and environmentally conscious industrial practices.
MATERIALS AND METHODS
Materials
The following materials and equipment were employed in this research work:
- Aspen Hysys Software (V8.8)
- DFL Process flow diagram (Generated from Aspen Hysys)
- Microsoft Excel (2016)
- AutoCAD 2015 (V19.1)
For this project, we will be considering a very lean feed composition of natural gas (NG) to a typical ammonia plant. Since ammonia production is only dependent of H2 and N2 which are in turn dependent on the flow of natural gas (NG), the flow of the lean natural gas (NG) to produce equivalent amount of N2 and H2 require to produce 2200 MTPD of ammonia will be determined. The next step will be to simulate typical CO2 absorption process for the ammonia synthesis gas to determine the amount of CO2 present in the flash gases. The process will be modified by adding a flash gas scrubber to recover the CO2. Aspen Hysys will be used to obtain an equipment design for the flash gas scrubber.
In order to generate economic data for this project, the aspen Hysys project cost evaluator will be used to estimate the capital cost of installing flash gas scrubber, then using typical prices of natural gas (NG) and urea in Nigeria, the profitability of this project will be determined. Furthermore, the sensitivity analysis of the profitability to varying economic factors such as prices of natural gas (NG), urea and discount rate will be evaluated.
Process description of Carbon Dioxide removal
The process gas from reforming section after going through a series of heat exchanges will be fed to the separator at a temperature of 65OC, at this condition most of the steam in the process gas have condensed and then separated out before the gases fed to the bottom of the CO2 absorber. The absorption take place at a relatively low temperature and high pressure to the regenerator. Activated Methyl Diethanol Amine (AMDEA) solution is used as absorbent. By virtue of countercurrent flow between the process gas and the amine solution, CO2 from the process gas is transferred to the absorbent. The composition of the amine solution is 60wt% water, 39.5wt% methyl Diethanolamine MDEA, and 0.5wt% Piperazine. The untreated process gas is fed to the bottom of the absorber at 65OC and 33kg/cm2, the amine solution is fed at two stages; the first stage as lean amine at 50OC and 35kg/cm2and second stage as semi lean amine at 75OC and 35kg/cm2to prevent carryover of amine with the treated process gas, wash water is fed at the top of the absorber at 90OC and 35kg/cm2. The absorber is designed with 23 stages with a differential pressure (DP) of 0.2kg/cm2. The top pressure is 32.70kg/cm2while the bottom pressure is 32.90kg/cm2. The lean amine is fed at the second stage and semi lean amine is fed at the 10th stage. The rich amine leaving the bottom of the absorber at 82.98OC and 32.90kg/cm2is let down through an expansion valve to 6.3kg/cm2. Due to this pressure reduction, some of the dissolved gases in the amine solution flashes out in the flash drum. The rich amine is now sent to the regenerator where CO2 is separator from the amine solution at high temperature and low pressure. The process is as describe in Figure 1.
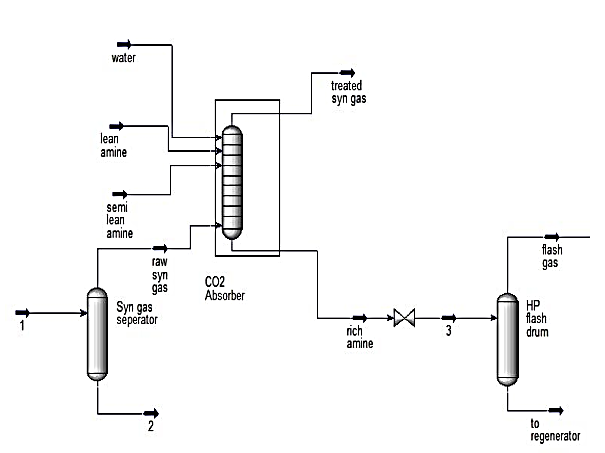
Figure 1: Simulated CO2 removal section of an ammonia plant
Legends;
- Process gas
- Condensate
- Rich Amine
Since the amount of CO2 produced from the regenerator won’t be sufficient for synthesis with ammonia for urea production, it is necessary to recover as much CO2 as possible from the flash gas. To achieve this, the flash gas leaving the flash drum is sent to the bottom of another absorber where it is scrubbed with a small flow of lean amine entering the top at 50OC and 35kg/cm2. The scrubber is designed with 10 stages and DP of 0.1 kg/cm2, the top pressure is 6.2kg/cm2 and bottom pressure of 6.3kg/cm2 as illustrated in Figure 2.
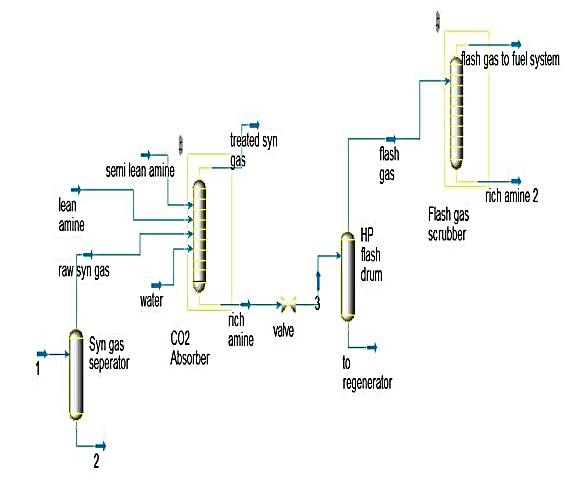
Figure 2: Simulated CO2 removal section with flash gas scrubber
Material Balance Results for Rich Natural Gas (NG)
Table 1 displays the composition of natural gas used as the basis in developing the PFD required for determining the flow of natural gas required to produce amount of H2 that will generate 2200 MTPD of ammonia. The composition of the process air which is the source of N2 into the process is represented in Table 2;
Table 1: Composition of Rich Natural Nas (Rich NG)
| Component | Mole fractions |
| Methane | 0.8665 |
| Ethane | 0.0553 |
| Propane | 0.0154 |
| Butane | 0.0063 |
| Pentane | 0.0017 |
| Hexane | 0.0012 |
| Heptane | 0.0011 |
| Nitrogen | 0.0019 |
| Carbon dioxide | 0.0506 |
Source: Dangote fertilizer limited, 2016
RESULTS AND DISCUSSION
Carbon Dioxide Absorber and Flash Drum
After the flowrate of lean NG required to produce 2200 MTPD of NH3 has been determined, the corresponding flow rate and composition of synthesis gas going to the CO2 absorber is generated as shown in Table 2.
Table 2: Composition of Raw SynthesisGas
| Mole Fractions | |
| Component | Raw syn gas |
| Methane | 0.0035 |
| Carbon Monoxide | 0.0033 |
| Carbon Dioxide | 0.1758 |
| Argon | 0.0024 |
| Hydrogen | 0.6079 |
| Nitrogen | 0.1986 |
| Water | 0.0085 |
(Aspen HYSYS V8.8)
Comparing the composition of raw synthesis gas fed to the bottom of CO2 absorber and the treated gas living the top of the absorber, it can be observed that bulk of the CO2 present in the synthesis gas has been transferred to the amine solution. In addition to transfer of CO2, other components such as methane, H2, N2 were also dissolved in the amine solution. These other components represent impurities in the urea production plant. Therefore, in order to reduce the level of impurities in CO2 which will be sent to urea plant, the rich amine solution will be flashed at lower pressure. The composition of the flash gas which was released is shown in Table 3.
Table 3: Composition of Treated SynthesisGas
| Component | Treated syn gas |
| Methane | 0.0043 |
| Carbon Monoxide | 0.0040 |
| Carbon Dioxide | 0.0010 |
| Argon | 0.0005 |
| Hydrogen | 0.7429 |
| Nitrogen | 0.2432 |
| Water | 0.0041 |
(Aspen HYSYS V8.8)
From Table 3, it shows that the composition of syn gas which comprise of mainly H2 and N2 has beenincrease from 60% for H2 to 74% and from 20% to 24% for N2as compare to table 2 for raw syn gasThis is due bulk of the CO2 has beentransferred to the amine which absorbed the CO2 and other impurities.
Flash gas scrubber
In order to recover CO2 from the flash gas, a scrubber will be provided through which the flash gas will run counter currently with a small flow of lean amine solution to remove CO2 from theflash gas before it’s sent to primary reformer as fuel. The result of the simulation is displayed in Table 4.
Table 4: Composition of Flash Gas
| Mole fractions | ||
| Component | Flash gas | Flash gas to reformer fuel |
| Methane | 0.0086 | 0.0103 |
| CO | 0.0032 | 0.0038 |
| CO2 | 0.1115 | 0.0010 |
| Argon | 0.0043 | 0.0011 |
| Hydrogen | 0.6347 | 0.7642 |
| Nitrogen | 0.1683 | 0.2028 |
| H2O | 0.0694 | 0.0167 |
| Total | 1.00 | 1.00 |
(Aspen Hysys V8.8)
From Table 4, it shows that the composition of the flash gas, CO2 being the concern gas has been drastically decreased from 11% to 1%, also H2 which is the main fuel to the reformer fuel gas has been increase from 63% to 76%. This is due to the ability to remove CO2 from the reformer fuel gas thereby increasing the heating value of the fuel.
In order to justify the essence of the recovery, the mass flow rate of CO2in flash gas and rich amine were calculated and presented in Table 5.
Table 5: Material Balance forCarbon Dioxide Flowrate
| Stream | Mass flow of CO2 (kg/hr) | Molar flow of CO2 (kgmole/hr) |
| Flash gas | 148.5556 | 3.2846 |
| Rich amine 2 | 143.4483 | 3.2595 |
Flash Gas Scrubber Design
Table 6 shows the design parameters of the flash gas scrubber that were generated fromrunning the equipment design in the Aspen Hysys simulator as well as calculation empirically.
Table 6: Results of Flash Gas Scrubber Equipment Design
| Column Details | Simulation | Empirical Calculation |
| Number of Stages | 10 | 9 |
| Internals | Packed | Packed |
| Packed type | Intalox Metallic Tower Packing (IMTP) |
Saddles Intalox |
| Packing material | Stainless steel Metal | Stainless steel Metal |
| Packing dimension | 20 | 25 |
| Section diameter (m) | 0.3671 | 0.438 |
| X-Sectional Area (m2) | 0.0349 | 0.0288 |
| Section height (m) | 5 | 4 |
| HETP (m) | 0.5 | 0.5373 |
| Max flooding (%) | 75 | 80 |
| Section deltaP (kPa/m) | 678.98 | 1010.67 |
From Table 5, it shows the flash gas scrubber design result. This implies that the scrubber will have 10 stages with IMTP packing type and stainless-steel metal. The section diameter and cross sectional were found to be 0.367m and 0.0349 m2respectively. The variation of the cross sectional area between the simulation and empirical calculation was as a result of the choice of packingtypes which are almost similar. As reported by Sinnot (2005), this is in conformity with gas scrubbers having less than 20 number stages. The HETP was calculated to 0.5373, which is in agreement with the simulation result as reported by Sinnot (2005)
Economic Analysis
After establishing feasibility of designing the flash gas scrubber, the next step is to now determine the economic feasibility of installing this unit in the CO2 removal section of an ammonia plant. After following the procedure which was describe by Sinnot (2005) for estimating the capital cost of installing the flash gas scrubber, the values representing the cost component of this project capital cost were generated as displayed on Table 7.
Table 7: Cost Component of Flash Gas Scrubber
| PROJECT CAPITAL SUMMARY | Cost (USD) |
| Purchased Equipment | 94100 |
| Equipment Setting | 1800 |
| Piping | 75000 |
| Civil | 12000 |
| Instrumentation | 160500 |
| Electrical | 83200 |
| Insulation | 23100 |
| Paint | 5700 |
| Other | 472000 |
| G and A Overheads | 19800 |
| Contract Fee | 71800 |
| Contingencies | 244500 |
| Total Project Cost ($) | 1.26E+06 |
(Aspen process Economic Analyzer)
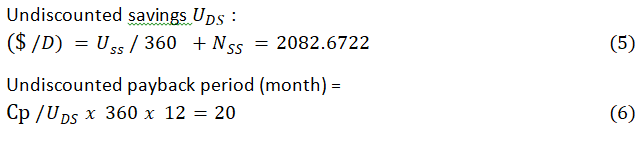
The total capital cost of installing the flash gas scrubber was estimated as $1.26e06. How quickly this investment can be recovered will determine how economically feasible this project will be. the feasibility of the project is determined by the payback period. The calculation is as follows:
- The cost of a bag of urea(50kg) = N9000 (Indorama fertilizer, 2019)
- Price of pipeline NG in Nigeria= N 2967/MSCFD (Nigerian gas company,2018)
- Annual discount rate = 5% (Sinnott, 2005)
- Income tax = negligible (Sinnott, 2005)
The following results were generated
Discounted payback period, DPB (month) =![]() (7)
(7)
Cp= Capital cost of projects
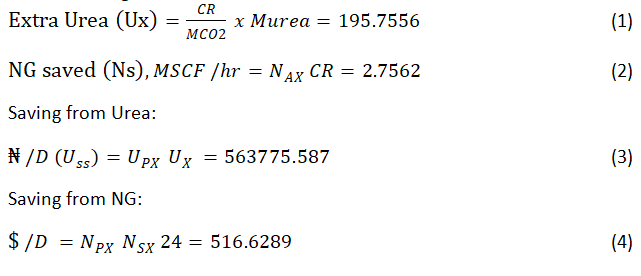
CR= Recovered of CO2
MCO2= Molecular weight of CO2
Up= price of urea (₦/D)
Np= price of NG ($7.81/MSCF)
Ux= Extra Urea
From Table 7, capital cost was calculated from Aspen Hysys economic analyser. The outcome of the economic analysis has shown that it will take between 20 to 21 months to recover the capital cost. This is in agreement with Chikezie (2018) result which shows that a scrubber payback period should be between 18 to 36 months. Considering the economic life of the flash gas scrubber to be between 10 to 15 years, this recovery time makes this project very feasible economically.
SENSITIVITY ANALYSIS
In order to justify the number of stages in the column and the amount CO2 capture and amine flow, the sensitivity analysis was used by varying the parameters. Furthermore, theprofitability of this project is dependent on several factors including the capital cost, price off product, price of raw material, discount rate etc. by varying some of these factors, the trend between the factors and the payback period was generated, which gave an insight that helped to determine at what point this project will not be feasible economically. In this study, the prices of urea product and NG was varied to see the effect on both discounted and undiscounted payback period. In addition, the discount rate was also be varied.
Number of stages
The amount of CO2 capture depends on the number of stages, increasing the number of stages means more amount of CO2 will be capture. But a limit is reach where an increase in the number of stages will only lead to an increase in capital cost as there is no significant increase in CO2 capture.
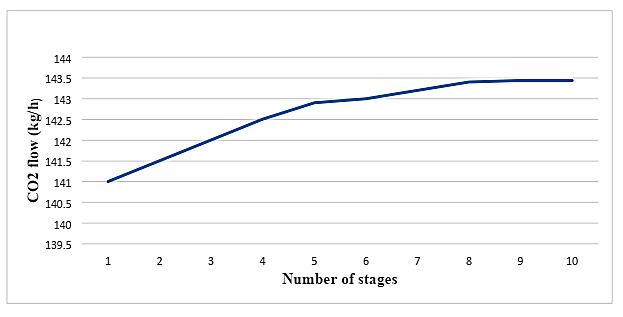
Figure 3: CO2 flow (kg/h) vs. Number of stages
From Figure 3, it shows that increasing the number of stages means more amount of CO2 will be captured. But a limit is reach where an increase in the number of stages will only lead to an increase in capital cost as there is no significant increase in CO2 capture. This limit leads to the selection of number of stages to be 10.
Price of urea
Urea, which is a nitrogenous fertilizer is the final product of the plant, therefore, the profitability of any investment will be affected by the price of the urea product. As the agricultural sector of the country grows that is projected that demand of fertilizer will increase. By considering the force of supply and demand, it can be projected that increase in demand might lead to increase in price. Figure 4illustrate how varying the price of the bag of a urea affect theundiscounted and discounted payback period respectively for this project.
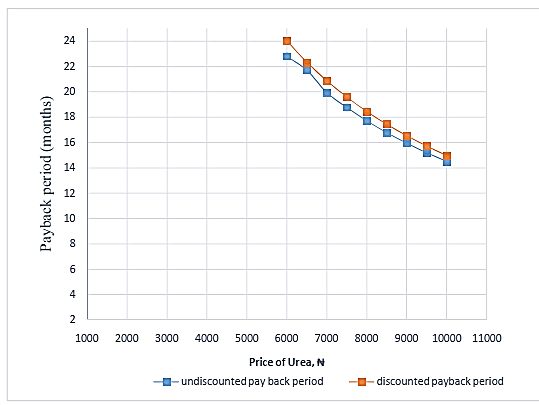
Figure 4: Price of urea vs. discounted and discounted payback period
From Figure 4, it shows that as the price of urea increases, both discounted and undiscounted payback period decreases. This is due to the fact that there is an increase in amount of money generated by high price of urea.
Price of natural gas, NG
NG is the raw material for the production of ammonia and CO2, which are then used for urea synthesis. For every unit mass of CO2 produced from the reforming section of the nh3 plant, an estimated quantity of NG is required. This means that, for every mass of CO2 that’s been recovered corresponding amount of NG will be saved, as a result, the price of ng has a direct impact on the profitability of this project. Figure 5 illustrate how changes in the price of NG affects the undiscounted and discounted payback period respectively
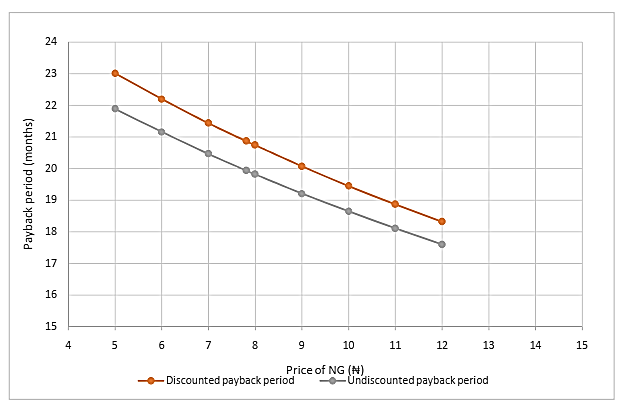
Figure 5: Price of NG vs. undiscounted and discounted Payback period
Figure 5 shows the graphical representation of the variation of price of NG with both discounted andundiscounted payback period. As the price of NG increases, both the discounted and undiscountedpayback period will decrease, this is due to the high amount cash inflow in to the system.
Discount rate
The time value of money is very important when carrying out economic analysis of any project. The future of the currency or commodity might rise but the safe to assume future reduction of value of money. The discount rate is percentage which is used for converting future cash flows of a business to its present value. By varying the discounted rate, it’s expected that the discounted payback period should increase with decreasing discount rate value. Figure 6 illustrate how the discount rateaffects the discounted payback period. It shows that as the discount rate increases, the payback will increase; this is due to the decrease in the inflow of cash to the system as calculated from equation 7.
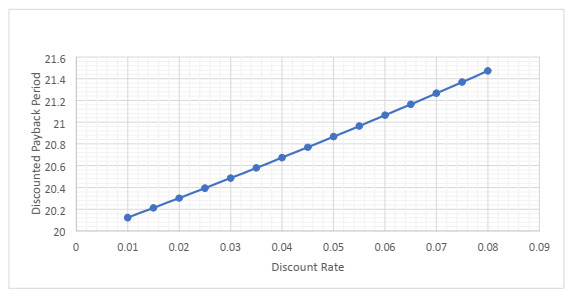
Figure 6: Discount rate vs. Discounted Payback period
CONCLUSION
Conclusions
After completion of this research work, the following conclusions were deducted:
- Simulation of the existing CO2 removal section of an ammonia plant was successfully carried out using Aspen Hysys V8.8.
- Similarly, simulation of the modified CO2 removal section of an ammonia plant was successfully carried out using Aspen Hysys V8.8.
- The addition of flash gas scrubber recovers CO2 to a value of 143 kg/hr. This recovery has translated to an additional 4.694MTPD of Urea (93 bags/day) that has been calculated to be gotten from the recovered CO2.
- Design of the flash gas absorber for CO2 absorption in the CO2 removal Unit of an ammonia plant was also carried out with an intalox metallic packing as the packing type. The number of stages were calculated to be 10 stages with a height equivalent to theoretical plate (HETP) of 0.5345. Also, section diameter, section height, and maximum flooding were found to be 0.4m, 5m, and 80% respectively. The installed flash scrubber simulation showed a captured efficiency of90%.
- Economic analysis was carried out with approximately 20 – 21months payback period to break even with a life Span of around 15-20 years. Sensitivity analysis was also carried out for both technical and economic aspect to vary certain parameters such as CO2 flow, Price of NG, Price of Urea etc.
After the completion of this research work, the following conclusions were drawn:
- The simulation of the existing CO2 removal section of an ammonia plant was successfully executed using Aspen Hysys V8.8.
- Similarly, the simulation of the modified CO2 removal section of an ammonia plant was successfully conducted using Aspen Hysys V8.8.
- The incorporation of a flash gas scrubber proved effective in recovering CO2 at a rate of 143 kg/hr. This recovery translates to an additional 4.694 MTPD of Urea production (equivalent to 93 bags/day), calculated based on the reclaimed CO2.
- The design of the flash gas absorber for CO2 absorption in the CO2 removal unit of an ammonia plant was meticulously carried out, employing intalox metallic packing. The analysis determined 10 stages with a height equivalent to the theoretical plate (HETP) of 0.5345. Additionally, section diameter, section height, and maximum flooding were established at 0.4m, 5m, and 80%, respectively. The simulation of the installed flash scrubber demonstrated a capture efficiency of 90%.
- Economic analysis revealed an approximate payback period of 20–21 months to break even, with a projected lifespan ranging from 15 to 20 years. Sensitivity analysis was performed on both technical and economic aspects, allowing for the variation of parameters such as CO2 flow, the price of natural gas, the price of Urea, etc. This comprehensive analysis enhances the understanding of the project’s robustness and economic viability.
RECOMMENDATIONS
Considering the evolving landscape where natural gas feeds are expected to become leaner due to enhanced recovery of valuable Natural Gas Liquids (NGLs) by gas plants, it is advisable to explore alternative methods for CO2 recovery within the plant.
To optimize the CO2 recovery available as feed to the urea plant, it is strongly recommended to incorporate a flash gas scrubber in the configuration of the CO2 removal section of an ammonia plant. This strategic addition becomes particularly valuable when heavier components are less prevalent in the natural gas feed. The flash gas scrubber proves to be an effective solution for enhancing CO2 capture and contributes to maximizing the overall efficiency of the urea production process. The implementation of such measures aligns with the industry’s trajectory towards sustainability and resource optimization.
REFERENCES
- Chikezie, N. (2018). Techno-economic analysis of CO2 capture from a 1.2 million MTPA cement plant using AMP-MEA blend . International journal of greenhouse gas control. 78(2018). 400-412.
- Daniel, F., Shivom, S., Silvio, O., François, M. (2020). Combined exergy analysis, energy integration and optimization of syngas and ammonia production plants: A cogeneration and syngas purification perspective, Journal of Cleaner Production, Volume 244, 2020, 118647, ISSN 0959-6526, https://doi.org/10.1016/j.jclepro.2019.118647.
- Detlef P. V., Elke, S., David E .H. J. Gernaat, J.C. Doelman, M.B., Mathijs H., Harmen, S. B., Lex F. Bouwman, V. Daioglou, O. Y. Edelenbosch, B. Girod, T. Kram, L. Lassaletta, P. L. Lucas, H. Meijl, C. Müller, B. J.van Ruijven, S. S., Andrzej T. (2017). Energy, land-use and greenhouse gas emissions trajectories under a green growth paradigm, Global Environmental Change, Volume 42, 2017, 237-250, ISSN 0959-3780, https://doi.org/10.1016/j.gloenvcha.2016.05.008.
- Fawzy, S., Osman, A.I., Doran, J. (2020). Strategies for mitigation of climate change: a review. Environ Chem Lett 18, 2069–2094 (2020). https://doi.org/10.1007/s10311-020-01059-w
- Hadi, E., Alireza, B. and Akbar, Z. (2010). Arrangement of primary and secondary reformers for synthesis gas production. Chemical engineering research and design. London: Earthscan 88, 1342–1350.
- Hans, A. H., Nils, H. E., Anne, M. F., Eystein, L. (2017). Commercial capture and transport of CO2 from production of ammonia, 13th International Conference on Greenhouse Gas Control Technologies, GHGT-13, 14-18 November 2016, Lausanne, Switzerland. doi: 10.1016/j.egypro.2017.03.1750 https://doi.org/10.1016/j.petrol.2012.06.016
- Jeong, S.W.; Lee, B.; Kim, S.Y. (2022). The Split Flow Process of CO2 Capture with Aqueous Ammonia Using the eNRTL Model. Processes Journal of Petroleum Science and Engineering, Volumes 94–95, 2012, 123-154, ISSN 0920-4105, 2022, 10, 1839. https://doi.org/10.3390/pr10091839.
- Madejski, P.; Chmiel, K.; Subramanian, N.; Kus, T. (2022). Methods and Techniques for CO2 Capture: Review of Potential Solutions and Applications in Modern Energy Technologies. Energies 2022, 15, 887. https://doi.org/10.3390/en15030887
- Mores, P. L., Godoy, E., Mussati, S. F. & Scenna, N. J. (2014). A NGCC power plant with a CO2 post-combustion capture option, optimal economics for different generation/capture goals. Chemical Engineering Research and Design. 18(2), 151-159. doi:10.1017/s0265051701000249.
- Pan, S. Y., He, K. H., Lin, K. T. (2022). Addressing nitrogenous gases from croplands toward low-emission agriculture. npj Clim Atmos Sci 5, 43. https://doi.org/10.1038/s41612-022-00265-3
- Rufford, T.E., Smart, S., Watson, G.C.Y., Graham, B. F., Boxall, J., Diniz da Costa, J. C., May, E.F. (2012). The removal of CO2 and N2 from natural gas: A review of conventional and emerging process technologies,
- Sinnott, R. K; (2005). Chemical Engineering design. Coulson and Richarson Chemical Engineering, Vol 6, 4 ed.