
Temporal Variability in Rainfall Amount, River Stage and Discharge at Ibi Section of River Benue, Taraba State Nigeria
- Grace Hembadoon Yiyeh
- Maxwell Idoko Ocheri
- Monday Akpegi Onah
- Johnson Orfega Mage
- Patricia Ali
- Odeh Adimanyi
- 115-125
- Aug 30, 2024
- Geography
Temporal Variability in Rainfall Amount, River Stage and Discharge at Ibi Section of River Benue, Taraba State Nigeria
Grace Hembadoon Yiyeh; Maxwell Idoko Ocheri; Monday Akpegi Onah; Johnson Orfega Mage; Patricia Ali; and Odeh Adimanyi
Department of Geography, Benue State University, Makurdi, Nigeria
DOI: https://doi.org/10.51584/IJRIAS.2024.908010
Received: 14 August 2024; Accepted: 22 August 2024; Published: 30 August 2024
ABSTRACT
This study examined the temporal variability in rainfall, river stage, and discharge at the Ibi section of the Benue River in Taraba State, Nigeria, using data covering 1981 to 2020. Daily rainfall data, collected from the Nigerian Meteorological Agency, were aggregated to compute monthly and annual totals, and daily discharge and water levels were obtained from the Nigeria Hydrological Services Agency. The analysis utilized time series methods, including Least Square Regression and Pearson’s Product Moment Correlation, to assess trends and fluctuations. Results of monthly rainfall patterns revealed that the rainy season begins in April, peaks in September, and ends in October, with average monthly rainfall increasing from 65.47 mm in April to a peak of 205.93 mm in September before declining sharply to 111.20 mm in October. Annual rainfall shows a declining trend of 3.1226 mm per year with an R² value of 0.0416 and a correlation coefficient (r) of 0.2039, but this decline is not statistically significant (t = 1.2838 < critical t = 1.684). River discharge peaks in September and October with a maximum of 12,100 m³/s, while the lowest discharge is 554.18 m³/s in January. Annual discharge exhibits a negative trend with a decrease of 31.715 m³/s, and statistical analysis (R² = 0.003, r = 0.0548) indicates the trend is not significant (t = 0.7972 < critical t = 1.70). Conversely, water levels show a significant increasing trend at an annual rate of 3.9985 cm (R² = 0.2039, r = 0.4155, t = 2.8708 > critical t = 1.684), with peak levels reaching 1109.00 cm in September. This increase in water levels despite declining rainfall suggests significant runoff contributions from the Ibi catchment, reflecting a complex interaction between rainfall and river dynamics.
Key Words: Rainfall, River Discharge and Stage, temporal variability, Benue
INTRODUCTION
The availability, management, and use of surface water resources within a basin are largely influenced by rainfall variability on spatial and temporal scales. This variability impacts agricultural production, food and water security, ecosystems, and services. Analyzing the temporal variability of rainfall, river stage (water level) and discharge at different timescales help predict the likelihood of extreme events like droughts or floods and manage water resources, especially for key sectors such as agriculture, hydropower, and domestic water supply (Machiwal, Kumar and Dayal, 2016; Langat, Kumar & Koech, 2017; Nnaji, Okoro & Uwaoma, 2018). At the global level, forecasts have shown that, by 2050, annual average river runoff and water availability will increase at high latitudes and in wet tropical regions due to climate change and variability. In mid-latitudes and dry tropical regions, on the contrary, these indicators will decrease, causing a reduction in the amount of available surface water resources space (Water Scarcity, 2022). This provides evidence to the fact that, among the inevitable consequences of climate change/variability, the most important is its impact on water resources which is the basis of environmental well-being, economic growth, and global security.
In Africa, studies have shown that the total volume of water in the largest basins of the Nile, Niger, Senegal, and Lake Chad has already been reduced by 40 to 60 percent (UNEP and UNFCCC, 2001; Urama, and Ozor, 2010; Gulick, Jaege, Mix, Asahi, Bahlburg et al. 2015; Xia, and Allaramadji, 2017). Micalel and Jonathan (2001) also corroborate this position, reporting that over the past 40 years, the Chari/Logon river system discharge in the N’Djamena city of Chad has decreased by almost 75%, also Lake Chad declined by 40%, which has considerably reduced the supply in the lake. Consequently, many communities in these basins are expected to experience shrinkage in their water supplies as temperatures rise and precipitation patterns shift. A rise in the frequency of heavy rainstorms will increase the volume of water in streams/rivers, even degrade water quality and increase the risk of catastrophic floods as seen in recent times over the Benue basin where Ibi is located. Undoubtedly therefore, rainfall variations occasioned by climate change, coupled with increased anthropogenic pressure on earth–atmosphere interactions, will affect water quantity, quality, and surface water-related processes, such as sediment yield and streamflow and river stage on local, regional, and global scales (Gulick, et al. 2015; Xia and Allaramadji, 2017). This suggests that freshwater ecosystems are particularly threatened by this hydro-climatic variability as increasing water temperatures, decreasing runoff and drying wetlands have resulted in the loss of a significant number of amphibian species or other aquatic species (Xia and Allaramadji, 2017).
In recent years, climatic variable trends and change detection have garnered significant attention from researchers worldwide. These studies often focus on trend analysis of climatic variables such as temperature, precipitation, and water yield across various regions. Da Silva et al. (2015) examined the spatial and temporal variability of rainfall and river flow in the Cobres River Basin in southern Portugal, finding decreasing trends in both rainfall and river flow. In India, Jain and Kumar (2012) reported a decline in rainfall in major river basins, while Machiwal et al. (2016) noted irregular rainfall patterns in the Gujarat region. Ghanem (2010) documented changes in seasonal and annual rainfall in Jordan, whereas Muchuru et al. (2016) identified insignificant positive and negative rainfall trends with coherent oscillatory patterns in Zimbabwe. Longobardi and Villani (2010) analyzed annual and monthly precipitation data from 382 sites in the Campania and Lazio regions of southern Italy over an 81-year period, detecting significant overall changes. Consequently, a thorough understanding and analysis of rainfall and river flow patterns across various time scales are increasingly crucial for effective water resource management, the planning and design of hydraulic structures, agricultural production, and mitigating the adverse effects of floods and droughts.
In Nigeria, previous studies have documented changes in rainfall patterns and river discharge in different parts of Nigeria, highlighting the need for localized research to address specific regional challenges (Okonkwo et al., 2017; Musa, Nde, & Abdullahi, 2021). For instance, Uluocha and Ogbuehi (2016) reported that variability in river discharge can significantly impact agricultural practices and food security. Similarly, studies by Eze and Nwankwo (2022) emphasize the importance of monitoring river stage changes to predict and manage flood risks effectively. The Ibi section of the Benue River in Taraba State, Nigeria, is an area significantly impacted by variable climatic conditions and anthropogenic activities. The Benue River, as one of Nigeria’s major rivers, plays a vital role in supporting agriculture, domestic water supply, and ecosystem health in its basin (Adebayo et al., 2020). The temporal variability of rainfall and river discharge in this region has implications for flood management, water resource planning, and agricultural productivity (Abdullahi, Adamu, & Hassan, 2023; Oguntunde et al., 2019). In recent years, there has been an increasing recognition of the impacts of climate change on hydrological systems, particularly in regions like Nigeria where rainfall patterns are highly variable (Babatunde et al., 2018; Adejuwon, 2020; Chukwu et al., 2021; Ilesanmi, Ojo & Oluwaseun, 2018).). The Ibi section of the Benue River has experienced fluctuations in river stage and discharge, which are critical for managing water resources and mitigating flood risks. Understanding these variations is essential for developing effective strategies to adapt to changing climatic conditions and to ensure sustainable water management practices.
This study aims to provide a detailed analysis of the temporal variability in rainfall amount, river stage, and discharge at the Ibi section of the Benue River. By examining these parameters over time, the study seeks to identify trends and patterns that can inform water resource management strategies and improve resilience to hydrological extremes. The findings are expected to contribute to a better understanding of the hydrological behaviour of the Benue River and support the development of more effective water management policies.
MATERIALS AND METHODS
Study Area
Ibi is a town and administrative district in Taraba State, Nigeria. The town is located on the south bank of the Benue River, opposite the influx of the much smaller Shemankar River. Both the Taraba River and the Donga River flow into the Benue within the LGA. Ibi is located on Latitude 8°19’52.39″ N and Longitude 9°51’39.52″E (Figure 1). The area is situated in Nigeria’s middle belt, characterized by an undulating landscape. Ibi experiences a warm climate with an average daily high of 33°C and distinct rainy and dry seasons, influenced by two major trade winds (Southwest and northeast trade wind). The relative humidity averages 81% in August which is the highest, and ranges between 30- 45% during dry season, especially in March. The region is noted for its grasslands interspersed with trees and shrubs. Human activities in Ibi are centered around fishing, agriculture, and local trade. The town serves as a commercial hub for crops like sesame and soybeans, and is also linked by road to nearby Wukari. Ibi’s settlement pattern includes a diverse population and accommodates various social and economic activities, including markets, educational institutions, and shopping centers.
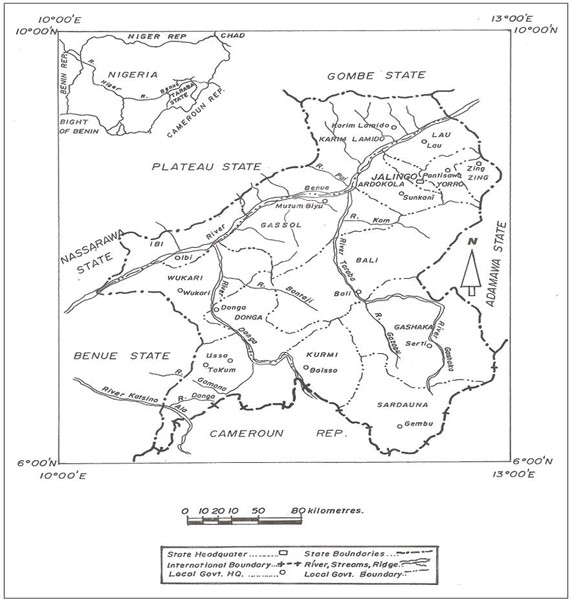
Figure 1: Map of Taraba State Showing Ibi
Data Collection
Data on daily rainfall (0.25 mm or more) for Ibi were acquired from the Nigerian Meteorological Agency (NiMet) Synoptic weather station for a period of 40 years (1981-2020). The daily rainfall data were aggregated to calculate monthly and annual rainfall totals. Similarly, daily discharge and water (stage) levels, (1981-2016) were acquired from the Nigeria Hydrological Services Agency (NHSA), Abuja where the data was archived. The monthly peak discharge and water level, average monthly peak discharge and water level, and annual peak discharge and water level were sorted out from the daily data.
Data Analysis
Time series were used to analyze the fluctuations and trends in rainfall characteristics, discharge, and water stage. In doing that Least Square Regression Model (LSRM) was used to detect the rate of change in hydro-meteorological variables during the study period. The study employed this method because time series analysis comprises methods for analyzing changes in hydro-meteorological data in order to extract meaningful statistics such as trend and fluctuations as they vary over time. A time-series model is one which postulates a relationship amongst a number of temporal sequences or time series. It is provided by the simple regression model:
y(t) = x(t)β + ε(t), (1)
Where:
y(t) = {yt; t = 0, ±1, ±2, …} is a sequence, indexed by the time subscript t, which is a combination of an observable signal sequence x(t) = {xt} and an unobservable white-noise sequence ε(t) = {εt} of independently and identically distributed random variables. Least Square Regression Model (LSRM) has an equation of the form:
Y = a + bx, (2)
where x is the explanatory variable and Y is the dependent variable. The slope of the line is b, and a is the intercept (the value of y when x = 0)
![]() (3)
(3)
![]() (4)
(4)
Similarly, Pearson’s Product Moment Correlation coefficient (r) was used to determine the value of the trend for the purpose of ascertaining whether the trend in the time series is significant or not over the study periods using Student’s T-Test statistic. Pearson’s Product Moment Correlation coefficient (r) is expressed as:
 (5)
(5)
Where r is the correlation coefficient; x is time (years); y is Variable in question (temperature, rainfall, water level, LULC category), and n is the total number of years of data.
Student’s ‘t’ test was used to test the significance of all the trends at 95% degree of freedom of the study parameters. The formula is shown below.
![]() (6)
(6)
In this formula, t is the t-value, x1 and x2 are the means of the two groups being compared, s2 is the pooled standard error of the two groups, and n1 and n2 are the number of observations in each of the groups. A larger t-value shows that the difference between group means is greater than the pooled standard error, indicating a more significant difference between the groups. However, equation (6) is expressed in a simpler and more usable form by Anyadike (2010), as follows:
 (7)
(7)
Where: r = correlation coefficient; n= number of the variable(years).
The study therefore used equation (8) to determine the value of the t called calculated student’s ‘t’ value, the critical value of t was determined using Student’s T-Distribution Table at 0.05 (95%) confidence level. According to Anyadike (2010), if the calculated t value is greater than the critical value of t, the trend in the time series is significant, hence the null hypothesis is rejected, while the alternative hypothesis is accepted.
RESULTS AND DISCUSSION
Results
Variation in Monthly and Annual Rainfall Amount over Ibi
The result of the monthly pattern over Ibi is presented in Figure 2. The result shows that the effective rains start in April with an average monthly rainfall amount of 65.47mm which is slightly lower than that of Makurdi. Average monthly rainfall increased to 129.858mm in May which represents about a 50.7% increase. From May, average rains increased steadily from 129.85mm to peak in September with 205.93mm. It thereafter declined sharply to 111.20mm in October. This result therefore suggests that, inspite of traces of rains in the months of November, January, February and March, rainy season actually starts in the Month of April and ends in the month of October. High rains are concentrated in the mouths of August and September which can in lead to corresponding increase in volume of surface water sources such as streams and rivers.
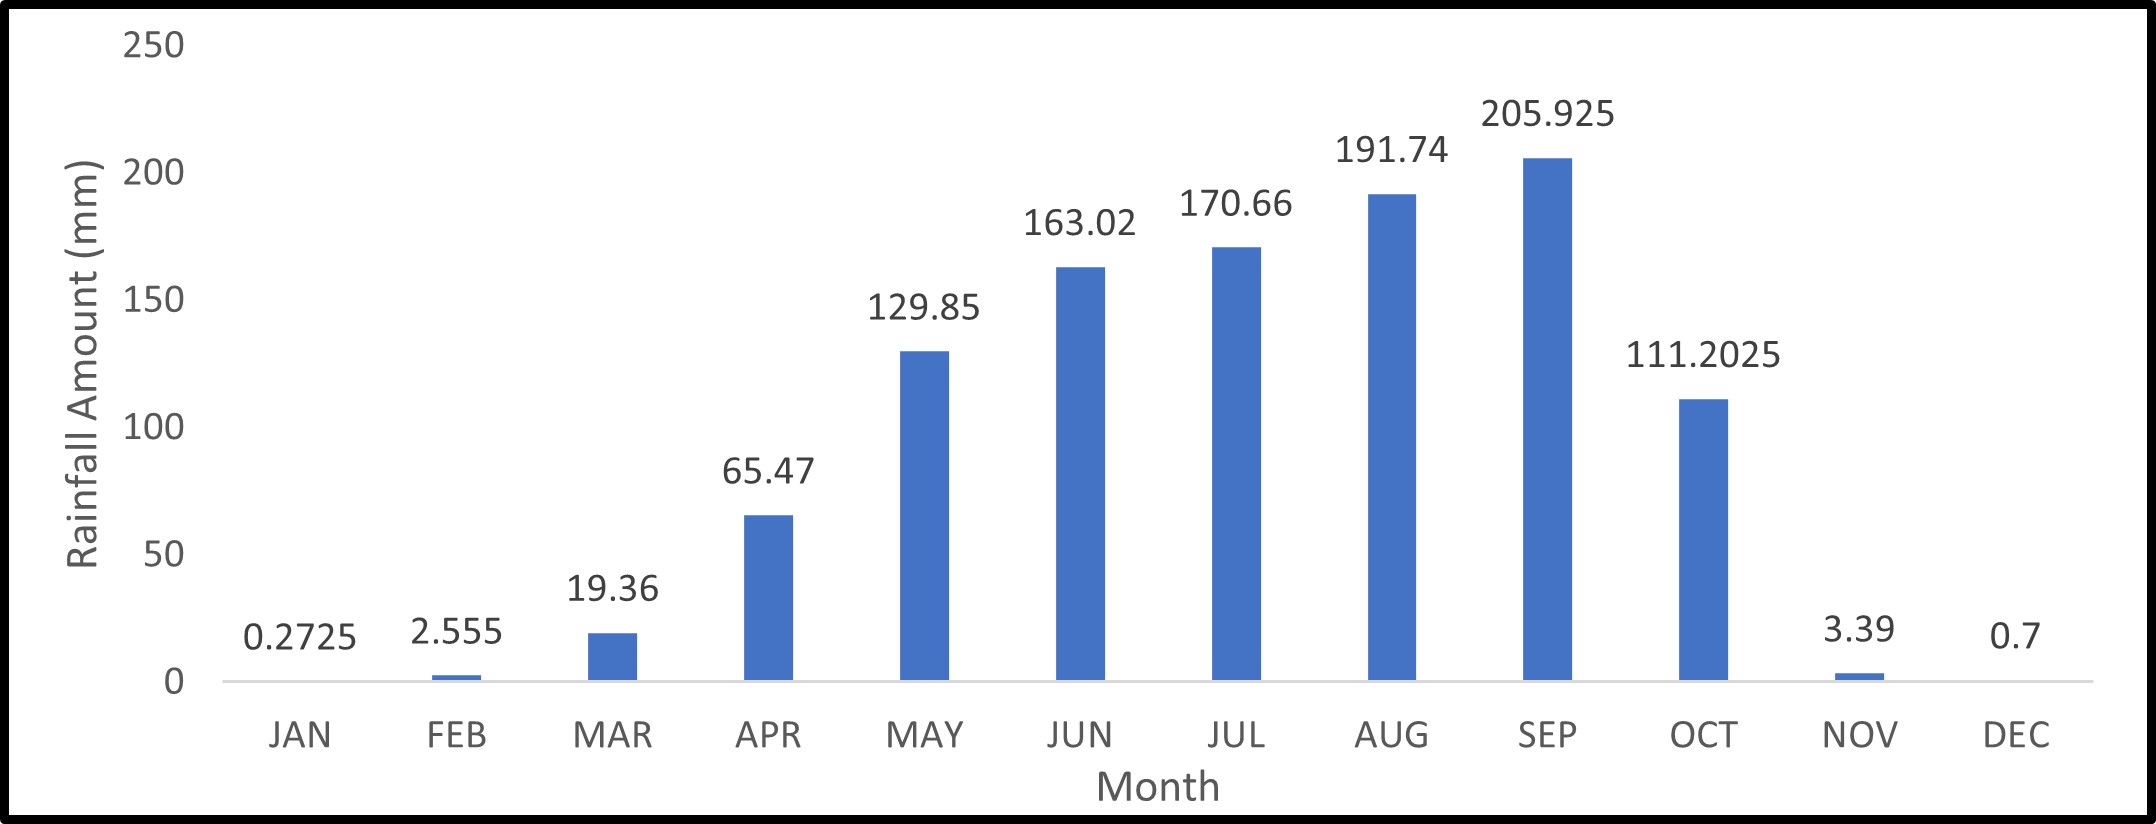
Figure 2: Average Monthly Rainfall Pattern over Ibi (1981-2020)
The result of annual variation in rainfall amount over Ibi is presented in Figure 1 and Table 1. The result generally shows a declining trend at an annual rate of 3.1226mm with R2 and r values of 0.0416 and 0.2039. The trend is however not significant at 0.05 (95%) level of confidence, given that the value of calculated t of 1.2838 is less than the Critical t value of 1.684. This suggests that the observed decline in annual rainfall amount occurred by chance statistically, however, it indicates a drier condition during the study period. The result further shows that the mean, highest, and lowest annual rainfall amounts of 1064.15mm, 1406.8mm (2016) and 779.2mm (1993) were found. The standard deviation and coefficient of variation are 176.77 and 16.61% which suggests a relatively minimal variation during the study period. The 5-year moving average does not show clear oscillation, however, it hovered below the mean for most of the study period, except between 2006 and 2013 which recorded upward oscillation of a very low amplitude.
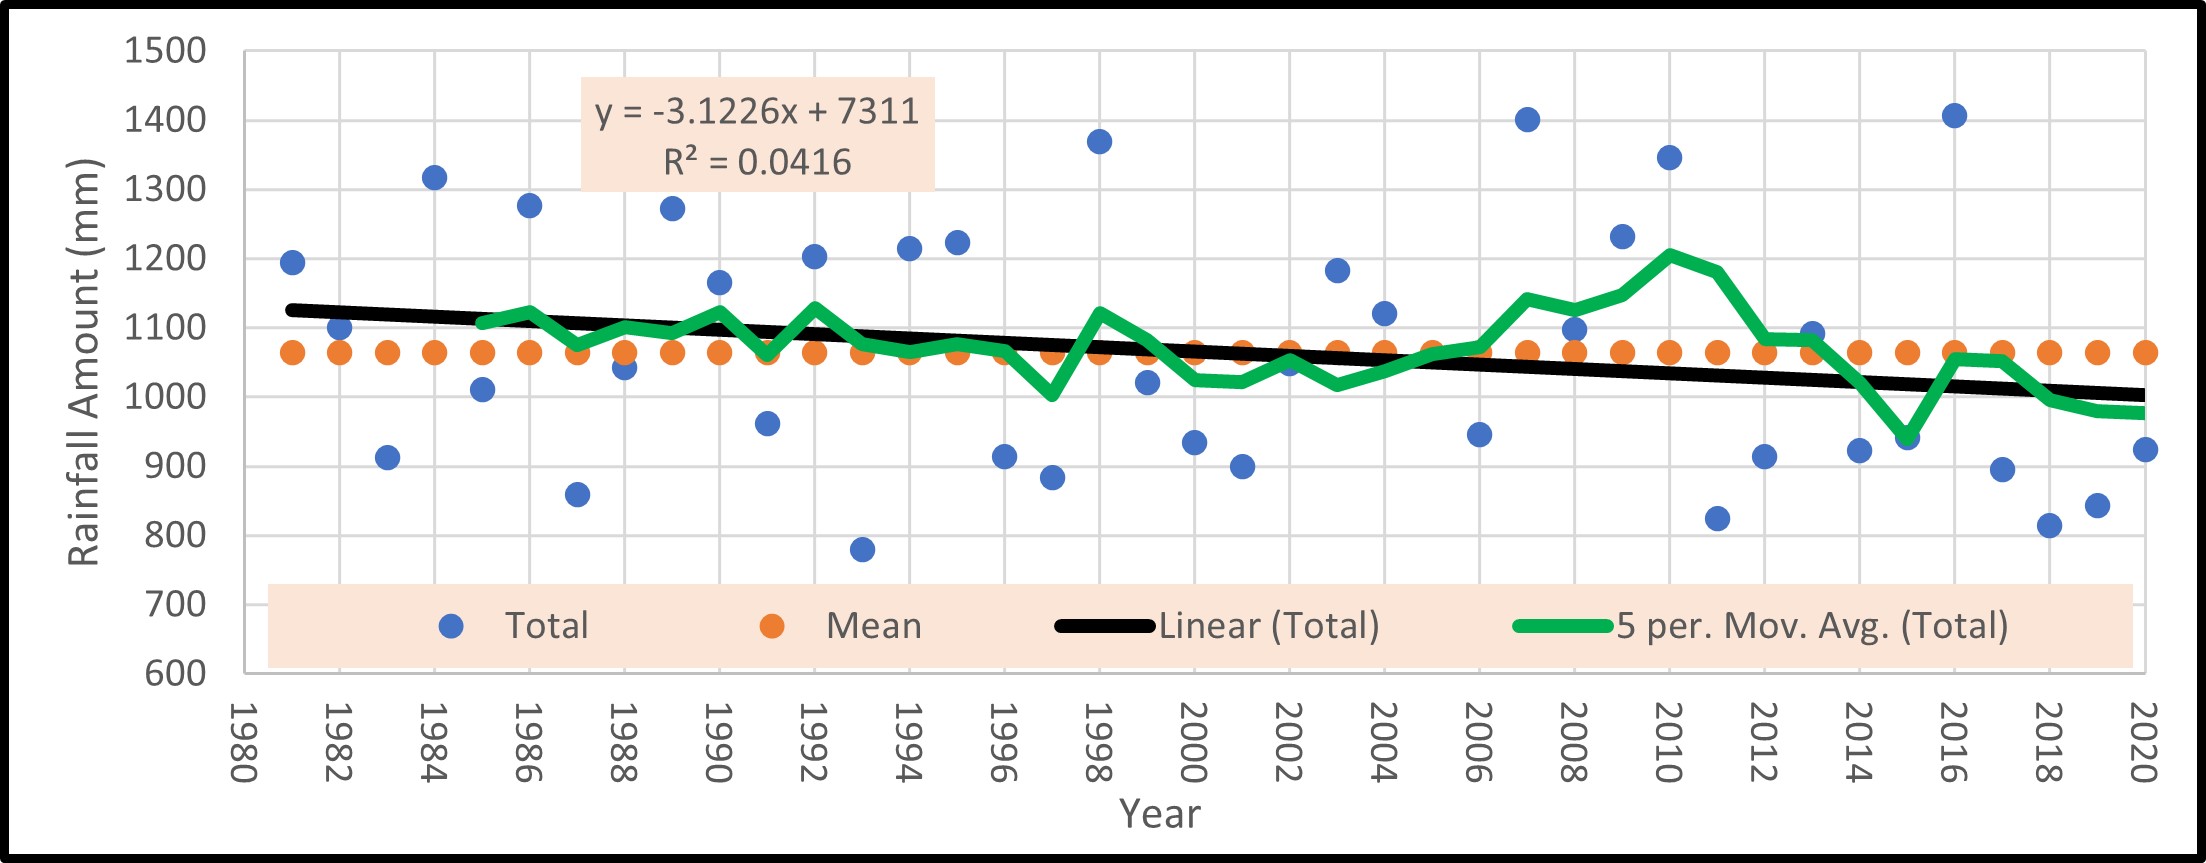
Figure 3: Variability in Annual Rainfall over Ibi (1981-2020)
This section presents the result of the monthly and annual variability river discharge in Benue Basin. The summary of the major variables is presented in Table 4.2.
Table 1: Summary of Rainfall Amount, River Discharge and Stage (water Level Key Variables
| Variable | Rainfall Amount (mm) | Discharge (m3/s) | Water Level (cm3) |
| Standard Deviation | 1064.15 | 2753.8 | 105.12 |
| Coefficient of Variation | 176.77 | 35.6 | 12.53 |
| Mean | 16.61 | 7742.5 | 839.08 |
| Regression (R2) | 0.2039 | 0.0163 | 0.2039 |
| Correlation (r) | 0.0416 | 0.1277 | 0.4155 |
| Calculated ‘t’ | 1.2838 | 0.7972 | 2.8708 |
| Table ‘t’ Value | 1.684 | 1.70 | 1.684 |
| Remarks | * | * | ** |
Source: Computed from NiMet and NHSA Data, 2023
Note: * = Not Significant at 0.05 confidence level
** = Significant at 0.05 confidence level
Variation in Monthly and Annual River Discharge at Ibi
The result of the monthly variation in river discharge at Ibi section of the Benue River is presented in Figure 4. The result shows that the highest peak discharge value of 12,100 m3/s occurred in September and October, with an equally very high discharge of 12026 m3/s occurring in August, while the lowest discharge of 554.18 m3/s occurred in January. High river discharge is generally concentrated at the peak of the rainy season between July and October; however, a relatively high discharge is still recorded in November. This result suggests that river discharge at Ibi is a direct response to the seasonal variation in rainfall just like other locations earlier presented, though the result indicates a time lag of three months (April and June).
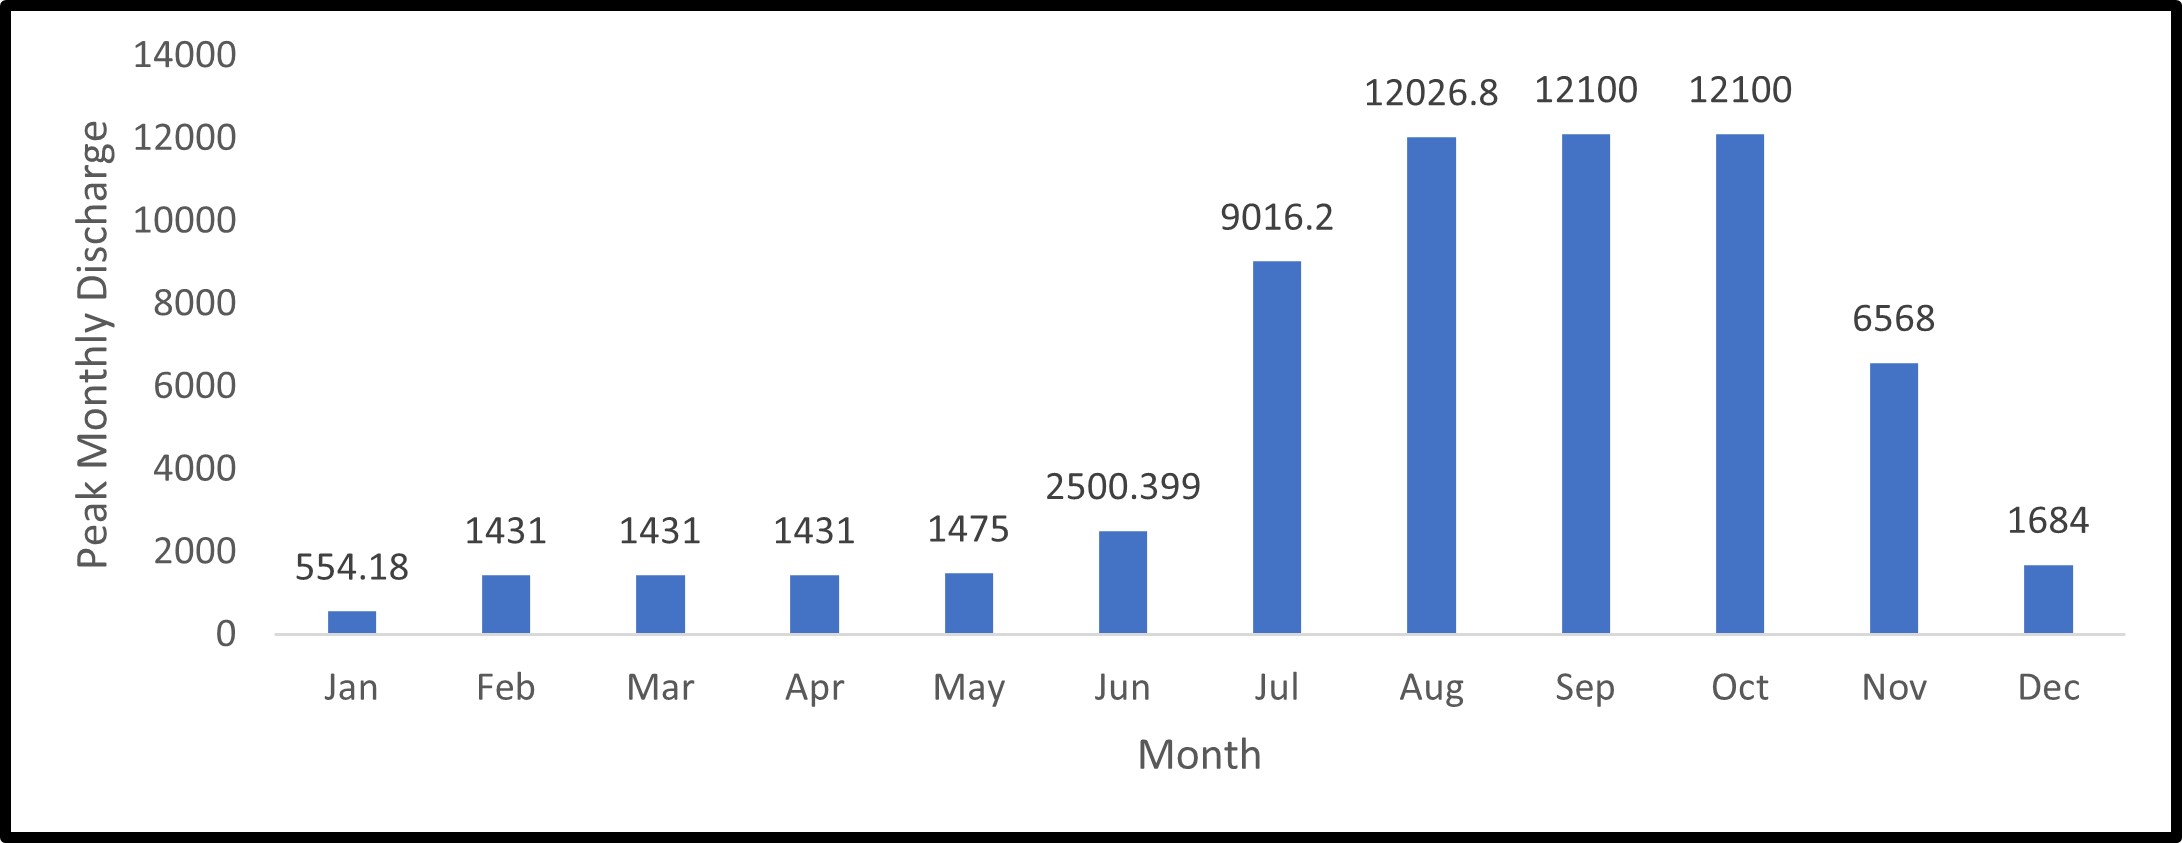
Figure 4.: Monthly Peak River Discharge at Ibi on River Benue
The result of the annual variation in discharge at Ibi is presented in Figure 5 and Table 1. The result indicates a negative trend in discharge during the study duration, with an annual decrease of 31.715 m3/s; and regression and correlation coefficients of 0.003 and 0.0548 respectively. The trend is however not significant at the 0.05 (95%) confidence level, given that the calculated ‘t’ value of 0.7972 falls below the critical value of 1.70. The result further indicates a mean annual peak discharge of 7742.5 m³/s over the study period, with a standard deviation of 2753.8 and a coefficient of variation of 35.6%. The relatively high values of standard deviation and coefficient of variation imply a sudden and unpredictable decline in discharge during the study duration at this section of river Benue.
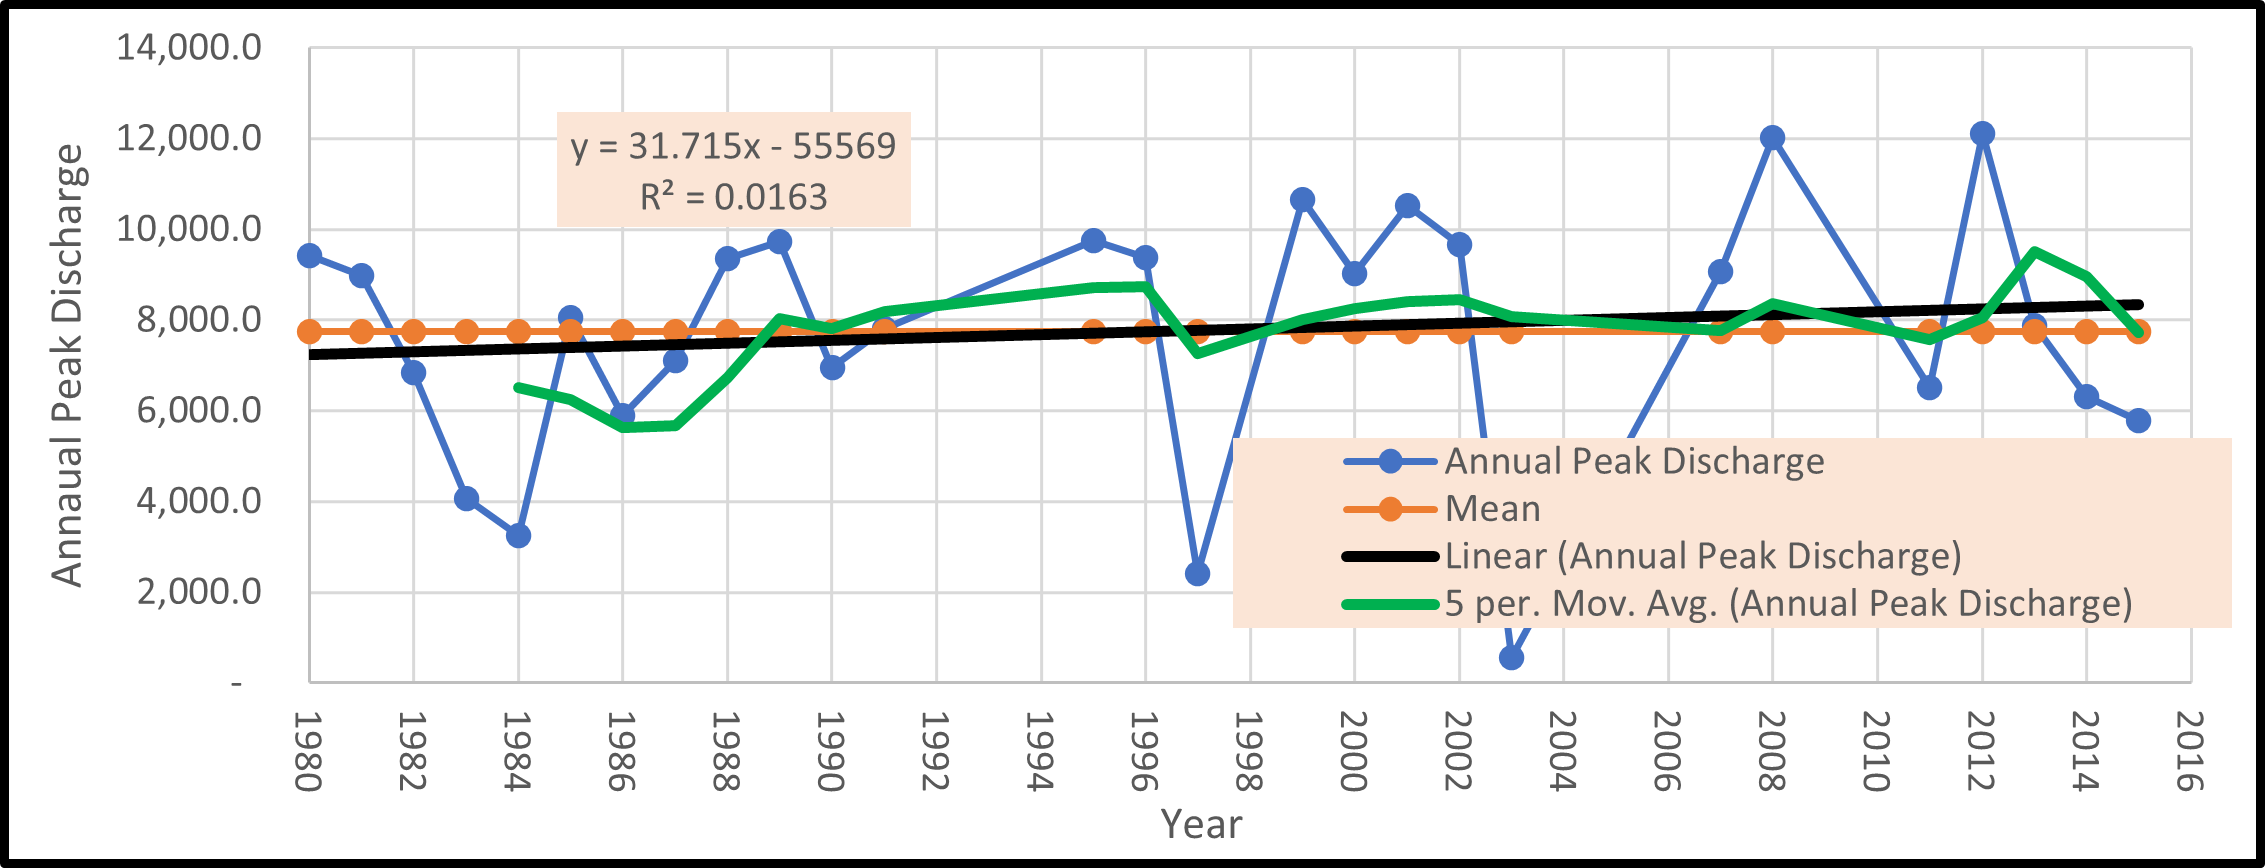
Figure 5: Annual Peak River Discharge at Ibi on River Benue
Variation in Monthly and Annual Water Levels over River Benue at Ibi
Figure 6 presents result of the monthly variation in water level at the Ibi section of river Benue. The result indicates that September and October recorded the highest monthly peak water levels of 1109.00 cm3 and 1019 cm3. The water level declined sharply to 760.00 cm3. 415.00 cm3 and 339.00 in the months of November, December and January. Just like other sections of the basin, water begins to rise from the month of June (539.00cm3) to peak in the month of September and remained high to till the month of October even with minimal rains in October and little or no rain in the month of November.
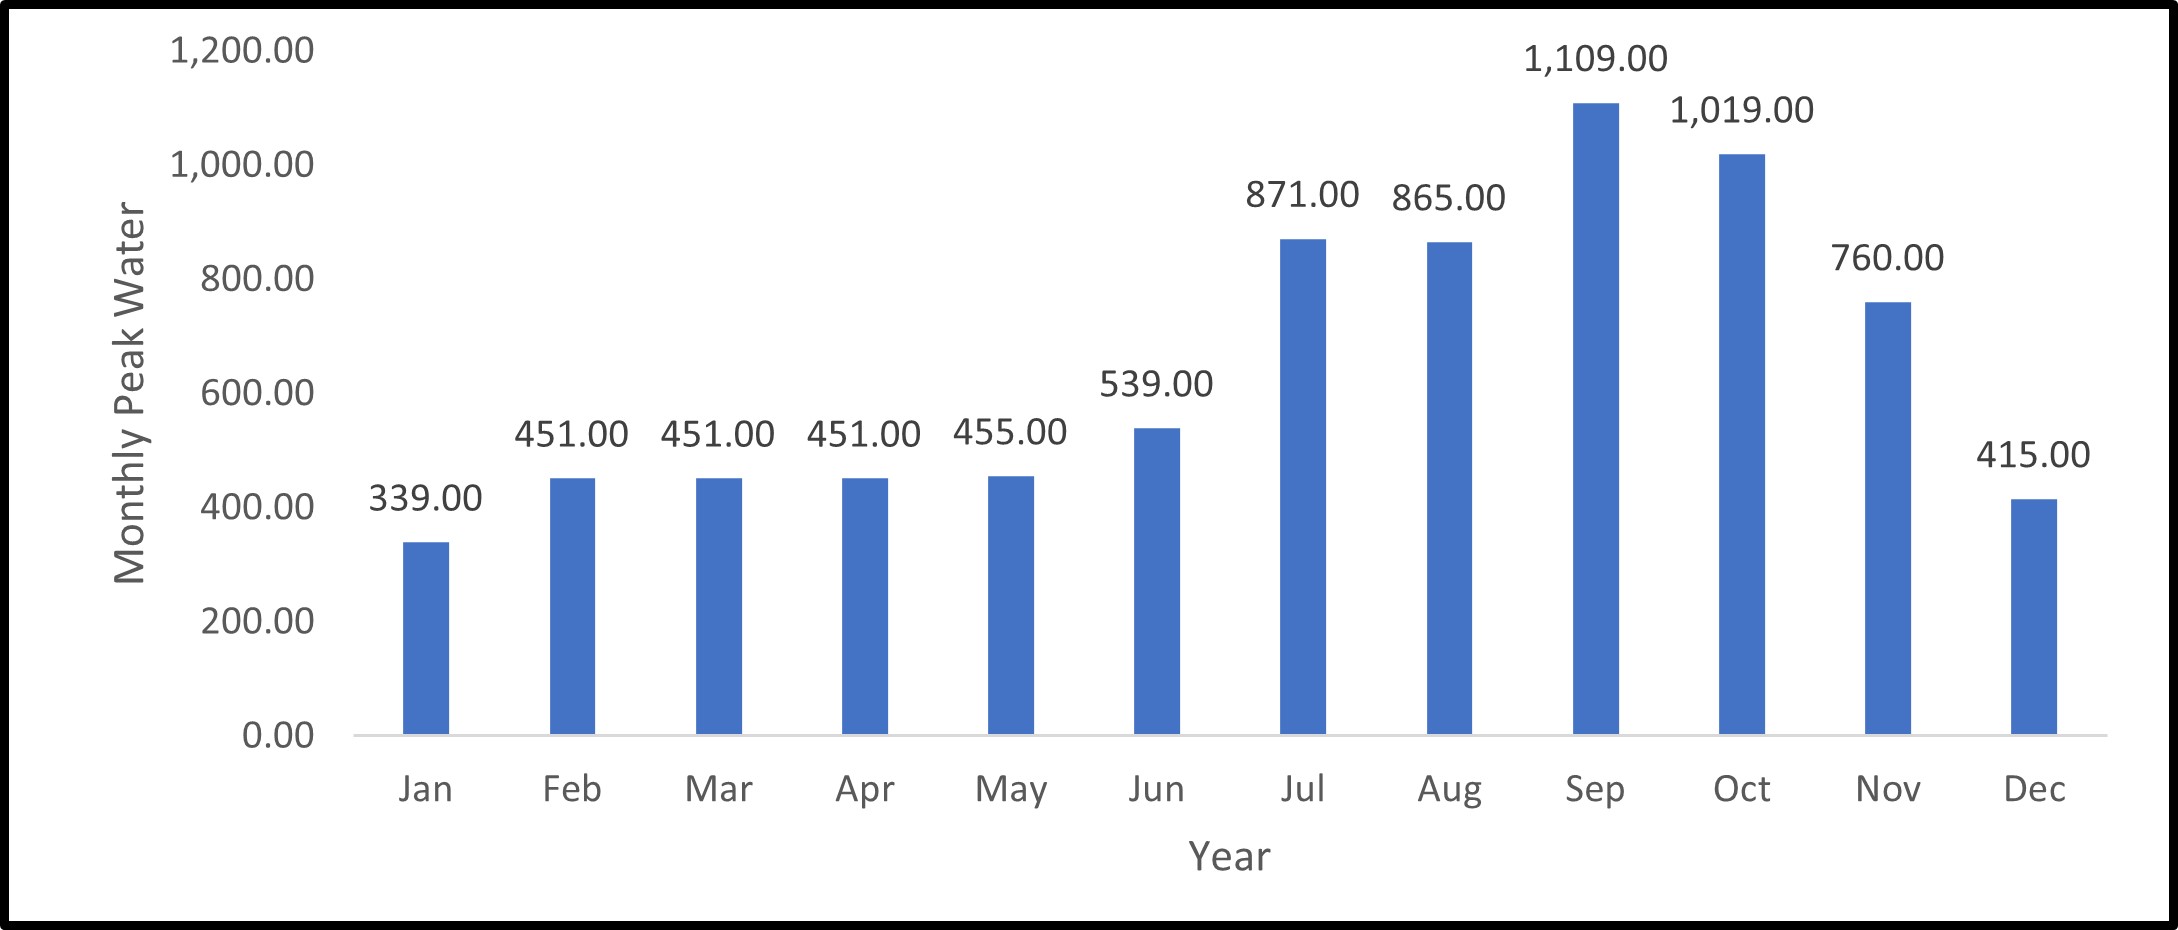
Figure 6: Monthly Peak Water Level at Ibi on River Benue
The result of annual peak water level for Ibi section of Benue River is presented Figure 7 and Table 1. The result shows an increasing trend at an annual rate of 3.9985 with R2 and r values of 0.2039 and 0.4155. The trend is significant at a 0.05(95%) confidence level given that the calculated value of t of 2.8708 is greater than the table value of 1.684. This suggests that, though the annual rainfall amount had declined over Ibi (Figure 2), the water level has continued to increase, which can be attributed to the contribution of runoff from the sub-basin within the Ibi catchment area of the larger River Beau Benue Basin. The mean, highest and lowest peak annual water level were found to be, 839.08cm³, 1109.0cm² (2012) and 588.0 cm³ (1984) respectively. The standard deviation and coefficient of variation from the mean value were found to be 105.27 and 12.53%, which suggests relatively stable peak water level regime at Ibi section of the Benue River during the study period. The increasing peak water level in the face of declining rainfall amount presents some form uncertainty to availability of water in terms of volume, of surface water sources within this section of the River Benue Basin.
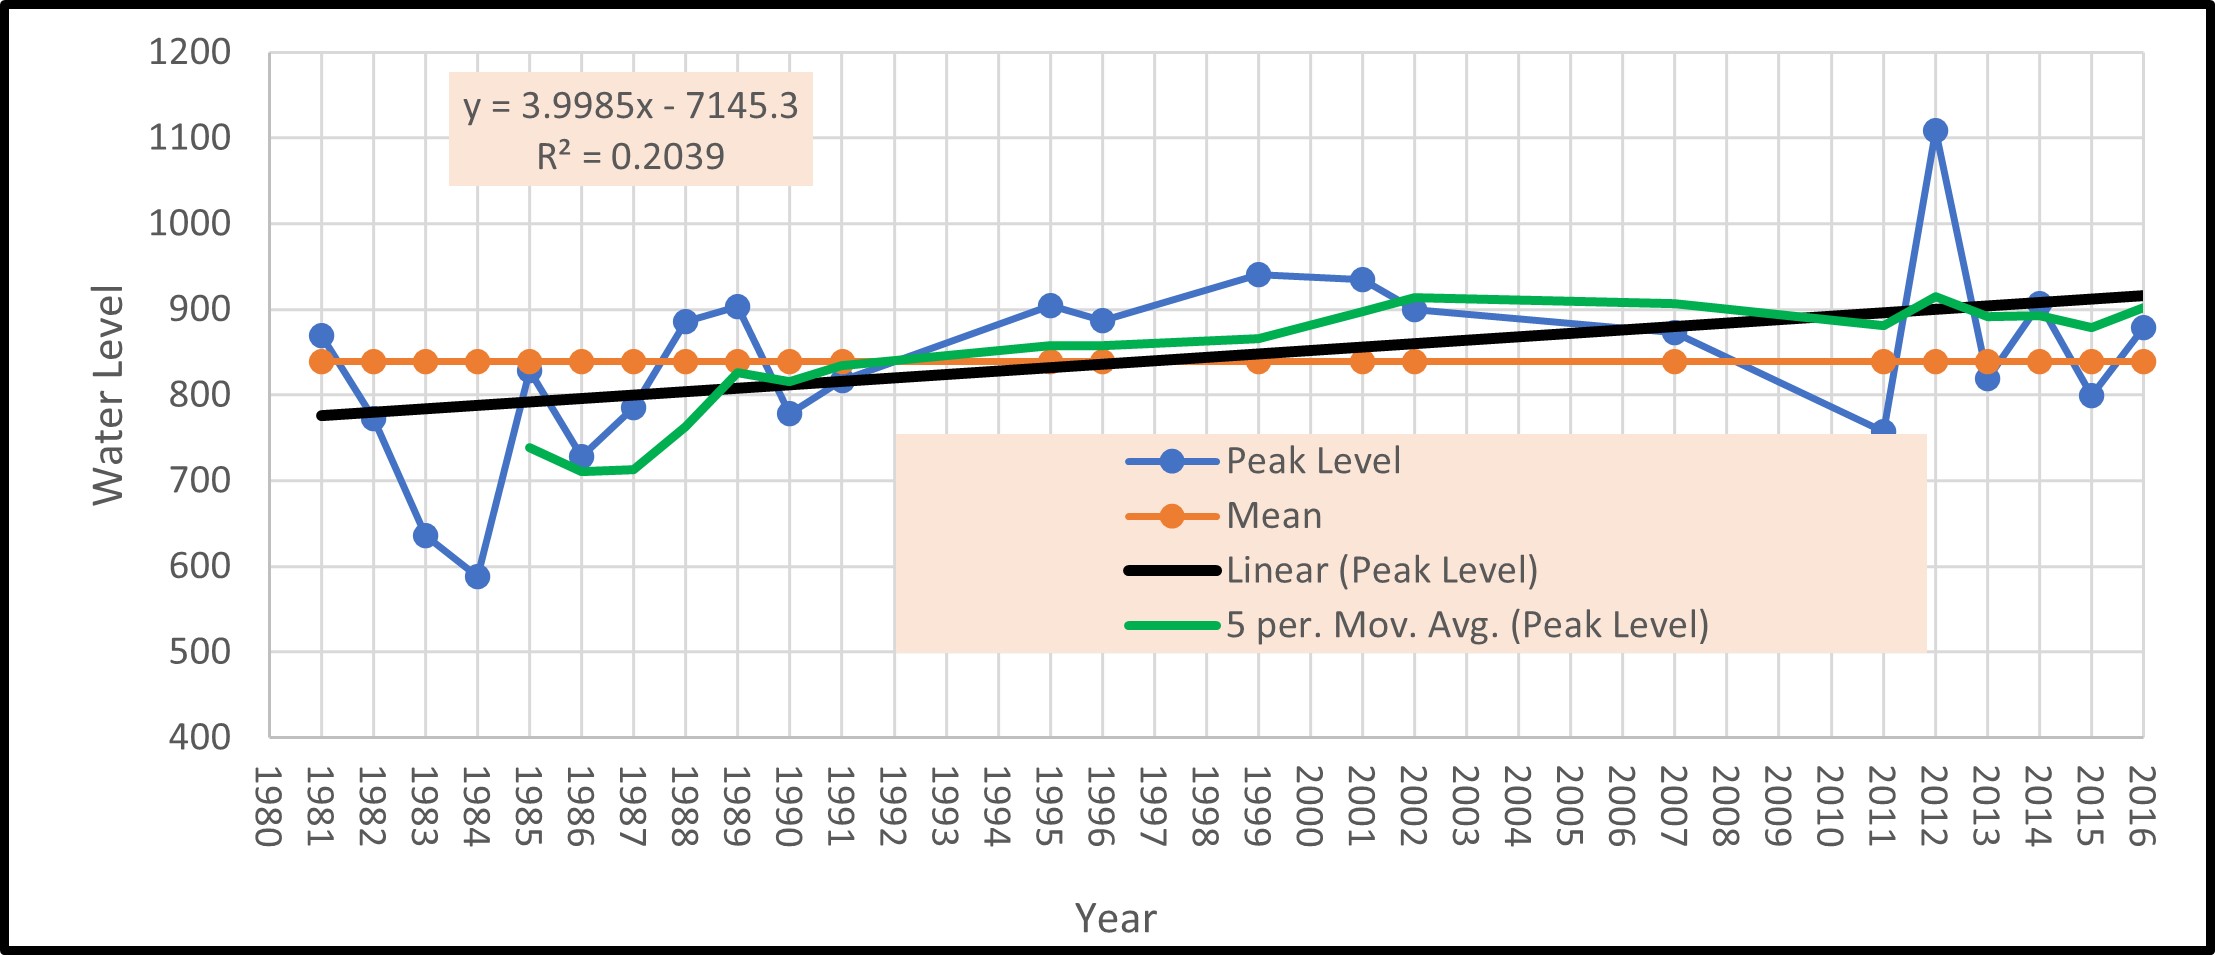
Figure 7: Annual Peak Water Level at Ibi on River Benue
DISCUSSION
The results of this study are consistent with several empirical studies. For instance, Ekeu-wei and Blackburn (2020) conducted a flood modeling study in the Niger Delta. They found significant spatial and temporal variability in flood extent and frequency result from variation in river water stage and discharge, with urban areas experiencing higher flood impacts. Their findings highlight the need for integrating local hydrological data for accurate flood predictions and management, which is consistent with the observed variations in discharge and water levels in the Ibi Section Benue Basin, indicating some location-specific hydrological dynamics. Ganji et al. (2019) used Sentinel-1 data to analyze urban river floods in Gorganrood, Iran. They observed that peak discharge during the monsoon season significantly influenced urban flooding. This study corroborates the variability in peak discharge and water levels in the study area, particularly the seasonal peaks at Ibi section of the River Benue Basin, demonstrating how peak discharge patterns can impact regional hydrology and necessitate effective flood management strategies. Orimoloye et al. (2021) assessed drought severity and water shortages in the Nigerian Sahel using MODIS data. They noted significant annual fluctuations in water availability, driven by climatic factors. Their research parallels the annual variations in river discharge in the Benue Basin, with decreasing trends at and Ibi, underscoring the influence of climate variability on regional water resources.
In addition, Awotwi et al. (2015) investigated the impact of land use changes and climate variability on river discharge in the Volta Basin. Their findings revealed significant reductions in river discharge attributed to deforestation and increased agricultural activities. This study does not align with the observed increase in river discharge at Ibi. Oladipo et al. (2019) examined the seasonal variations and long-term trends in river discharge and water levels in the Niger River Basin. They reported a notable increase in discharge during the rainy season, with significant annual increases observed in some sections, similar to the positive trends at Ibi. The study underscores the role of seasonal rainfall patterns in influencing river discharge. Ayanlade et al. (2017) assessed the effects of climate change on river discharge in southwestern Nigeria. Their research indicated a declining trend in river discharge due to reduced rainfall and increased evaporation rates, particularly during the dry season. This is not consistent with the increasing discharge trends at Ibi, suggesting that climate change impacts are evident in these regions. Mohammed et al. (2020) focused on the hydrological response to climate variability in the Blue Nile Basin. They found a significant increase in river discharge during the wet season, driven by enhanced rainfall, while the dry season showed a declining trend. The studies collectively provide evidence of the influence of climate variability, especially, rainfall patterns on river discharge and water levels.
CONCLUSION
The analysis of rainfall river discharge and stage in Ibi reveals several notable patterns. Monthly rainfall data show that the rainy season starts in April, peaks in September, and sharply declines by October. Despite an overall decline in annual rainfall, the mean annual rainfall has remained relatively stable. River discharge mirrors this pattern, with peaks in September and October corresponding to high rainfall, though it has seen a slight, statistically insignificant decline over time. Water levels in the river also follow a similar seasonal trend, rising to peak levels in September and October. Interestingly, despite the general decrease in rainfall, the annual peak water level has shown a significant increasing trend. This indicates a complex interplay between rainfall and runoff in the Ibi catchment area, suggesting potential impacts on surface water availability.
REFERENCES
- Abdullahi, M. A., Adamu, I. A., & Hassan, M. A. (2023). Hydrological responses to climate variability: A case study of the Benue River Basin. Hydrology Research, 54(2), 245-258.
- Adebayo, A. A., Ilesanmi, A. O., & Akinola, A. A. (2020). Assessment of water resources management in Nigeria: A review. Journal of Environmental Management, 269, 110739.
- Adejuwon, J. O. (2020). Climate change and water resources in Nigeria: A review. Climate and Development, 12(7), 658-671. https://doi.org/10.1080/17565529.2019.1604238
- Anyadike, R.N.C (2010). Statistical Methods for the Social and Environmental Sciences. Spectrum Books Limited Lagos: Nigeria, pp 330-333.
- Awotwi, A., Kumi, M., & Nkrumah, F. (2015). Assessing the impact of land cover changes on water balance components of White Volta Basin in West Africa. Water and Environment Journal, 29(2), 259-267.
- Ayanlade, A., Radeny, M., & Morton, J. F. (2017). Comparing smallholder farmers’ perception of climate change with meteorological data: A case study from southwestern Nigeria. Weather and Climate Extremes, 15, 24-33.
- Babatunde, I. A., Ogunjobi, K., & Oluwaseun, A. A. (2018). Variability of river discharge and its implications for water resources management in Nigeria. Water Resources Management, 32(14),
- Chukwu, I. E., Adama, C. A., & Kalu, C. N. (2021). Analysis of river stage and discharge variability in the Benue River Basin. Journal of Hydrology and Meteorology, 17(1), 82-94.
- Da Silva, R. M., Santos, C. A. G., Moreira, M., Corte-Real, J., Silva, V. C. L., & Medeiros, I. C. (2015). Rainfall and river flow trends using Mann-Kendall and Sen’s slope estimator statistical tests in the Cobres River basin. Natural Hazards, 77(3), 1205–1221.
- Ekeu-wei, I. T., & Blackburn, G. A. (2020). Catchment-scale flood modelling in data-sparse regions using open-access geospatial technology. ISPRS International Journal of Geo-Information, 9(9), 512.
- Eze, C. E., & Nwankwo, I. E. (2022). Impact of river discharge variability on agricultural productivity in Nigeria. Agricultural Water Management, 253, 106979.
- Ganji, K., Gharachelou, S., & Ahmadi, A. (2019). Urban’s river flood analyzing using sentinel-1data case study: (gorganrood, aq’qala). International Archives of Photogrammetry, Remote Sensing and Spatial Information Sciences, 42, 415–419.
- Ghanem, A. (2011). Trends in mean seasonal and annual rainfall amounts over Jordan. Human and Social Sciences, 38, 1041–1049.
- Gulick SPS, Jaeger JM, Mix AC, Asahi H, Bahlburg H, et al. (2015) Mid Pleistocene climate transition drives net mass loss from rapidly uplifting St. Elias Mountains, Alaska. Proc Natl Acad Sci USA 112: 15042-15047.
- Ilesanmi, A. A., Ojo, J. A., & Oluwaseun, A. O. (2018). Rainfall variability and its impacts on river stage in Nigeria: A case study of the Benue River Basin. Journal of Hydrology, 567, 161-173.
- Jain, S. K., & Kumar, V. (2012). Trend analysis of rainfall and temperature data for India. Current Science, 102(1), 37–49.
- Langat, P. K., Kumar, L., & Koech, R. (2017). Temporal variability and trends of rainfall and streamflow in Tana River Basin, Kenya. Sustainability, 9(11), 1963.
- Longobardi, A., & Villani, P. (2010). Trend analysis of annual and seasonal rainfall time series in the Mediterranean area. International Journal of Climatology, 30(11), 1538–1546.
- Machiwal, D., Kumar, S. and Dayal, D. (2016). Characterizing rainfall of hot arid region by using time-series modeling and sustainability approaches: A case study from Gujarat, India. Theory and Applied Climatology, 124, 593–607.
- Micalel T, Jonathan CAF (2001) Africa’s Lake Chad Shrinks By 20 Times Due to Irrigation Demands, Climate Change-Science Daily, p: 2
- Mohammed, I. N., & Tarboton, D. G. (2020). Hydrologic modeling of the impact of climate change on river discharge in the Blue Nile Basin, Ethiopia. Hydrology Research, 51(1), 23-39.
- Muchuru, S., Botai, J. O., Botai, C. M., Landman, W. A., & Adeola, A. M. (2016). Variability of rainfall over Lake Kariba catchment area in the Zambezi River basin, Zimbabwe. Theoretical and Applied Climatology, 124(1), 325–338.
- Musa, S. K., Nde, S. I., & Abdullahi, A. (2021). Evaluation of river discharge patterns in the Benue River Basin. Water Resources Research, 57(6), e2021WR030758.
- Nnaji, C. O., Okoro, U. C., & Uwaoma, A. C. (2018). Hydrological variability and its effects on water resources management in Nigeria. Environmental Monitoring and Assessment, 190(9), 564.
- Oguntunde, P. G., Abiodun, B. J., & Akinwumi, O. J. (2019). Rainfall variability and its impact on river discharge in Nigeria. Climate Dynamics, 52(1-2), 243-258.
- Okonkwo, J. C., Udo, C. M., & Onyema, I. C. (2017). Climate change and its impact on river discharge in Nigeria. Environmental Science and Policy, 77, 59-70.
- Oladipo, E. O., Mmom, P. C., & Amadi, S. K. (2019). Seasonal variations in river discharge and their implications for flood management in the Niger River Basin. Journal of Hydrology, 571, 479-489.
- Orimoloye, I. R., Belle, J. A., Olusola, O. A., & Adelabu, S. (2021). Spatial assessment of drought disasters, vulnerability, severity and water shortages: A potential drought disaster mitigation strategy. Natural Hazards, 105(3), 2735–2754.
- Uluocha, N. I., & Ogbuehi, K. O. (2016). Assessing the impacts of river discharge variability on agricultural productivity in Nigeria. Agricultural Systems, 148, 64-74.
- UNEP and UNFCCC (2001). Climate Change. Information Kit, https://unfccc.int/resource/iuckit/[cckit2001en.pdf](http://cckit2001en.pdf)
- Urama, K. C. and Ozor, N. (2010). Impacts of Climate Change on Water Resources in Africa: The Role of Adaptation. Climate Adaptation. 1-30
- Water Scarcity, from: https://www.beforetheflood.com/explore/the-crisis/water-scarcity-and-climate-change
- Xia, J and Allaramadji, B. B. (2017). The Impact of Hydro Climatic Variability on Water Resources of Lake Chad Hydro Graphic Basin. Hydrology Current Research, 8(3), 282. doi: 10.4172/2157-7587.1000282