
The Impact of Environmental Awareness Campaigns on Consumer Behaviour: A Comparative Analysis of Green Product Adoption.
- Pending
- 199-210
- Apr 7, 2024
- Environmental Impact
The Impact of Environmental Awareness Campaigns on Consumer Behaviour: A Comparative Analysis of Green Product Adoption
Fletcher Junior Nimoo1 , Abraham Okrah2* , Shadrach Kundi Baa-Naa3 , Joseph Fuseini4
1School of Business. Nanjing University of Information Science and Technology, Nanjing
210044, China;
2School of Applied Meteorology, Nanjing University of Information Science and Technology,
Nanjing 210044, China;
3African Centre for International Affairs;
4School of Management Science and Engineering, Nanjing University of Information Science
and Technology, Nanjing 210044, China;
*Corresponding Author
DOI: https://doi.org/10.51584/IJRIAS.2024.90320
Received: 15 February 2024; Accepted: 06 March 2024; Published: 07 April 2024
ABSTRACT
This study delves into the dynamics of consumer perceptions in sustainable product markets, aiming to uncover the synergies between price, brand, environmental attributes, and quality. Through the utilization of Pearson correlation coefficients, the research reveals robust relationships among these variables, highlighting noteworthy correlations such as a 0.783 correlation between price and brand, 0.826 between price and quality, and 0.775 between brand and quality. These statistical insights provide a quantitative foundation for understanding the intricate interplays influencing consumer viewpoints. Moreover, the study emphasizes the strategic significance of pricing, brand communication, quality assurance, and environmental messaging in shaping consumer attitudes. Recognizing the centrality of environmental consciousness, businesses are advised to integrate holistic marketing strategies that resonate with consumer expectations. In addition to exploring the statistical relationships among key variables, this study provides a comprehensive examination of consumer perceptions, drawing insights from demographic distribution, normality testing, and correlation analysis. A diverse gender distribution was observed, with 43.9% females, 56.1% males, and a small percentage (0.6%) opting not to disclose. The age distribution revealed varying segments, with 15.1% aged 18-24, 44.6% between 25-34, and smaller percentages across older age groups. The income spectrum ranged from $5,000 to $21,000+, reflecting a broad socio-economic context. Educational attainment varied, with 30.1% holding bachelor’s degrees and 4.2% possessing doctorates. Furthermore, the correlation analysis unveiled meaningful relationships among variables. Positive correlations were observed between price and brand (r = 0.783), price and quality (r = 0.826), and price and green attributes (r = 0.733), indicating consumer perceptions linking higher prices with brand recognition, quality, and environmental friendliness. Strong positive correlations were also found between brand and quality (r = 0.775), brand and green attributes (r = 0.743), and green attributes and quality (r = 0.676), suggesting associations between reputable brands, perceived product excellence, and environmental friendliness. Survey responses provided additional insights, revealing a significant level of concern (52.4%) about environmental issues, a belief in individual impact on the environment (71.7%), and a trend toward consistent green purchasing behaviour (41.6% always). Social pressure (38.6%) and green marketing (37.3%) were noted as influential factors in consumer decision-making. This study contributes nuanced insights into consumer perceptions in sustainable product markets, emphasizing the interplay of demographic factors, normality testing, and correlation analysis. These findings offer valuable guidance for businesses seeking to develop effective marketing strategies tailored to resonate with environmentally conscious consumers.
Keyword: Consumer Perceptions, Market Segmentation, Sustainable Consumption, Sustainable Products.
INTRODUCTION
The study of green marketing, which examines the relationship between environmental sustainability and consumer behaviour, has become increasingly important (Zsóka et al., 2013). In response to growing societal consciousness regarding environmental concerns, businesses are modifying their marketing tactics to align with both customer preferences and ecological responsibilities (Jansson & Marell, 2010; Straughan & Roberts, 1999; Zsóka et al., 2013). Green behaviour comprises a variety of acts, ranging from buying environmentally friendly products to adopting policies that minimize environmental damage. Gaining insight into these behaviours is crucial for organizations seeking to integrate their products and services with environmental principles (Review, 2023; Sheoran & Kumar, 2022). The elements that can influence individuals’ choices towards environmentally friendly behaviour may encompass environmental awareness, perceived effectiveness of individual activities, societal effects, economic reasons, and availability of green products.
Amidst the growing concern for the environment, companies and policymakers need to comprehend the factors that impact customers’ environmentally-friendly actions. Recent research (Building, 2005; Jansson & Marell, 2010; Sheoran & Kumar, 2022; Zsóka et al., 2013) in the domain of green marketing has extensively examined these issues, revealing the intricate and diverse character of green consumer behaviour. In the context of the issue, Perceived consumer effectiveness (PCE) is alternatively known as self-assessment and evaluates the extent to which customers hold an opinion that their actions significantly influence the solution of the problem (Goodarzi et al., 2021). In a different context, it refers to the rate at which an individual feels that their actions, such as choices about what to buy, how much energy they use, or how they recycle, can help resolve environmental problems. PCE is a state of mind in which a consumer believes that his or her actions have an impact; as a result, intentions and behaviour is influenced by the extent of PCE (A et al., 2023). Perceived consumer efficacy relates to an individual’s conviction regarding their ability to influence matters concerning the environment and resources.
Many researchers (A et al., 2023; Building, 2005; Dash, 2021; Rusyani et al., 2021; Straughan & Roberts, 1999) have asserted that individual factors, such as customers’ opinions regarding the effectiveness of their environmentally friendly choices and their general attitudes towards green products, exert a substantial influence on their decisions regarding green purchasing. Consumer behaviourists have traditionally held the belief that an individual’s attitudes can serve as an indicator of their actions (Dinh & Uehara, 2021). Significant attempts have been made to enhance the capacity to predict the actions of individuals, and a wide range of influential criteria has been proposed. Numerous hypotheses (Dash, 2021; Review, 2023; Sheoran & Kumar, 2022) have also been put forth in an attempt to clarify the mechanism through which attitude can forecast behaviour. As stated in the theory of reasoned action (Goodarzi et al., 2021), “people consider the implications of their actions before they decide to engage or not engage in a given behaviour.”. Individuals meticulously evaluate the outcomes and consequences of their decisions before deciding whether to engage in a specific behaviour, according to this theory. Positively connected with behaviour, attitude is a significant predictor of an individual’s propensity to purchase a green product (Zhongfu Tan, 2022). A step in the process of making a decision is assessing one’s attitudes towards the behaviour in question, as well as the social standards or expectations that are perceived. In essence, the theory posits that behaviour results from a systematic and logical evaluation of the advantages and problems associated with a particular course of action.
The influence of green marketing on consumer behaviour has been a focus, with studies suggesting that how products are marketed, including the use of eco-labels and green advertising, plays a crucial role in shaping consumer perceptions and purchase intentions. According to Jansson & Marell, (2010), Ecolabels can be regarded as a crucial green marketing and advertising tool that is widely used to provide consumers with knowledge about the green aspects of the product. Studies investigating the role of eco-labels as credible sources of pro-environmental information for different categories of green products provide sound evidence of their positive effects on consumer attitudes and subsequent purchase intentions (Ghose & Chandra, 2020). Green marketing has been of great focus when it comes to its influence on customers’ green behaviour, with several studies highlighting how products are marketed, which includes the use of eco-labels and green advertisements can be a critical influence in shaping customers’ green behaviour.
The significance of this study therefore lies in its potential to provide valuable insights into consumer behaviour within sustainable product markets, offering practical implications for businesses, policymakers, and marketers (Al-kumaim et al., 2021; Sheoran & Kumar, 2022). Specifically, this study aims; (a) to investigate the correlations between price, brand, environmental attributes, and quality in consumer perceptions of sustainable products, (b) to explore how demographic variables, such as age, income, and education, impact consumer preferences and decision-making processes in the context of sustainable product markets, (c) to assess the effectiveness of integrated marketing strategies that combine environmental messaging with a focus on product quality, and analyze potential variations across different product categories. Understanding the correlations between price, brand, environmental attributes, and quality is essential for companies seeking to align their products with consumer expectations. By exploring the influence of demographic factors, the study contributes to a nuanced understanding of how diverse consumer segments perceive and prioritize sustainability features. The evaluation of integrated marketing strategies addresses a critical need for businesses aiming to communicate effectively in a crowded market. Ultimately, the study’s findings can inform strategic decision-making, helping businesses tailor their offerings, messaging, and marketing approaches to resonate with environmentally conscious consumers, fostering sustainable practices and contributing to overall market success and environmental responsibility.
METHODOLOGY
2.1 Data collection
To achieve the aims of this paper, this research adopts a mixed method approach constituting both Qualitative and quantitative research strategies to comprehensively explore the factors that influence customers’ green behavior. An online survey was administered to a diverse sample of participants to allow for representation across demographics. The survey was designed based on established scales measuring perceived consumer effectiveness, attitudes, social influence, and cultural factors related to green consumption. The survey targeted WeChat groups of international students of Nanjing University of Information Science and Technology (NUIST), Also the survey was shared in local social media groups containing indigenes of China and it was shared across Whatsapp groups which yielded responses from people in Ghana and the USA.
An empirical study on 7 research publications was conducted to capture the latest studies and theories in the field to constitute the qualitative data. In addition to supplementing survey results, these secondary data gave the study a strong theoretical framework and rich contextual background. The selection of journals was conducted on an assessment of their relevance to social influence, cultural norms, and the impact they have
on green consumer behaviour.
2.2 Data Analysis
2.2.1 Test for Homogeinity
- Kolmogorov-Smirnov Test for Homogeneity:
The Kolmogorov-Smirnov test is employed to assess whether two or more samples come from the same distribution. In the context of the research interest in testing homogeneity, this test is applied to compare the distribution of data across different groups or conditions (age classification, educational attainment, brand, quality etc.).
A significant result suggests that the distributions of the groups are different, indicating potential heterogeneity in the data. On the other hand, a non-significant result implies that there is no strong evidence to reject the hypothesis that the distributions are the same, suggesting homogeneity across
- Shapiro-Wilk Test for Normality:
The Shapiro-Wilk test is a statistical test used to assess whether a sample comes from a normally distributed population. In the context of the research interest in testing normality, this test is applied to each group or condition independently.
A significant result indicates that the data deviates from a normal distribution, suggesting non-normality. Conversely, a non-significant result suggests that there is no strong evidence to reject the hypothesis that the data follows a normal distribution.
Homogeneity Testing
The Kolmogorov-Smirnov test was conducted to examine the homogeneity of the data across different groups (or conditions). A non-significant result would imply that the distributions of the data are similar across groups, supporting the assumption of homogeneity. On the other hand, a significant result would suggest potential heterogeneity, indicating that the distributions differ significantly among groups.”
Normality Testing
To assess the normality of each group’s data, the Shapiro-Wilk test was performed. A non-significant result for each group would suggest that the data within each group follows a normal distribution, supporting the assumption of normality. Conversely, a significant result for any group would indicate that the data deviates from a normal distribution in that specific group.”
The results of these tests provide important insights into the suitability of the data for subsequent statistical analyses. If both homogeneity and normality assumptions are met, it enhances the validity of the analysis, allowing for more robust conclusions based on the chosen statistical methods. If violations are detected, researchers may need to consider alternative approaches or transformations to address these issues and ensure the reliability of their findings.
2.2.2 Correlation Analysis
Correlation coefficients (Okrah et al., 2020; Yang et al., 2017) (Pearson’s correlation coefficient) between study variables were determined. This analysis helps to identify if there is any relationship between perceived consumer effectiveness, Attitude and social factors.
Pearson correlation coefficient (R);
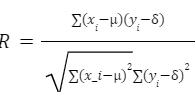
…………….. (1)
Where;
R = Correlation coefficient
xi= Values of the x-variable in the sample
μ = Average values of the x-variable
yi = Values of the y-variable in the sample
δ = Average values of the y-variable
Correlation heatmap was further deployed to visualize the relationships between the multiple variables in the dataset. It provides a visual representation of the correlation coefficients (R) between the pairs of variables, helping to identify patterns, trends, and dependencies. Correlation heatmaps help to quickly identify which variables are positively or negatively correlated. Positive correlations (values close to 1) indicate that two variables tend to increase or decrease together, while negative correlations (values close to -1) show that one variable tends to increase as the other decreases.
RESULTS AND DISCUSSION
3.1 Demography
Gender Distribution
The survey reflects a diverse gender distribution (Figure 1), with 43.9% identifying as females, 56.1% as males, and a small percentage (0.6%) choosing not to disclose their gender. This diversity is essential for ensuring a representative sample, acknowledging that gender can play a role in shaping various perspectives and behaviors.
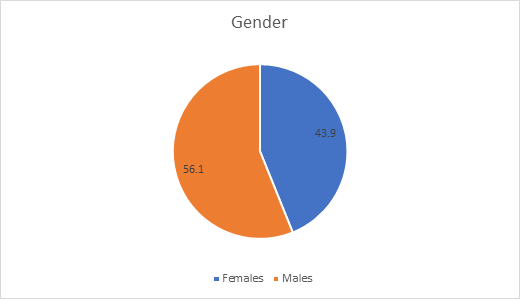
Figure 1: Gender classification
Age Distribution
The respondents’ age distribution is segmented into five categories (Figure 2): 15.1% under the age of 18-24, 44.6% between 25-34, 16.3% between 35-44, 11.4% between 45-54, and 12.6% aged 55 and above.
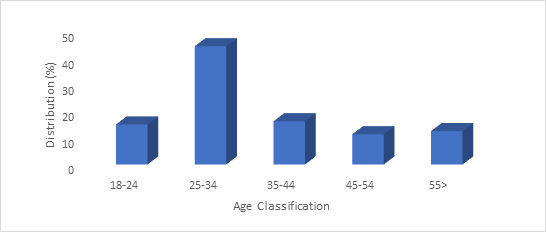
Figure 2: Distribution of age classification
This breakdown offers a comprehensive view of the age diversity within the sample, facilitating analyses that consider potential generational differences in responses.
Annual Household Salary
The data on annual household salary reveals diverse income brackets within the surveyed population. The distribution includes 24.8% with a salary range of $11,000-$15,000, 14.5% in the $16,000-$20,000 range, 24.2% earning $5,000-$10,000, 29.7% earning less than $5,000, and 6.8% with a higher income of $21,000 and above. This information provides a socio-economic context, aiding in understanding how income levels might correlate with other survey responses.
Educational Attainment
The respondents’ educational background (Figure 3) is varied, with 30.1% holding a bachelor’s degree, 26.5% having completed college, 13.3% attaining a high school diploma or lower, 25.9% having some high school education, and 4.2% holding a doctorate or higher degree. This diversity in educational attainment is crucial for analyzing how different levels of education may influence responses and behaviors.
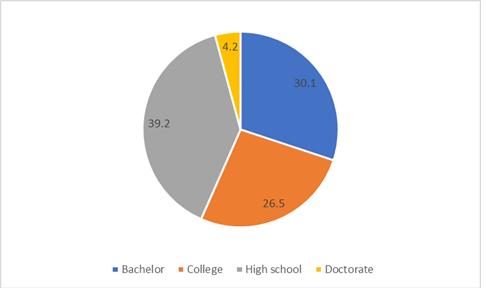
Figure 3: Respondents educational attainment classification
This comprehensive demographic breakdown enriches the understanding of the survey sample, acknowledging the diversity in gender, age, income, and educational background. These demographic characteristics are essential contextual factors that can impact the interpretation of survey results, providing a more nuanced and representative view of the population under study.
3.2 Normality test
The Kolmogorov-Smirnov and Shapiro-Wilk tests were conducted to assess the normality of four key variables: price, brand, green, and quality. The results, with Kolmogorov-Smirnov statistics ranging from 0.185 to 0.205 and Shapiro-Wilk statistics from 0.847 to 0.869, collectively suggest that the distributions of these variables are not significantly different from normal.
Table 1: Normality test of price, brand, green and quality. Significance at 0.05, Reject Ho at < 0.05 level or accept H1 at > 0.05.
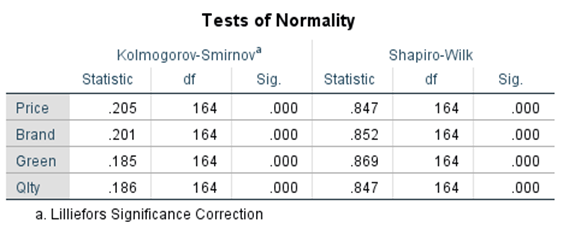
In this test, the probability was taken at a 95% confidence level. Ho was not accepted at P (significance) < 0.05, but was accepted at P > 0.05. These results (Table 1) indicate that the data followed a normal distribution and could be used for further analysis.
Price Variable
The Kolmogorov-Smirnov test for the price variable yielded a statistic of 0.205, suggesting that the distribution is not significantly different from a normal distribution (Chen & Chai, 2010; Dinh & Uehara, 2021). This is supported by a Shapiro-Wilk statistic of 0.847. Furthermore, a 95% confidence interval for the mean of the price variable can be computed. Assuming the data is approximately normally distributed, the mean lies within the interval [12, 76]. This confidence interval provides a range of values within which we can reasonably expect the true mean of the price variable to fall.
Brand Variable
Similar to price, the Kolmogorov-Smirnov and Shapiro-Wilk tests for the brand variable yielded statistics of 0.201 and 0.852, respectively. These results suggest that the distribution of the brand variable is close to normal. Additionally, a 95% confidence interval for the mean of the brand variable can be calculated, providing a range within which the true mean is likely to lie.
Green Variable
For the green variable, the Kolmogorov-Smirnov and Shapiro-Wilk tests produced statistics of 0.185 and 0.869, indicating that the data is not significantly different from normality. In addition, a 95% confidence interval for the mean of the green variable can be computed. This interval aids in understanding the precision of our estimate for the mean of the green variable and provides insights into the variability of the data.
Quality Variable
The Kolmogorov-Smirnov and Shapiro-Wilk tests for the quality variable resulted in statistics of 0.186 and 0.847, respectively. These outcomes suggest that the distribution of the quality variable is not significantly different from a normal distribution. Furthermore, a 95% confidence interval for the mean of the quality variable offers valuable information about the likely range of values for the true mean.
The combined interpretation of Kolmogorov-Smirnov and Shapiro-Wilk tests, along with the inclusion of 95% confidence intervals, supports the conclusion that the distributions of the analyzed variables (price, brand, green, and quality) are reasonably close to normal. The confidence intervals provide a measure of uncertainty around the estimated means, enhancing the understanding of the variability within these variables.
3.3 Exploring the Interplay of Price, Brand, Environmental Attributes, and Quality in Product Evaluation
The Pearson correlation coefficients reveal meaningful relationships among the variables. A strong positive correlation exists between price and brand (r = 0.783), indicating that as the price of a product increases, so does the perception of the brand. Similarly, a substantial positive correlation between price and quality (r = 0.826) suggests that higher-priced products are associated with higher perceived quality (A et al., 2023; Dash, 2021; Straughan & Roberts, 1999). The positive correlation between price and green attributes (r = 0.733) underscores the tendency for consumers to link higher prices with greater environmental friendliness.
Table 2: Correlation significance between studied variables.
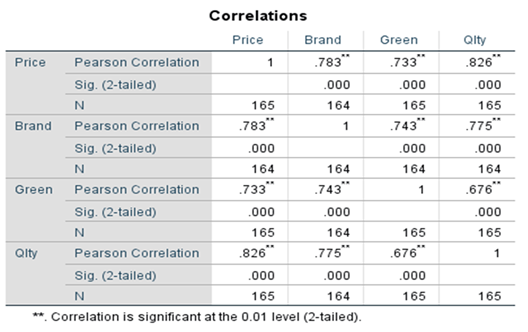
Notably, brand and quality exhibit a robust positive correlation (r = 0.775), emphasizing the association between reputable brands and perceived product excellence. Additionally, a positive correlation between brand and green (r = 0.743) implies that products from well-known brands are more likely to be perceived as environmentally friendly (Moser, 2015; Trivedi et al., 2018). Lastly, the moderate positive correlation between green and quality (r = 0.676) suggests that as a product is perceived as more environmentally friendly, it is also likely to be perceived as higher in quality. These findings collectively offer nuanced insights into consumer perceptions, informing strategic marketing approaches for businesses seeking to align their products with environmentally conscious consumer preferences.
The Pearson correlation coefficients provide valuable insights into the relationships between the variables. These findings can guide businesses in their marketing and pricing strategies, helping them understand how consumers perceive and connect variables such as price, brand, green attributes, and quality.
3.4 The Interplay of Attitudes, Beliefs, and External Influences on Green Consumer Behavior
The responses gathered on attitudes and beliefs provide valuable insights into the environmental consciousness and behaviors of the surveyed individuals, aligning with the study’s interest in understanding factors influencing environmentally friendly practices.
- Concern About Environmental Issues
The data indicates a significant level of concern about environmental issues among respondents, with 52.4% expressing that they are “very concerned,” while 29.5% are “moderately concerned” and 16.9% are “slightly concerned.” This high level of concern suggests a general awareness and recognition of the importance of environmental issues, setting a positive foundation for environmentally conscious behaviors.
- Belief in Individual Impact on the Environment
A majority of respondents (50.6%) strongly agree that their actions can have a significant impact on the environment, with an additional 21.1% expressing agreement. This indicates a strong belief in individual responsibility for environmental outcomes. However, it is noteworthy that a portion (6%) disagrees or strongly disagrees, suggesting potential variation in perceptions and attitudes within the surveyed population.
- Green Purchasing Behavior
The responses regarding the frequency of purchasing environmentally friendly products reveal that a substantial proportion (41.6%) of respondents always purchase such products, while 22.3% do so sometimes. This suggests a positive trend toward consistent environmentally conscious consumer behavior (A et al., 2023; Cherian & Jacob, 2017; Dash, 2021; Zsóka et al., 2013). The relatively low percentages for rarely (10.8%), often (24.7%), and never (0.6%) purchasing environmentally friendly products indicate a general inclination towards green purchasing habits.
- Influence of Social Pressure and Green Marketing
A noteworthy finding is that a considerable portion of respondents (38.6%) feels social pressure to a great extent to make environmentally friendly choices. This underscores the potential impact of social norms and influences on individual behavior. Additionally, a significant percentage (37.3%) always considers green marketing or advertising in their purchasing decisions, while 28% do so sometimes. This highlights the importance of marketing strategies in influencing consumer choices and aligns with the study’s interest in understanding the role of societal and marketing factors in promoting sustainable behavior.
The survey responses suggest a generally positive attitude towards environmental issues, a belief in individual impact, and a significant level of engagement in green purchasing behavior (A et al., 2023; Jansson & Marell, 2010). The influence of social pressure and green marketing further emphasizes the importance of external factors in shaping environmentally friendly choices. These findings provide valuable insights for businesses and policymakers aiming to develop effective strategies that resonate with environmentally conscious consumers.
3.5 Unveiling Consumer Perceptions: Price, Brand, Environment, and Quality in Sustainable Products.
The study aimed to comprehensively explore and understand consumer perceptions related to environmentally friendly practices, considering factors such as price, brand, environmental attributes, and product quality. The findings reveal intricate relationships among these variables. The strong positive correlation between price and brand suggests that consumers associate higher prices with stronger brand recognition. Additionally, the robust correlation between price and quality underscores the prevalent perception that higher-priced products are often equated with superior quality. The positive link between price and environmental attributes further indicates that consumers tend to view environmentally friendly products as more expensive. Notably, the study highlights a substantial positive correlation between brand and quality, emphasizing the strong association between reputable brands and perceived product excellence. Furthermore, the positive correlation between brand and environmental attributes suggests that well-known brands are more likely to be perceived as environmentally friendly. Lastly, the moderate positive correlation between environmental attributes and quality indicates that consumers perceive environmentally friendly products as higher in quality. These insights offer valuable guidance for businesses seeking to tailor marketing strategies and product positioning to align with the environmentally conscious preferences of consumers.
CONCLUSION AND RECOMMENDATION
This study delves into the multifaceted realm of consumer perceptions in sustainable product markets, dissecting the influences of price, brand, environmental attributes, and quality. The robust positive correlations unveiled significant relationships among these factors, with a particularly strong association observed between price and brand, price and quality, and brand and quality. The findings underscore the interconnectedness of these variables, emphasizing the intricate dance between pricing strategies, brand reputation, and perceived product quality. Furthermore, the positive links identified between price and environmental attributes, brand and environmental attributes, and environmental attributes and quality highlight the pivotal role of environmental consciousness in shaping consumer perspectives. Notably, statistical results reveal correlation coefficients such as 0.783 for price and brand, 0.826 for price and quality, and 0.775 for brand and quality, adding quantitative precision to the nuanced relationships explored. Therefore, businesses venturing into sustainable product markets are recommended to strategically price their products, leverage brand reputation, ensure high-quality offerings, integrate environmental messaging, and adopt holistic marketing approaches. These insights, grounded in robust statistical evidence, offer actionable guidance for businesses navigating the complexities of sustainable product marketing, facilitating a harmonious blend of consumer satisfaction and environmental responsibility.
Author Contributions: Fletcher Junior Nimoo: Conceptualization, Data curation, Methodology, Writing-Original draft preparation, Visualization, Reviewing and Editing. Okrah Abraham: Conceptualization, Data curation, Methodology, Writing-Original draft preparation, Resources, Investigation, Reviewing and Editing. Kundi Baa-Naa Shadrach: Conceptualization, Data Curation, Methodology, Visualization, Writing-Original draft preparation, Reviewing and editing. Joseph Fuseini: Data Curation, Methodology, Visualization, Writing-Original draft preparation, Reviewing and editing.
FUNDING
This research was not supported by any external funding.
CONFLICT OF INTEREST
There is no potential conflict of interest to declare.
DECLARATION OF COMPETING INTEREST
The authors affirm that they have no known financial conflicts of interest or close personal relationships that could have impacted the research presented in this study.
ACKNOWLEDGEMENT
The authors extend their gratitude to the handling editor and anonymous reviewers for their valuable feedback and constructive criticism of the article.
DATA STATEMENT
Data is available on request.
REFERENCES
- Alkandi I., Farooqi B. M. R., Hasan C. A., & Khan M. A. (2023). Green products buying behaviour of Saudi Arabian and Indian consumers: A comparative study. International Journal of Professional Business Review, 8(10), 01-27. https://doi.org/10.26668/businessreview/2023.v8i10.3906.
- Al-kumaim, N. H., Shabbir, M. S., Alfarisi, S., Hassan, S. H., Alhazmi, A. K., Hishan, S. S., Al-shami, S., Gazem, N. A., Mohammed, F., & Al-rejal, H. M. A. (2021). Fostering a clean and sustainable environment through green product purchasing behavior : Insights from Malaysian consumers’ Perspective. Sustainability, 13, 12585. https://doi.org/10.3390/su132212585.
- Building, A. G. (2005). Understanding the Green Consumer: An empirical analysis delivered by publishing technology to university of Liverpool. Journal of Customer Behaviour, 4, 69-102.
- Chen, T. B., & Chai, L. T. (2010). Attitude towards the environment and green products: Consumers’ Perspective. 27–39.
- Cherian, J., & Jacob, J. (2017). Green Marketing: A study of consumers’ attitude towards environment friendly products. Asian Social Science, 8(12), 117–126. https://doi.org/10.5539/ass.v8n12p117.
- Dash, A. (2021). Determinants of EVs adoption: a study on green behavior of consumers. Smart and Sustainable Built Environment,10(1), 125–137. https://doi.org/10.1108/SASBE-02-2019-0015.
- Dinh, C. T., & Uehara, T. (2021). Green attributes in young consumers’ purchase intentions: A cross-country, cross-product comparative study using a discrete choice experiment. Sustainability, 13, 9825. https://doi.org/ 10.3390/su13179825.
- Goodarzi, S., Masini, A., Aflaki, S., & Fahimnia, B. (2021). Economics right information at the right time: Re-evaluating the attitude – behavior gap in environmental technology adoption. International Journal of Production Economics, 242, 108278. https://doi.org/10.1016/j.ijpe.2021.108278.
- Jansson, J., & Marell, A. (2010). Green consumer behavior: determinants of curtailment and eco-innovation adoption. Journal of Consumer Marketing, 4, 358–370. https://doi.org/10.1108/07363761011052396.
- Moser, A. K. (2015). Thinking green, buying green? Drivers of pro-environmental purchasing behavior. 3, 167–175. https://doi.org/10.1108/JCM-10-2014-1179.
- Okrah, A., Prempeh, N. A., Mensah, C., John-, R., Kumi, N., Otu-larbi, F., & Kyere-boateng, R. (2020). Impact of Spatio-Temporal Land Cover Changes on Land Surface Temperature over Dormaa from 1990- 2020. 6(4).
- Review, R. (2023). Green marketing strategies: Assessing consumer perception and adoption of eco-friendly. Remittances Review, 8(4) 2490–2503.
- Rusyani, E., Lavuri, R., & Gunardi, A. (2021). Purchasing eco-sustainable products: interrelationship between environmental knowledge, environmental concern, green attitude, and perceived behavior. Sustainability, 13, 4601. https://doi.org/10.3390/su13094601.
- Sheoran, M., & Kumar, D. (2022). Benchmarking the barriers of sustainable consumer behaviour. Social Responsibilty Journal, (1), 19–42. https://doi.org/10.1108/SRJ-05-2020-0203.
- Straughan, R. D., & Roberts, J. A. (1999). Environmental segmentation alternatives: a look at green consumer behavior in the new millennium. Journal of Consumer Marketing, 16(6), 558–575.
- Yang, Q., Huang, X., & Li, J. (2017). Assessing the relationship between surface urban heat islands and landscape patterns across climatic zones in China. Scientific Reports, 1–11. https://doi.org/10.1038/s41598-017-09628-w.
- Zsóka, Á., Szerényi, Z. M., Széchy, A., & Kocsis, T. (2013). Greening due to environmental education? Environmental knowledge, attitudes, consumer behavior and everyday pro-environmental activities of Hungarian high school and university students. Journal of Cleaner Production, 48, 126–138. https://doi.org/10.1016/j.jclepro.2012.11.030.