
The Impact of Migrants’ Remittances on Rural Development in Benue State, Nigeria
- Joseph Enefu
- Rhoda Mundi
- Samuel Panse Dakyes
- 211-224
- Apr 7, 2024
- Mathematics
The Impact of Migrants’ Remittances on Rural Development in Benue State, Nigeria
Joseph Enefu1*; Rhoda Mundi2 and Samuel Panse Dakyes3
1Department of Geography, Benue State University, Makurdi-Nigeria).
2 ,3(Department of Geography and Environmental Management, University of Abuja, Nigeria).
*Corresponding Author
DOI: https://doi.org/10.51584/IJRIAS.2024.90321
Received: 21 February 2024; Accepted: 06 March 2024; Published: 07 April 2024
ABSTRACT
The study assessed the role of migrants’ remittances in rural development in Benue State, Nigeria. The objectives of the study were to ascertain the relationship between migrants and their home of origin as well as the contribution of migrants to rural development in Benue State. A total of 1202 respondents were selected from 55 rural settlements and used for the study. The rural communities and respondents were selected through multi-stage sampling technique involving purposive, simple random, judgement and snowball sampling. Data were obtained through questionnaire. Descriptive statistical tools like frequencies and percentages were used for data analysis. Tables and plates were used for data presentation. The study found that 60.1% of the respondents are male. Most respondents (23.7%) are within age 50-54 years. Most respondents are married (79.8%) and have children. The ratio of migrants to respondent is 2.5. Migrants sent remittance to home of origin for community development; the remittances were used for school, electricity, hospital and road construction. The study recommends that migration should be coordinated to enhance its advantage. To ensure rural development, government, communities, private individuals and migrants should collaborate in funding infrastructural facilities in rural communities that are interested in self-help project in the State.
Keywords: Role, Migrants, Remittance, Rural, infrastructure and Development.
INTRODUCTION
Migration is a global phenomenon. It is the movement of people from one place to another with the intention of staying at the destination temporary or permanently as a result of one’s volition or compulsion (Umoh, 2001). Human have been migrating over the years. Statistics shows that was increased in global international migration from 258 million people in 2018 to 281 million in 2022 (United Nations (UN), 2018; International Organisation for Migration (IOM), 2022) while, the volume of global internal migration increased from 740 million people in 2009 (IOM, 2018) to 763 million people in 2021 (Food and Agricultural Organisation ((FAO), 2021). Though migration data are difficult to come by, a survey on internal migration in Nigeria by NPC (2010) indicates that the volume of internal migration in Nigeria was 25% in the year 2010. The most recent migration survey in Nigeria in 2021 by indicates that 29.8% of women and 28.8% of men who migrated said they did so over 10 years ago (National Bureau of Statistics (NBS) and United Nations Children’s Fund (UNICEF) (2022). Majority of the migrants crossed border in search of better economic and social opportunities. (Ikwuyatum, 2016; IOM, 2018). The drivers of migration were categorised into physical, economic, social, cultural and political factors. Factors affecting migration are often group into push and pull factors at the areas of origin and destination respectively. Push factor compel people to move from home of origin whilr the pull factors attract potential migrants to the destinations areas (Lee, 1966: Mundi, 1998: Kainth, 2009 and Hassan, 2013).
Migration has demographic, social, economic, cultural and political consequences in areas of origin and destination of migrants. The effects vary within the home of origin and destinations (Adger, Kelly, Winkels, Huy and Locke, 2002; Ode, 2006). Furthermore, Knodel and Saengtiechai (2007) observed that the departure of migrants has negative effect on labour supply thereby affecting farm size, production and income of rural farmers at the source region. As compensation for loss of labour, the home of origin received migrants’ remittances in the form of money and goods. While such remittances can be used for personal and community development purposes, migrants are also directly involved in providing infrastructures in their communities (Umoh, 2001; Ajaero and Onokala, 2013).
Remittance is the transfer of money by a worker to the home of origin. It also includes other form of transfers such as social remittances (diffusion of various types of social practices, ideas and values), knowledge or technology remittances (knowledge, skills and technology brought back by returning migrants), and political remittances as changing identities and political awareness influenced by the returned migrants (Goldring, 2004). Migrant workers contribute to the economies of their host communities/country, while the remittances they sent to their home of origin helps in boasting the economies of the home of origin (International Labour Organization, 2009). Remittance inflows have been increasing significantly in Nigeria over the past decades. They are becoming one of the most constant sources of economic growth and development (Adeseye, 2021). The World Bank (2018) opined that remittance remains a vital element of economic growth. It estimated that about $160 billion is transferred annually through official channels. Furthermore, International remittance grew up to $689 billion in 2017 and $633 billion in 2018. Egypt and Nigeria received the greatest remittance inflow than any other country in Africa in 2018. Nigeria received remittance to the tone of $19.7 billion in 2016, $22 billion in 2017 and $24.3 billion in 2018. Benmamoun and Lehnet (2013) posited that workers’ remittances are often impelled by the desire of migrants to support their families, friend and investment at their home of origin thus allowing the recipients to invest in building of houses, financing education and creating avenues for poverty reduction in home community. A study by Adu-Okoree and Onoma, (2012), asserts that a large number of respondents (50%) indicated that they were more prepared to contribute to community development funds. Majority of the respondents prefer to send remittances for church, school and the building of a community centre in Ghana.
Migration and remittance is increasingly been considered as a force that can influence development. The attention of this study was drawn by the concern for the increase in migration of youth from rural to areas in Benue State to other places in Nigeria and beyond as well as its effect on the society. Frequently, potential migrants find it worthwhile to leave their settlements other destination particularly the urban areas. One of the important aspects of this movement that cannot be overemphasizes is remittances sent home by the migrants to caution the effect of out-migration on the rural population. Therefore, this study examined the relationship between migrants and their home of origin as well as the role of migrants’ remittances in rural development in the study area.
THE STUDY AREA
Benue State lies between Latitude 6025ˈ and 808ˈ North of the Equator and Longitude 7047ˈ and 1000ˈ East of the Greenwich Meridian. The State has boundary with Nasarawa State in the North, Kogi State in the West, Taraba State in the North East, Cameroun Republic in the South East, Cross River State, and Ebonyi in the South and Enugu State in the South West. The State comprises 23 Local Government Area (L.G.A) occupying a landmass of 32,818.43km2 as indicated on Figure 1 (Lyam, 2005; Ministry of Lands and Survey, 2021; Benue State Government, 2015).
The State has a population of 2,753,077 people and a density of 84 persons per km2 in 1991. Whereas, in 2006 the State had 4,253,641 persons with a density of 130 persons per km2 (National Population Commission (NPC), 2009). It has a projected population of 6,298765 persons and a density of 192 per km2 in 2018. The State comprises many ethnic groups inhabiting its territory. Among, these are the Tiv, Idoma, Igede, Etulo, Jukun, Yoruba, Hausa, Igbo (NPC, 2009 and Benue State Ministry of Health, 2009). The Tiv who occupy Zone A and B Senatorial Districts are the major ethnic group followed by the Idoma and Igede in Zone C Senatorial District.
Figure 1: Benue State Showing the Showing the Local Government Area of Study
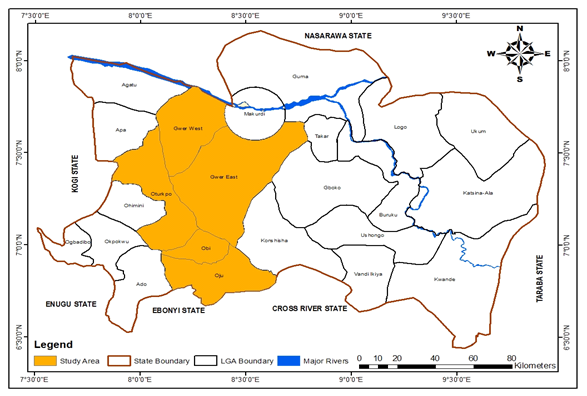
Source: Ministry of Lands and Survey, Makurdi (2021)
MATERIALS AND METHODS
The target population comprised every male and female heads of households (respondents) who are within the age of 40-74 years currently residing in rural settlements within Benue State. The age category was chosen to allow the study collect data from the respondents who have households outside their home of origin (out-migrants). The study used 1276 respondents selected from 55 rural communities comprising 25520 households as at 2018 (Projected from NPC, 2009) as indicated on Appendix 1. The study was stratified across the three major ethnic groups in the State (Tiv, Idoma and Igede as indicated on figure 1) covering five (5) L.G.A (Gwer-West, Gwer-East, Otukpo, Oju and Obi) of the state. The selected L.G.As forms 20% of the 23 L.G.As in Benue State.
The study used questionnaire to collect data on age, sex, marital status and family size of the respondents in the rural settlements. The study also collected data on the number of out-migrants from the family of each respondent family, migrant’s remittances status and contribution to rural development in migrants’ home of origin in the State.
The study used multi-stage sampling technique in selecting the L.G.As, rural settlements (communities) and the expected sample population in each settlements of study. The first stage is the determination and selection of five (5) L.G.As (20% of the 23 L.G.As) in the State. These include Oju, Obi, Otukpo, Gwer West, and East L.G.As via purposive sampling technique. The basis for using purposive sampling technique is to enable the study to cut across the major ethnic groups (Tiv, Idoma and Igede) of the study area. The second stage involved the determination of the number of rural settlements for the study. The study used 55 rural settlements (10% of the 548 settlements) in the five (5) selected L.G.As of study. Besides, Gupta (2013) stated that a minimum of 5-10% of a parent population is good for any study. The third stage is the selection of the 55 rural settlements via simple random sampling technique using a table of random numbers. The fourth stage is the determination of the number of the respondents from the selected rural settlements with a population of 25520 household heads. The total sample size required respondents for the study is 1276 respondents (5% of 25520 total household heads). The study used 5% because it was considered good enough for a study of this nature which is in line with Gupta (2013) who stated that a good sample size ranged between 5-10% of the parent population.
The fifth stage is the subsequent selection of 1276 respondents (household’s head) from the available households (25520) via judgement and snowball sampling technique. The justification for using judgement-sampling technique is that, it allows the study to decide and collect data from only the household heads that have at least one of their children out-side their home of origin as out-migrants since the study-involved people who must have out-migrants as children based on the judgement of the study. The snowball sampling technique enabled connection and referrals to the unknown elements (migrant’s family) of the study population by the known elements. Through this method, few migrants’ family were identified through inquiry, and those families helped to unravel the location of similar family within the same settlement. This easily method enabled the identification of the farmers with out-migrants in the study area.
The data were analysed via frequency and percentages while the results was presented via table and plates based on 1202 valid questionnaire that was returned and analysed.
RESULTS AND DISCUSSION
4.1 Sex of the Respondents
The study shows that the male respondents were 60.1% while the female were 39.9%. More males were used for the research than the females. Furthermore, at the L.G.A level, more males than females were also used for the study in Otukpo (58.9% and 41.1%), Oju (51.0% and 49.0%), Obi (58.5% and 41.5%), Gwer-West (75.6% and 24.4%) and Gwer-East (61.7% and 38.3%) as indicated on table 1. The males dominate the study because majority of them volunteered to participate in the study compared to the females. This finding is similar to the study by Ayiti and Adedlokun (2023) which used more male (61%) respondents compared to 39 % female migrant sending respondents who availed themselves for the study in rural areas in Ekiti State.
4.2 Age Category of the Respondents
Age category of the respondents was revealed on able 1. The study shows that 23.7% of the respondents were age 50-54 years while 19.4% were age 55-59 years. More so, 17.6% were within the age category 60-64 years and 15.3% were 45-49 years. The least age category is age 40-44 years (7.9%) and age 70 years above (6.8%). This is consistent with the finding of similar study by Etima, Thompsonb, and Asa (2020), who posited that most of the migrants sending respondents (75%) are within economically active and productive age (41-60 years).
4.3 Marital Status of the Respondents
The research reveals that majority (79.8%) of the respondents were married, 14.6% were widowed, and 2.7% were separated while 2.8% were either divorced or single as indicated on table 1. All the Local Government Areas have a high proportion of married respondents; with Gwer-West having 85.6%, Obi (81.6%) and Gwer-East (80.9%) compared to Otukpo (77.4%) and the Least was Oju (76.2%). The lower the level of separation, divorced, widowed and the higher the level of marriage among the respondents, the greater the tendency of having large household. This agrees with the finding of similar study by Enefu and Ikyernum (2016), which assert that most rural dwellers are married as indicated by 88.9% of the respondents.
4.4 Respondents’ Household (Family) Size
The study examined the size of the respondents’ household in rural communities of the study area. Table 1 reveals that majority of the respondents (54.2%) had 4-6 children, 20.7% had 7-9 children, 19.2% had 1-3 children while 5.8% had 10 children and above. The mean number of households per family is 5.4 children. This is slightly above the mean ideal number of children per family in Benue State (5.1 Children) reported by NPC and ICF (2019). Also, the mean number of children reported by this study is slightly less than the total fertility rate (5.9) for rural areas in Nigeria reported by NPC and ICF (2019). By implication, the population of Benue State is increasing irrespective of out-migration. Similarly, in all the L.G.As, majority of the respondents opined that they have 4-6 children as opined by 61.3% of the respondents in Otukpo, Obi (57.8%), Gwer-East (56.5%) and Gwer-West (52.8%) while Oju has the least (45%). Also all the L.G.As has respondents with 10 children and above with Otukpo L.G.A (8.9%) in the lead. Large family size is advantageous to the respondents particularly farmers in rural areas because it acts as a source of labour supply for farming. The respondents had 6508 households. This comprises 3425 household members that currently reside at the home of origin while 3083 were out-migrants residing outside the home of origin. The ratio of migrants to respondent is 2.5 migrants.
Table 1: Demographic and Social Characteristics of the Respondents by L.G.A
| Variables | L.G.A | Total (%) | ||||
| Otukpo (%) | Oju (%) | Obi (%) | Gwer-West (%) | Gwer-East (%) | ||
| Sex | ||||||
| Male | 146 (58.9) | 152( 51.0) | 86(58.5) | 136(75.6) | 203(61.7) | 723(60.1) |
| Female | 102 (41.1) | 146 (49.0) | 61(41.5) | 44 (24.4) | 126 (38.3) | 479 (39.9) |
| Age Category | ||||||
| 40-44 | 8(3.2) | 47(15.8) | 14(9.5) | 14(7.8) | 12(3.6) | 95(7.9) |
| 45-49 | 37(14.9) | 40(13.4) | 29(19.7) | 28(15.6) | 50(15.2) | 184(15.3) |
| 50-54 | 63(25.4) | 49(16.4) | 30(20.4) | 37(20.6) | 106(32.2) | 285(23.7) |
| 55-59 | 61(24.6) | 32(10.7) | 34(23.1) | 22(12.2) | 84(25.5) | 233(19.4) |
| 60-64 | 34(13.7) | 67(22.5) | 24(16.3) | 42(23.3) | 45(13.7) | 212(17.6) |
| 65-69 | 19(7.7) | 38(12.8) | 8(5.4) | 22(12.2) | 24(7.3) | 111(9.2) |
| 70 Above | 26(10.0) | 25(8.4) | 8(5.4) | 15(8.3) | 8(2.4) | 82(6.8) |
| Marital Status | ||||||
| Married | 192(77.4) | 227(76.2) | 120(81.6) | 154(85.6) | 266(80.9) | 959(79.8) |
| Single | 1(0.4) | 3(1.0) | 0(0.0) | 1(0.6) | 2(0.6) | 7(0.6) |
| Separated | 10(4.0) | 5(1.7) | 2(1.4) | 7(3.9) | 9(2.7) | 33(2.7) |
| Divorced | 6(2.4) | 6(2.0) | 5(3.4) | 4(2.2) | 6(1.8) | 27(2.2) |
| Widowed | 39(15.7) | 57(19.1) | 20(13.6) | 14(7.8) | 46(14.0) | 176(14.6) |
| Household Size | ||||||
| 1-3 | 29(11.7) | 80(26.8) | 26(17.7) | 34(18.9) | 62(18.8) | 231(19.2) |
| 4-6 | 152(61.3) | 134(45.0) | 85(57.8) | 95(52.8) | 186(56.5) | 652(54.2) |
| 7-9 | 45(18.1) | 67(22.5) | 28(19.0) | 41(22.8) | 68(20.7) | 249(20.7) |
| 10 Above | 22(8.9) | 17(5.7) | 8(5.4) | 10(5.6) | 13(4.0) | 70(5.8) |
| Total Household | 1390 | 1586 | 801 | 985 | 1746 | 6508 |
| Mean no of Children | 5.6 | 5.3 | 5.4 | 5.4 | 5.3 | 5.4 |
| Household at Home | 761 | 735 | 436 | 541 | 1042 | 3425 |
| Total Out-migrants | 719 | 851 | 365 | 444 | 704 | 3083 |
| Ratio of Migrants | 2.8 | 2.8 | 2.4 | 2.4 | 2.1 | 2.5 |
| Total | 248(100) | 298(100) | 147(100) | 180(100) | 329(100) | 1202(100) |
Source: Field Work, 2019
4.5 Migrants Remittances to Community (Home) of Origin
The study revealed that migrants sent remittances to their respective home of origin for community development as indicated on table 2. The study revealed that 51.2% of the respondents opined that migrants occasionally send remittances for to their home of origin for community development while 29% of the respondents said migrants do not send remittances to their home of origin. Similarly, 19.8% of the respondents said that they are not sure whether migrants send remittances to their homes of origin. Furthermore, migrants from Otukpo and Oju L.G.A did much better in sending remittances for community development than the migrants from Obi, Gwer-West and Gwer-East L.G.As as indicated by 96% and 87.2% of the respondents respectively. By comparison, migrants from Tiv ethnic groups are less concern about community development compared to migrants from Idoma and Igede ethnic groups. The opinion of most of the respondents agreed with a study by Gwanshak, Mohd and Shafie (2021) which established that migrants do contribute to community development projects in rural areas. Migrant’s remittances are very important and useful for community development in various ways as indicated on table 4. This also agrees with the findings of Enefu and Ikyernum (2016) who found out that migrant send monetary remittance for community development in Otukpo L.G.A. Furthermore, Benmamoun and Lehnet (2013), also posited that migrants remits money to their home of origin in Nigeria.
Table 2: Migrants Remittances for Community Development by L.G.A
| Remittances to Community | L.G.A | Total(%) | ||||
| Otukpo(%) | Oju(%) | Obi(%) | Gwer-West(%) | Gwer-East(%) | ||
| Yes | 238(96.0) | 260(87.2) | 42(28.6) | 15(8.3) | 61(18.5) | 616(51.2) |
| No | 8(3.2) | 6(2.0) | 58(39.5) | 103(57.2) | 173(52.6) | 348(29.0) |
| Not Sure | 2(0.8) | 32(10.7) | 47(32.0) | 62(34.4) | 95(28.9) | 238(19.8) |
| Total | 248(100) | 298(100) | 147(100) | 180(100) | 329(100) | 1202(100) |
Source: Field Work, 2019
4.6 Types of Remittances for Community Development Received by the Migrants’ Home of Origin
Migrants send three basic types of remittances to their communities for development. These include money, material and migrants’ connection/influence used for community development as indicated on table 3. All the 616 respondents who said migrants send remittances as indicated on table 2 also opined that monetary remittances is the most common form of remittances send by the migrants to their home of origin for community developments indicated on table 3. Beside, 10.8% of the same respondents agreed that migrants send material things like zinc, cement, desk and chair as contribution for community development while other respondents numbering 7.6% said that migrants do use their connection/influence in attracting projects to their home of origin. In terms of material contribution to rural development by migrants, it is only in Gwer-West L.G.A that migrants did not contribute to community development. Similarly, migrants from Obi and Gwer-East L.G.As did not contribute to their home of origin via migrant’s connection/influence. The implication of monetary remittance to rural community is that, it can be use in diverse ways to enhanced rural development as indicated on table 4. This agrees with the findings of Gartaula (2009) that remittances ranged from money, ideas, knowledge and political awareness. Furthermore, this finding also agrees with the finding of Enefu and Ikyernum (2016) which conclude that migrants do contribute to community development in Otukpo L.G.A of Benue State.
Table 3: Types of Remittances for Community Development by L.G.A
| Types of Remittances | L.G.A | Total(%) | ||||
| Otukpo(%) | Oju(%) | Obi(%) | Gwer- West(%) | Gwer-
East(%) |
||
| Money | 238(100) | 260(100) | 42(100) | 15(100) | 61(100) | 616(100) |
| Materials | 42(17.6) | 13(5.0) | 9(21.4) | 0(0.0) | 3(4.9) | 67(10.8) |
| Migrants’ Connection/Influence | 40(16.8) | 6(2.3) | 0(0.0) | 1(6.7) | 0(0.0) | 47(7.6) |
| Total | 238(38.5) | 260(42.0) | 42(6.8) | 15(2.4) | 61(9.9) | 616(100) |
Source: Field Work, 2019
4.7 Impact of Monetary Remittances on Development at Migrant’s Home of Origin
The study found that monetary remittances was used for various purposes according the need or desire of the recipient community for self-help projects aimed at rural development as indicated on table 4 and plates 1, 2, 3 and 4. The most important use of monetary remittance is providing educational infrastructures and facilities as indicated by 75.4% of the respondents who said that migrants do send remittances for community development. The second most important use of such money is the provision of electricity in rural areas as revealed by 45.5% of the respondents. Some respondents amounting to 22.6% opined that, monetary remittances was used for providing health care centres and facilities in rural communities while 21.6% of the respondents believed that monetary remittance was used for road construction whereas 21.5% stated that monetary remittance was used for other undisclosed purposes. The least use of monetary remittances is building of town hall as indicated by 6.1% of the respondents. The results at L.G.A level shows that Otukpo and Oju L.G.As utilized the remittances sent to community for community development compared to Obi, Gwer-East and Gwer-West. The study concludes that the financial resources that accrued to the migrants’ communities of origin were used for various purposes. The implication of sending and using monetary remittance to rural areas cannot be overemphasized. It helps in bridging the gaps in rural development where the government is unable to provide infrastructure in rural areas. This agree with Gwanshak, Mohd and Shafie (2021), Tacoli and Okali (2001) which revealed that migrants also contributed to community development in rural areas. In addition, World Bank (2023), opined that migration can support poverty reduction and development if it is well managed. Remittances are source of income for children education, health care, housing, and entrepreneurial activities. Similarly, Benmamoun and Lehnet (2013) posited that workers’ remittances are often impelled by the desire of migrants to support their families, friend and investment at their home of origin thus allowing the recipients to invest in building of houses, financing education and creating avenues for poverty reduction in home community.
Table 4: Uses of Monetary Remittances for Community Development by L.G.A
| Uses of Monetary
Remittances |
L.G.A | Total(%) | ||||
| Otukpo(%) | Oju(%) | Obi(%) | Gwer-West(%) | Gwer-East(%) | ||
| Building Town Hall | 51(21.4) | 48(18.5) | 0(0.0) | 0(0.0) | 0(0.0) | 99(16.1) |
| Roads/Culverts | 93(39.1) | 25(9.6) | 14(33.3) | 1(6.7) | 0(0.0) | 133(21.6) |
| School | 221(92.9) | 187(71.9) | 7(16.7) | 12(80.0) | 37(61.7) | 464(75.4) |
| Electricity | 145(60.9) | 113(43.5) | 0(0.0) | 0(0.0) | 22(36.7) | 280(45.5) |
| Hospital | 70(29.4) | 69(26.5) | 0(0.0) | 0(0.0) | 0(0.0) | 139(22.6) |
| Others | 56(23.5) | 37(14.2) | 27(64.3) | 2(13.3) | 1(1.7) | 123(20.0) |
| Total | 238(38.7) | 260(42.3) | 42(6.8) | 15(2.4) | 60(9.8) | 615(100) |
Source: Field Work, 2019
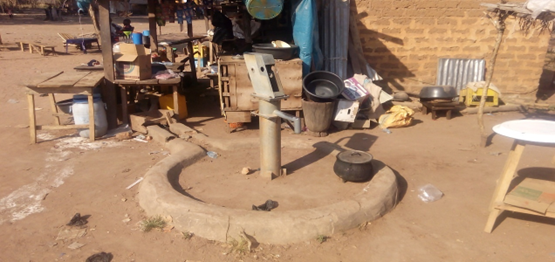
Plate 1: A borehole donated by a migrant at Ikpayongo in Gwer-East L.G.A of Benue State

Plate 2: An Examination Hall renovated by a migrant in Ugboju Community Secondary School, Okpachenyi in Otukpo L.G.A of Benue State
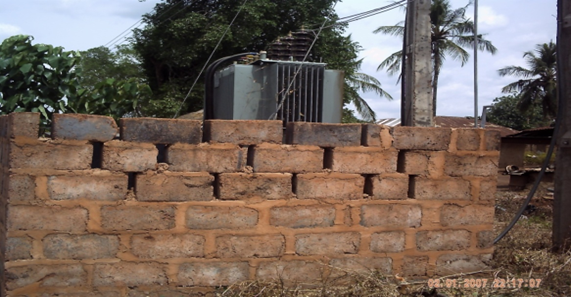
Plate 3: Electricity Transformer donated by a migrant to Jerico-Ugboju in Otukpo L.G.A of Benue State

Plate 4: Football Jersey donated by two migrants to Ipolo-Ugboju in Otukpo L.G.A of Benue State
CONCLUSION AND RECOMMENDATION
The study concludes that migration is going on in the study area; though some of the respondents’ households are still at home of origin while others (3083 household) had migrated to other destinations. Migrants maintain contact with their home of origin. Most migrants contributed finance and other material gift to their home of origin for community development. Some used their connections to facilitates and attract development project. The monetary remittances sent home by the migrants were often used for community development projects in diverse ways like providing additional classrooms/furniture, providing electricity, roads, hospitals and town hall in their home of origin. Migrants’ remittances and its contribution are not limited to Benue State alone. A study by Adger, et al (2002) found that migrants contributed to capital assets (education and health care) in coastal Vietnam. More so, Orozco (2004) opined that the emergence of Hometown Development Associations (HDA) in Mexico provides a formal mechanism for migrants to invest in their communities by financing local development projects at the grassroots level. It is evidently clear that remittance can improve social resilience and promote development in various places, countries and region of the world as indicated by the survey and secondary data if migration is properly coordinated and managed. Succinctly, migration is an important component of demographic transition and environmental change. It is also important to note that while remittances are valuable, they are not a panacea for structural development problems; broader reforms are necessary for societal transformation. Thus, the study recommends that migration should be coordinated to enhance its advantage. In this regard, the National Population Commission should keep track of migrants particularly, the international migrants. To ensure rural development, government, communities, private individuals and migrants should collaborate in funding infrastructural facilities in rural communities that are interested in self-help project in Benue State. This will help in accelerating and balancing infrastructural spread and development between rural communities and urban areas.
ACKNOWLEDGMENT
We are grateful to the team of field assistants for their valuable work in collecting the data that was used for this study.
REFERENCES
- Adeseye, A (2021). The Effect of Migrants Remittance on Economy Growth in Nigeria. An Empirical Study. Open Journal of Political Science, 11, 99-122. https//doi.org/104236/ojps.2021.111007
- Adger, W.N., P .M. Kelly., A. Winkels., L.Q. Huy and C. Locke (2002). Migration, Remittances, Livelihood Trajectories, and Social Resilience. AMBIO: A Journal of Human Environment, 31(4): 358-366.
- Adu-Okoree, I. B and Onoma, O. A (2012). Migrant remittances: A Driving Force in Rural Development. International Journal of Sociology and Anthropology, 4(5): 172-178. DOI: 10.5897/IJSA11.143
- Ajaero, K. C and Onokala, C. P (2013). The Effects of Rural-Urban Migration on Rural Communities of South-Eastern Nigeria. International Journal of Population Research, 2013:1-10. DIO: http://dx.doi.org/10.1155/2013/610193
- Ayiti, O. M and Adedokun, O. C (2023). Impacts of Rural-Urban Migration on Agricultural Development in Ekiti-State, Nigeria. International Journal of Botany and Horticulture Research, 1(1): 10-18
- Benue State Government (2015). Benue State Prospectus. Makurdi, Benue State Government Press.
- Benue State Ministry of Health (2009). Strategic Health Development Plan (2010-2015). Makurdi, Benue State Government Press.
- Benmamoun, R and Lehnet, O (2013). Remittances, Financial Development and Economic Growth in Africa. Journal of Economic and Business, 64, 240-260.
- Enefu, J and Ikyernum, J (2016).The role of Remittances to Rural Infrastructural Development in Otukpo Local Government Area of Benue State, Nigeria. IJIRD, 5(5):219-225
- Etima, A. N.,Thompsonb, D and Asa, A . U (2020).Migrant Remittances and Agricultural Production Under Climate Change: Evidence From Rural Households in Nigeria. Arts and Social Sciences, 1(1): 13–23. DOI: https://doi.org/10.34154/2020-ASSJ-0202-13-23/euraass.
- Food and Agricultural Organisation ((FAO), 2021). Migration. Retrieved on 13/11/2021 from https://www.fao.org/rural-employment/work-areas/migration/en/
- Gartuala, N. H (2009). International Migration and Local Development in Nepal. CNAS Journal, 36(1): 37-65.
- Goldring, L (2004). Family and Collective Remittances to Mexico: A Multi-dimensional typology. Development and Change, 35(4):799-840.
- Gupta, P. S (2013). Statistical Methods. New Delhi: Sultan Chand and Sons Educational Publishers.
- Gwanshak, Y. J., Mohd, B. M and Shafie, A (2021). Rural-Urban Migration Pattern in a Developing Nation of Nigeria: The Pros and Cons (A Case Study of Plateau State). International Journal of Advance Research in Social Sciences, Environmental Studies and Technology, 6(9):124-136
- Hassan, I. M (2013). Population Geography. New Delhi: Rawat Publication.
- Ikwuyatum, G. O (2016). Pattern and Characteristics of Inter and Intra Regional Migration in Nigeria. International Journal of Humanities and Social Sciences, 6(7): 114-124
- International Labour Organization (2009). Paper work on Labour Migration.
- IOM (2022). World Migration Report 2022. Geneva, Switzerland: IOM. Retrieved on 17/02/2024 from World Migration Report 2022 | IOM Publications Platform
- IOM (2018). World Migration Report 2018. Retrieved on 02/04/2018 from https://www.iom.int/key-migration-terms
- Kainth, G. S (2009). Push Pull Factors of Migration: A Case of Brick Kiln Industry of Punjab State. Asian-Specific Journal of Sciences, 1(1)
- Knodel, J and Saengtiechai, C (2007). Rural Parents with Urban Children: Social and Economic implications of Migration for the elderly in Thailand. Population, Space and Place, 13(3): 193-210.
- Lee, E. S (1966). Theory of Migration. In Jackson, J (ed.). Migration. Cambridge: University Press.
- Lyam, A.A (2005).“The Benue Environment in the Twentieth Century”. In Lyam, A. A., Ochefu, A. Y., Sambe, A. J and Adejo, M. A (eds). Benue State in Perspective. Makurdi: Aboki Publishers.
- Ministry Of Lands and Survey Makurdi (2021). Benue State Showing the Local Government Areas of Study.
- Mundi, R (1998). Migration in the FCT: A Case Study of Gwagwalada Area Council. In Dawam, D. P (ed) Geography of Abuja, Federal Capital Territory
- NBS and UNICEF (2022). Multiple Indicator Cluster Survey 2021, Survey Findings Report. Abuja, Nigeria: National Bureau of Statistics and United Nations Children’s Fund.
- NPC and ICF (2019). Nigeria Demographic and Health Survey 2018. Abuja, Nigeria, and Rockville, Maryland, USA: National Population Commission and ICF International.
- NPC (2010). Internal Migration Survey in Nigeria. Abuja, Nigeria: National Population Commission.
- NPC (2009). Population and Housing Tables: Benue State Priority Table Volume 2.Abuja, Nigeria: National Population Commission.
- Ode, O.I (2006). Demography: Principles and Application. Makurdi: Selfers Academic Press.
- Orozco, M (2004). Mexican Hometown Association and Development Finance Opportunities. Journal of International Affairs, 57(2): 31-52.
- Stephens, C (2000). Threats to Urban Health in achieving Urban Food and Nutrition Security in the Developing World. A 2020 vision for food, agriculture and the environment-Focus 3- IFPRI.
- Tacoli and Okali (2001). The Links between Migration, Globalisation and Sustainable Development. World Summit on Sustainable Development, International Institute for Environment and Development
- Umoh, B. D (2001). Population Studies for Nigeria: A New Perspective. Enugu, Nigeria: Institute of Development Studies, University of Nigeria.
- UN (2018) Economic Development in Africa Report: Migration for Structural Transformation United Nations Conference on Trade and Development. Geneva, United Nations Publications. Retieved on 28/10/2023 from https://unctad.org/system/files/official-document/aldcafrica2018_en.pdf
- [38].World Bank (2018). Migration and Development. Washington DC: The World Bank.
APPENDIX I
Selected Local Government of Study, Rural Communities and Required Sample Size per Settlement
| S/No | L.G.A | Rural Settlements (Communities) | Population | Households/ Household Heads |
Proportional Sample Size | |
| 1991 | 2018 | |||||
| 1 | Otukpo | Opa | 3610 | 8259 | 1558 | 80 |
| 2 | Otukpo | Otobi-Otukpo | 562 | 1286 | 242 | 12 |
| 3 | Otukpo | Ombi | 311 | 712 | 134 | 7 |
| 4 | Otukpo | Ojinebe | 1606 | 3674 | 693 | 35 |
| 5 | Otukpo | Okpafulo | 2429 | 5557 | 1048 | 52 |
| 6 | Otukpo | Akwete | 514 | 1176 | 221 | 11 |
| 7 | Otukpo | Odudaje | 482 | 1103 | 208 | 10 |
| 8 | Otukpo | Igbeji | 261 | 597 | 112 | 6 |
| 9 | Otukpo | Igbalagidi | 354 | 810 | 152 | 8 |
| 10 | Otukpo | Aune | 1499 | 3430 | 647 | 32 |
| 11 | Otukpo | Ipolo Ehaje | 363 | 831 | 156 | 8 |
| 12 | Otukpo | Alaglanu | 560 | 1281 | 241 | 12 |
| 13 | Oju | Okpute | 339 | 776 | 146 | 7 |
| 14 | Oju | Ibila-Aluko | 419 | 959 | 180 | 9 |
| 15 | Oju | Egga | 924 | 2114 | 398 | 20 |
| 16 | Oju | Ohuma | 699 | 1599 | 301 | 15 |
| 17 | Oju | Igwe-Ebong | 676 | 1547 | 291 | 15 |
| 18 | Oju | Ojekwe | 1229 | 2812 | 530 | 27 |
| 19 | Oju | Ikachi-II | 946 | 2164 | 408 | 20 |
| 20 | Oju | Ameka | 2194 | 5020 | 947 | 47 |
| 21 | Oju | Ibila-Alache | 842 | 1926 | 363 | 18 |
| 22 | Oju | Igbila | 623 | 1425 | 268 | 13 |
| 23 | Oju | Ikachi I | 985 | 2254 | 425 | 21 |
| 24 | Oju | Andi-Ibila | 629 | 1439 | 271 | 14 |
| 25 | Oju | Ojegbe | 546 | 1249 | 235 | 12 |
| 26 | Oju | Ohoho II | 599 | 1370 | 258 | 13 |
| 27 | Oju | Oho-Oboru | 2279 | 5214 | 983 | 49 |
| 28 | Obi | Udegi | 924 | 2114 | 398 | 20 |
| 29 | Obi | Ogore | 883 | 2020 | 381 | 19 |
| 30 | Obi | Ijigwu | 210 | 481 | 90 | 5 |
| 31 | Obi | Ameka | 1711 | 3915 | 738 | 37 |
| 32 | Obi | Adum-East | 2704 | 6186 | 1167 | 58 |
| 33 | Obi | Ojwo | 519 | 1187 | 223 | 11 |
| 34 | Obi | Opirikwu | 284 | 650 | 122 | 6 |
| 35 | Gwer-West | Kura | 931 | 2130 | 401 | 20 |
| 36 | Gwer-West | Jimba-Mbaaki I | 1778 | 4068 | 767 | 38 |
| 37 | Gwer-West | Mbadachi (Tse-Ale) | 755 | 1727 | 325 | 16 |
| 38 | Gwer-West | Nagi | 679 | 1553 | 293 | 15 |
| 39 | Gwer-West | Agagbe | 1260 | 2883 | 543 | 27 |
| 40 | Gwer-West | Go | 1130 | 2585 | 487 | 24 |
| 41 | Gwer-West | Mbaadi | 484 | 1107 | 208 | 10 |
| 42 | Gwer-West | Ahume-Mbaaki II | 530 | 1213 | 228 | 11 |
| 43 | Gwer West | Ugambe | 222 | 508 | 95 | 5 |
| 44 | Gwer-West | Aondona | 635 | 1453 | 274 | 14 |
| 45 | Gwer-East | Ikpayongo | 3444 | 7880 | 1486 | 74 |
| 46 | Gwer-East | Mbadzu | 1264 | 2892 | 545 | 27 |
| 47 | Gwer-East | Igbo (Mbakyambe) | 1387 | 3173 | 598 | 30 |
| 48 | Gwer-East | Howe-Town | 1075 | 2459 | 463 | 23 |
| 49 | Gwer-East | Mbaga | 1270 | 2906 | 548 | 27 |
| 50 | Gwer-East | Taraku | 4175 | 9552 | 1802 | 90 |
| 51 | Gwer-East | Agana | 467 | 1068 | 201 | 10 |
| 52 | Gwer-East | Muse-Mbamende | 1055 | 2414 | 455 | 23 |
| 53 | Gwer-East | Mbaiche | 946 | 2164 | 408 | 20 |
| 54 | Gwer-East | Mbaakosu I | 628 | 1437 | 271 | 14 |
| 55 | Gwer-East | Mbamiase | 1362 | 3116 | 587 | 29 |
| Total | 59192 | 135425 | 25520 | 1276 | ||
Source: NPC (1998); INEC (2015) and Field Reconnaissance Survey (2018)
Population projection was based on Benue State 2006 Population Census growth rate (3.0%)
Proportional Sample Size (PSS) can be determined as follows;
![]()
Where,
PSS = Proportional Sample Size
S = Population of an area (Household Heads)
N = Total Population (25520 household heads in the 55 rural settlements as at 2018)
N = Sample Size (1276)
1 = constant.
![]()