
Thermal Comfort in Naturally-Ventilated (NV) Student Hostels in Hot-Humid Tropical Environment of Enugu, Southeast Nigeria
- Francis O. Uzuegbunam
- Tobenna D. Uzuegbunam
- Lawrence A. Isiofia
- Eziyi O. Ibem
- 42-60
- Jun 28, 2024
- Environmental Impact
Thermal Comfort in Naturally-Ventilated (NV) Student Hostels in Hot-Humid Tropical Environment of Enugu, Southeast Nigeria
Francis O. Uzuegbunam1., Tobenna D. Uzuegbunam2., Lawrence A. Isiofia3., Eziyi O. Ibem1
1Department of Architecture, University of Nigeria, Enugu Campus, 400006, Enugu, Enugu State, Nigeria.
2Land Use Consultants Ltd. 6 Canning Street, Edinburgh. EH38EG.
3Department of Architecture, Faculty of Environmental Sciences, Enugu State University of Science and Technology (ESUT), Agbani, Enugu State, Nigeria.
DOI : https://doi.org/10.51584/IJRIAS.2024.906005
Received: 01 May 2024; Revised: 20 May 2024; Accepted: 28 May 2024; Published: 28 June 2024
ABSTRACT
This paper sought to determine the effects of design strategies on thermal comfort in naturally- ventilated student hostels. The review of related literature led to the postulation of two null hypotheses which served as a guide to the study. The data were collected via computer fluid dynamics (CFD) and simulations using the PHOENICS-VR programme. The principal component analysis (PCA), analysis of variance (ANOVA) and Pearson product-moment correlation were used in the data analysis. The results revealed a significant correlation between design strategies hinged on ventilation, temperature and relative humidity with passive ventilation for thermal comfort. The results also confirmed the degrees of effectiveness of the different design strategies and ranked them in the appropriate order for effective passive ventilation and thermal comfort. Some recommendations were made, while new areas were suggested for further study.
Keywords: Thermal comfort; Natural ventilation; Hot-humid tropical environment; under varied design arrangements.
INTRODUCTION
The ever-increasing number of students admitted into Nigerian universities yearly has placed a very high demand on the Nigerian building industry to provide more energy-efficient student hostels that do not necessarily rely on mechanical appliances that use fossil fuel to ensure occupants’ thermal comfort. To achieve this mandate in the harsh tropical climatic conditions, the need arose on how best to achieve thermal comfort which is not largely dependent on mechanical energy use, which has become a scarce commodity in Nigeria. Currently, Nigeria’s energy demand stands at 6800 MW but only 3000 MW is generated and supplied to the national grid. Hence, there is a huge electricity supply gap in this country. Nigeria, with its rapidly growing student population and need for more hostels to accommodate this teeming, faces a rising energy cost, coupled with CO2 emissions from the use of fossil fuel power generators. There is no doubt that the country’s building sector is and will continue to be a major energy end-user. The prevalence of overheating of building interiors due to solar heat gain, through the building envelope and apertures with the attendant high level of thermal discomfort, which exceeds the threshold of acceptable thermal comfort conditions, is a source of serious concern in the tropical environment. The average typical temperature range of 25-36˚C and high relative humidity range of 70% – 95% are common in most Nigerian towns. They are usually above the recommended thermal comfort temperature of 30˚C and relative humidity of 75% [1].
Natural ventilation is one of the strategies for achieving indoor thermal comfort and cooling of buildings in the tropics [2]. Thermal mass or evaporative cooling for body cooling with night ventilation for structural cooling is required also, in hot humid climates [3][4]. A literature search was conducted on effective passive ventilation of Student Hostels for thermal comfort in a hot-humid tropical environment. It was found that very little research has been done on this. Generally, the existing research has shown that from a thermal point of view, design strategies in modifying indoor overheating were of greater significance in promoting passive cooling in the tropical environment, and recommended natural ventilation as an appropriate passive system [2]. The dearth of research on this subject in the hot-humid tropics of Southeast Nigeria and a need to find a design strategy for optimum wind force ventilation, which is considered vital in combination with the stack effect because of its absence in hot still-wind days motivated this research.
Therefore, this study aimed to determine the effects of design strategies on thermal comfort in naturally ventilated student hostels. Two hypotheses were stated to statistically test and evaluate the effectiveness of the different design strategies for ranking. The hypotheses are as follows:
Ho1: There was no significant difference in the effectiveness of passive ventilation of the student hostels with western and southern orientations for thermal comfort in the study area.
Ho2: There were no significant correlations between design strategies and passive ventilation in the Student Hostels for thermal comfort in the study area.
LITERATURE REVIEW
Climate is the regular pattern of weather conditions of a particular place or an area with particular weather conditions. It is a present general attitude or feeling in an atmosphere. It is the interaction between the sun, land, and water throughout the year, which results in what is called weather. These interactions produce daily and seasonal temperature, humidity, and wind patterns, which vary substantially, between locations even in close geometric proximity. Climate as an inevitable element of nature, has effects that are sometimes unpredictable. The climate of an enclosed space is determined by thermal comfort parameters, as the logical factor of the enclosure itself. It is made up of the indoor air temperature, indoor air velocity and indoor air relative humidity [5]. Passive ventilation for thermal comfort in an enclosed space is an important aspect of architectural design which has influenced building forms/shapes, especially, in tropical environments, where there are harsh weather conditions throughout the year. Ventilation, which can be measured in terms of rates of air circulation or rates of air movement (m/s), indicates the quantity of outdoor air circulated through interior spaces to sustain an interior environment devoid of odours. It can be achieved through natural (passive) or mechanical (active) strategies.
This research is limited to natural ventilation systems only. Natural ventilation is controlled by two factors, namely: pressure variation due to wind and stack effect and temperature difference between air the inside and outside of a building. Typically, building design relies on rules of thumb for harnessing the power of wind for natural ventilation. Design guidelines are offered in building regulations and other related literature and include a variety of recommendations for specific areas.
Natural ventilation could be achieved by ordering of building forms and fenestration, orientation of buildings with respect to wind direction and the specification of appropriate building materials for the components of the building enclosure system [6]. While form deals with the size and shape of the room and roof, fenestration involves the sizing and placement of apertures like windows and doors on the building envelope, including the walls and roofs [1, 7]. Where the available natural wind speed is low, there may be a need to employ some ventilation-inducing techniques like wind towers, wind scoops, cool tubes, Venturi tubes, solar chimneys, air vents and others [8, 4, 9]. In an appropriate building form, fenestration and materials can only be applied after a careful examination of relevant information and data identification, definition of objectives, and problems and highlighting all the design requirements [10]. Among the relevant information and data to be analysed are those of the climate, which include air temperature, relative humidity and wind [5]. Climatic data from meteorological stations may not reveal much about the local micro-climatic conditions because of the effects of local topography, vegetation, surrounding buildings and other natural and man-made features on the micro-climate [11, 12]. However, they might help to provide a clue on the dynamics of these climatic variables of an area over the years. These data are vital design inputs in bioclimatic design.
The climatic data of temperature, wind, rainfall and relative humidity in Nigeria are classified into four broad climatic zones namely: the hot-dry, temperature-dry, hot-humid and warm-humid zones [13]. In this classification, Enugu, in Enugu State in the Southeastern part of the country falls within the hot humid tropics. The comfort limits of naturally-ventilated spaces in the tropics have been estimated at between 26˚C to 31˚C, and wind speed of 1.0m/s [14]. Higher wind speeds may be desirable to maintain thermal comfort at higher temperatures, which is obtainable in hot-dry and humid climatic zones [15]. The design of hostels for natural ventilation in such a climate, to meet the objective of providing natural ventilation and thermal comfort may therefore be a challenging task. Hence there was the need to carry out post-occupancy evaluation on the existing hotels in the area [16]. This was necessary to either validate such designs or review them. It could also provoke some re-engineering actions on the built form.
Of the efforts, which have been made in the assessment of design strategies for passive ventilation and thermal comfort, perhaps the most tangible and precise, were the works of [17] and [18]. In these studies, inductive approaches were adopted. It differentiated between levels of relative development, for different design strategies and techniques applicable, for effective passive ventilation for thermal comfort. To study the impact of ventilation strategy, a natural ventilation efficiency index was defined as the ratio of the room mean airflow to the local mean airflow. This was determined in each of the experiments. The first experiment produced a natural ventilation efficiency of 68.3%. The second produced 71.7%, while the third produced 87.5%. It was concluded, that the studies reinforced the theory that airflow, depends on both the size and distribution of openings [17]. These results, however, contradicted [1] which reported a maximum attainable natural ventilation efficiency of 40%, when the window area is 25% of the floor area. Above this, it was reported that there was no corresponding increase in efficiency.
Given that these studies cited are inconclusive in their findings, there is still a need to identify a design strategy for optimising wind force and stack effect ventilation mechanisms for students’ hotels in the hot-humid tropics of Enugu Southeast Nigeria. This forms the research gap the present study attempted to fill.
The Study Area
The study area is Enugu, the capital of Enugu State, Southeast Nigeria. It is in the hot-humid zone, 6˚30′ north and 7˚31′ east. The students’ hostels owned privately and publicly in the University of Nigeria, Enugu Campus, Enugu State, Nigeria were used for the case study (see Table 3). The Enugu Campus of the University of Nigeria lies at latitude 6.2528˚ North of the Equator and Latitude 7.3022˚ east of the Greenwich Meridian. It has nine hostels of three typologies which are presented in this ventilation and thermal comfort study. The region has two seasons, namely, the dry season and the rainy season. The rainy season lasts from April to October and is brought about by the prevailing moisture of southwest wind that blows across the Atlantic Ocean. A break in rain usually referred to as “August Break”, however, occurs in August. The dry season is a result of Northeast trade winds, brings with it, dust from the Sahara Desert, and is by nature dry. This season lasts from November to March. Tables (1 and 2) show a summary of the meso-climatic wind activities and directions for the months and days of the experiments (July, September & November 2010) and meso-climate wind direction/speed on the days of experiments July 14 &16, 2010, September 16, 2010, and November 16, 2010, in Enugu, respectively.
Table 1. Summary of the Meso-Climatic Wind Activities and Directions for the Months and Days of the Experiments (July, September & November 2010) in Enugu
| Day | Wind Direction July 2010 | Wind Direction September 2010 | Wind Direction November 2010 |
| 1. | SW’ly | SW | NW, Calm b/w 1600-2300 |
| 2. | Variable Wind | Variable Wind | S, Calm b/w 1700-2300 |
| 3. | SW’ly | SW | Mostly Calm, SE b/w 1100-1600 |
| 4. | SW’ly | CALM/SW | SW |
| 5. | CALM/SW | Variable wind | Calm b/w 0000-0700, SW |
| 6. | SW/NW | Variable Wind | SW |
| 7. | SW | SW | SW |
| 8. | SW | Variable Wind | Calm b/w 0000-0700, NW |
| 9. | SW | Variable Wind | Calm b/w 0000-0600, SW |
| 10. | CALM/SW | CALM/SW | SW |
| 11. | CALM/SW | Variable Wind | Mostly Calm, NE 1400-1800 |
| 12. | SW’ly | CALM/SW’ly | Mostly NE, Calm b/w 1700-0000 |
| 13. | Variable Wind | NW | Variable Wind |
| 14. | NW’ly | Variable Wind | Calm b/w 0000-0600, SW |
| 15. | Variable Wind | SW/NW | Calm Mostly |
| 16. | SW’ly | Variable Wind | Variable Wind |
| 17 | Variable Wind | SW/NW | Calm Mostly |
| 18. | SW’ly | SW/NW | Variable Wind |
| 19. | SW’ly | SW/NW | Calm Mostly, NE |
| 20. | SW’ly | Variable Wind | Mostly S, SW |
| 21. | SW/NW | Variable Wind | Calm Mostly |
| 22. | SW/NW | SW/NW | Calm Mostly, SE |
| 23. | Sw’ly | CALM/Variable | Variable wind |
| 24. | Variable Wind | SW/NW | |
| 25. | Variable Wind | SW | |
| 26. | CALM/SW | SW | |
| 27. | Variable Wind | CALM/SW | |
| 28. | SW | Variable Wind | |
| 29. | SW/NW | Variable Wind | |
| 30. | SW | CALM/SW |
Source: Nigerian Meteorological Agency, Abuja (NIMET 2010)
Table 2: Meso Climate Wind Direction/Speed on the Days of Experiment July 14 &16, 2010, September 16, 2010 & November 16, 2010
| Time Hrs | Wind Speed/Direction | Wind Speed/Direction | Wind Speed/Direction |
| 0000 | SW’ly/NW’ 01-10kts | 220/09kts | Calm = 00kts |
| 0100 | SW’ly/NW’ 01-10kts | 180/25kts | 300/04kts |
| 0200 | SW’ly/NW’ 01-10kts | 150/15kts | 280/05kts |
| 0300 | SW’ly/NW’ 01-10kts | 210/03kts | Calm = 00kts |
| 0400 | SW’ly/NW’ 01-10kts | 270/05kts | Calm = 00kts |
| 0500 | SW’ly/NW’ 01-10kts | Calm = 00kts | 280/05kts |
| 0600 | SW’ly/NW’ 01-10kts | Calm = 00kts | Calm = 00kts |
| 0700 | SW’ly/NW’ 01-10kts | Calm = 00kts | 180/06kts |
| 0800 | SW’ly/NW’ 01-10kts | 120/05kts | 170/05kts |
| 0900 | SW’ly/NW’ 01-10kts | 120/05kts | 160/07kts |
| 1000 | SW’ly/NW’ 01-10kts | 120/06kts | 180/08kts |
| 1100 | SW’ly/NW’ 01-10kts | 220/07kts | 160/07kts |
| 1200 | SW’ly/NW’ 01-10kts | 220/10kts | 110/06kts |
| 1300 | SW’ly/NW’ 01-10kts | 220/06kts | 160/08kts |
| 1400 | SW’ly/NW’ 01-10kts | Calm = 00kts | 170/10kts |
| 1500 | SW’ly/NW’ 01-10kts | 230/10kts | 190/14kts |
| 1600 | SW’ly/NW’ 01-10kts | 220/05kts | 200/07kts |
| 1700 | SW’ly/NW’ 01-10kts | 210/04kts | 230/08kts |
| 1800 | SW’ly/NW’ 01-10kts | 210/08kts | 170/06kts |
| 1900 | SW’ly/NW’ 01-10kts | 220/02kts | 190/07kts |
| 2000 | SW’ly/NW’ 01-10kts | Calm = 00kts | 210/06kts |
| 2100 | SW’ly/NW’ 01-10kts | 210/04kts | 210/04kts |
| 2200 | SW’ly/NW’ 01-10kts | 290/04kts | Calm = 00kts |
| 2300 | SW’ly/NW’ 01-10kts | 180/06kts | Calm = 00kts |
Source: Nigerian Meteorological Agency, Abuja (NIMET 2010)
RESEARCH METHODOLOGY
The study adopted an experimental research design with simulations performed using the PHOENICS-VR programme. The specific site at the University of Nigeria Enugu Campus consists of nine hostel buildings from which three were selected. The nine hostels were: 1) Nkrumah Hall (Post Graduate Hostel 2) Mariere Hall 3) Manuwa Hall 4) Adelabu Hall 5) Ojukwu Hall 6) Mbonu Ojike Hall 7) Lady Ibiam Hall (Undergraduate Hostel) 8) Kenneth Dike Hall, and 9) Presidential Hostel (New Female Hostel). The selection criteria, utilised for identifying the study samples were generated through a typology study of the hostel buildings on the campus. The typical properties considered for the archetypes included layout similarity (building form), orientation similarity, volume of the building and architectural characters (building façade characters). The principles considered for the typology grouping are shown in Figure 1.
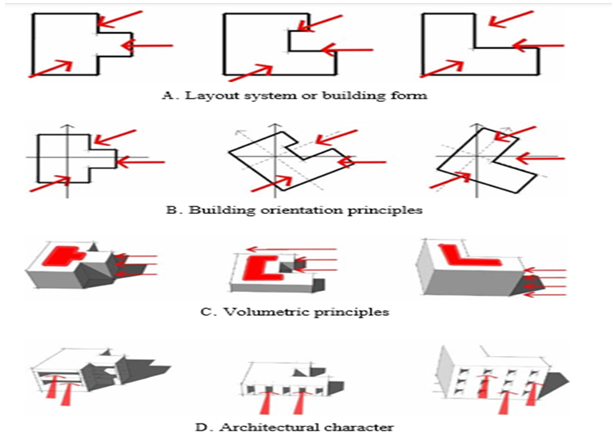
Figure 1: The principles applied in the building typology grouping
These criteria characterized the building types as models, each of which assumed similar characteristics with others in the same category (see Table 3).
Table 3. Hostel Typology Grouping
| TYPE [A] Drew & Fry Hostels | TYPE [B] Ogbuefi Hostel (New Female Hostel) | TYPE [C] Ekwueme Hostels |
| Adelabu hall | Kenneth Dike Hall | |
| Nkrumah Postgraduate Hall | Presidential Hostel | Lady Ibiam Hall (Undergraduate) |
| Manuwa hall | Mbonu Ojike hall | |
| Mariere hall | ||
| Ojukwu hall |
Source: Author’s Field Survey (2010)
Table 4 presents the characteristics of the hotels in terms of the gender of the occupants, number of floors and rooms, bed spaces and bed occupants and other facilities
Table 4: Characteristics of the Hostels
| S/n | Hostel | Gender (Male or Female) | Number of floors | Bed spaces | Bed Occupants | No of rooms | Other facilities | ||
| Lounge | Hairdressing | Canteen | |||||||
| 1 | New F. Hostel | F | 2 | 80 | 76 | 20 | 1 | 1 | 1 |
| 2 | Nkrumah P/G | M/F | 3 + Basement | 200 | 198 | 100 | 1 | 1 | 1 |
| 3 | Lady Ibiam | F | 4 | 1083 | 924 | 163 | 1 | 1 | 1 |
| 4 | Mariere Hall | M | 3 + Basement | 298 | 196 | 100 | 1 | 1 | 1 |
| 5 | Mbonu Ojike | M | 4 | 726 | 725 | 131 | 1 | 1 | 1 |
| 6 | Kenneth Dike | M | 4 + Basement | 749 | 697 | 181 | 1 | 1 | 1 |
| 7 | Manuwa | F | 3 + Basement | 292 | 284 | 100 | 1 | 1 | 1 |
| 8 | Ojukwu | F | 3 + Basement | 281 | 279 | 98 | 1 | 1 | 1 |
| 9 | Adelabu | F | 3 + Basement | 238 | 238 | 100 | 1 | 2 | 1 |
| 10 | Total | 9 | 3947 | 3617 | |||||
A general survey of the site of the hostels presented a gentle topography for the entire built environment. This suggests that airflow conditions, which impact the buildings, will present similar receptive effects, within the same archetype. The typical properties considered for the archetypes included layout similarity (building form), orientation similarity, volume of the building and architectural characters (building façade characters). Figures (2, 3 and 4) show the building forms for typologies A, B and C.
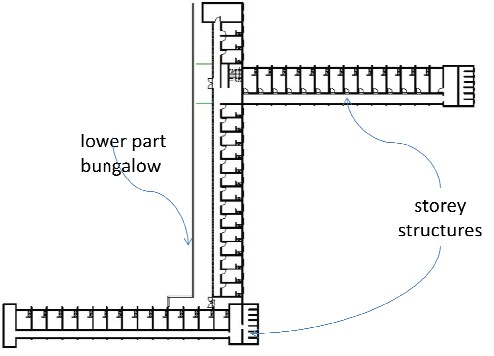
Figure 2. Typology [A] Nkrumah Hall (PG hostel) designed by Drew and Fry.
Source: Authors’ Field Work (2010)
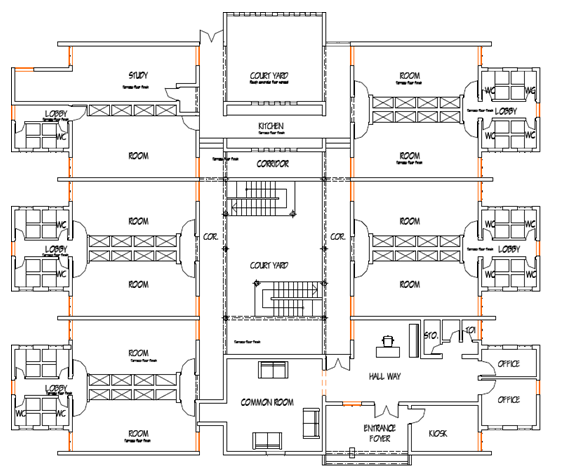
Figure 3. Typology [B] Presidential hostel (New Female hostel) designed by Ogbuefi and Partners.
Source: Authors’ Field Work (2010)
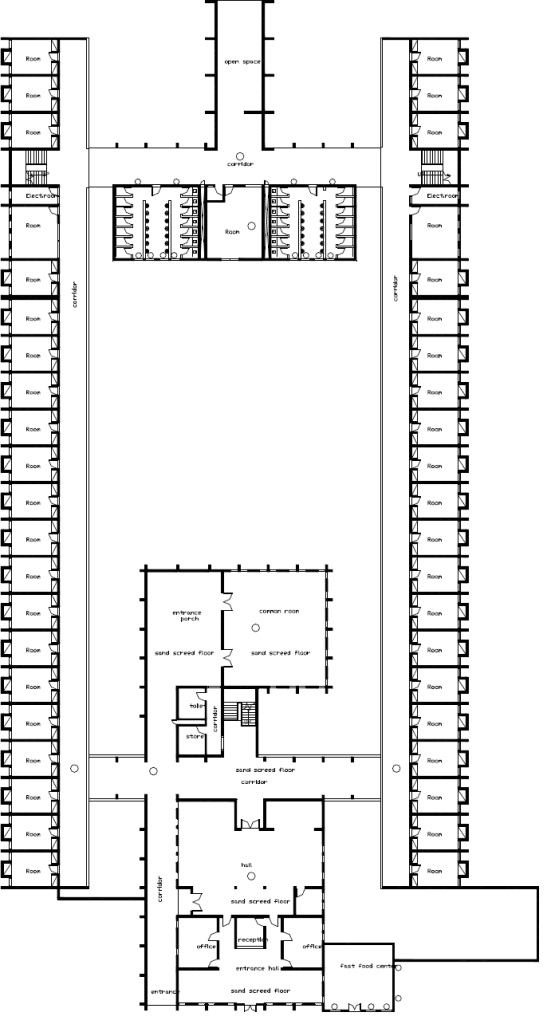
Figure 4. Typology [C] Lady Ibiam Hostel (UG hostel) was designed by Ekwueme and Associates.
(Source: Author’s Field Work 2010)
The data collection methodology for the research experiments of this work was broken sequentially into three steps stated as follows:
- Building typology information as one of the base cases for the research was collected from literature and experimental models. Building fenestrations and apertures information as one of the base cases for the research was collected from the thermal/ventilation adaptive experimental models. Building orientation data was collected as one of the base cases that the experimental models will directly address and was utilized also in the statistical model for comparative analysis together with the other base cases.
- Micro-climatic data and related information on Passive ventilation systems as they affect student hostels in the Tropics, with emphases on Enugu, and the University of Nigeria, Enugu Campus Hostels was collected by the researcher at the field, using the equipment.
- Meso-climatic data as it relates to the zone for a period not less than ten years, was also collected for concurrency and comparative studies. This information was obtained from the Nigerian Meteorological Agency (NIMET), Abuja.
A field survey was conducted on the three main hostel typologies selected for this study. This survey aimed to collect experimental data for the relevant climate studies and analysis of these hostels. The analyses helped to determine the performance of these buildings on the following parameters: air temperature, relative humidity and airflow (air velocity).
Each of the hostel types was evaluated based on these parameters and measurements were taken with specific measuring points observed for each case. The buildings have different floor levels, typology A (Drew and Fry Hostel) has four, typology B Ogbuefi Hostel has two and typology C (Ekwueme Hostel) has four, floors. The floor that is common to all the hostels is the second floor, so the second floor was used for the experiments. The dimensions of the hostel rooms were 4.0m by 3.6m for Ekwueme hostel and Drew and Fry hostel, and 3.6m by 5.0m for Ogbuefi hostel with heights of 3.0m, and volumes of 43.2m3 and 54m3, respectively. The rooms consisted of two interior walls and floor with ceiling, and two exterior walls, with one window on each side, and one door. The dimension of the window area was 2m by 1.8m, with a bottom seal at 1.1m. with different numbers of rooms (see Table 4).
The measuring points were as follows:
- Room air temperature – This was measured at 1.5 meters above the ground level at the centre of each of the rooms selected for the survey. The 2nd floor and the most middle-positioned rooms were used for the survey to get the most efficient location for clear exposure to particular outdoor climatic conditions.
- Room humidity – It was measured at 1.5 meters above ground level at the centre of each of the rooms selected for the survey.
- Room air velocity – It was measured at 1.5 meters above ground level at the centre of each of the rooms selected for the survey.
- Outdoor climate measurements – This was measured at the roof level (i.e. at about 12.6m above the ground).
In analysing the data, a computer simulation was performed using computational fluid dynamics (CFD) as a tool to evaluate the wind environment around the hostel buildings and to ascertain the wind behaviour around the building. Computer simulation was necessary to predict the effect of wind movement on natural ventilation and to optimize the site planning criteria during designs. For this study, all iterations were observed for a basic airflow pattern within the environment. The wind speed and direction data in Tables 1 and 2 were considered in creating the necessary wind speed and wind direction for the (CFD) model. Previous literature on the climatic classifications of Nigeria shows that the wind pattern into the northward (SW) brings moist air between April- and October and the southward (NE) brings dry cold air between November and March coming from the north. This information has been the background for all passive design solutions and building orientation for Nigerian professionals. Measuring at the height of 12.6m, the wind paths recorded, presented in Table 9, a different pattern for the rainy season, while the dry season wind was mostly normal. This pattern which probably occurred due to the deflection of wind direction by terrain, vegetation, building clusters, climate change and other environmental factors contributes greatly to the problem of effectively harvesting the natural airflow during the rainy season. The CFD simulation performed using the wind path and pressure information in the tables and figures produced the actual behaviour of the air movement around the hostel buildings in the University of Nigeria, Enugu Campus. From the existing data, ventilation has been identified as an inadequate factor for thermal comfort in the study area.
The outdoor temperature was computed using the linear relationship which Humphreys [19] derived between comfort temperature and mean outdoor temperature for a free-running building:
Tc = 0.534To + 12.9 ————–Equation 1
Where Tc is the comfort temperature and to is the mean outdoor temperature. This relationship provides building professionals with the possibility of predicting the temperature which will be comfortable in free-running buildings by calculating from the monthly mean outdoor temperature given by meteorological records.
The Comfort temperature Tc for Enugu (southeastern Nigeria) was calculated from the outdoor temperature using Equation 1. To was calculated as the mean of the monthly maximum (To max) and minimum (To min). The results for Enugu State (southeastern Nigeria) using data from Table 1, show that comfort temperature overlaid on the outdoor temperature, indicating the temperature differential the building must achieve to remain comfortable indoors, was within range.
The principal component analysis (PCA) was used to combine indoor temperature, indoor air velocity and indoor humidity into a single climatic factor. This was done for each of the west and south orientations. The result was able to disclose one climatic factor. Then the climatic factors for the west and south were compared using the analysis of variance technique (ANOVA) as previous authors had done [ see 20, 21]. Pearson’s product-moment correlation analysis was used to investigate the relationships between the design strategies used in Drew & Fry, Ekwueme and Ogbuefi hotels studies. It should be noted that the correlation variables with a score of 0.5 and above indicate a high positive correlation, while the correlation variables with a score of less than 0.5 and above 0.3, indicate moderate positive correlation. The Correlation variables with a score of less than 0.3 disclosed a low correlation among the parameters of the study. The PCA was also used to combine the climatic factors of PG-west and PG-south (Drew & Fry Hostel), to obtain their climatic factors for each of the hostels designed by Ekwueme and Ogbuefi. Each of them resulted in a unique factor. The study applied correlation analysis with the aid of SPSS to empirically determine the levels of correlation. Previous studies [22][23] had also adopted similar analysis. The results are presented using texts and tables for easier interpretation and understanding.
RESULTS AND DISCUSSION
Results of Testing of Research Hypotheses
The results of the hypotheses testing are presented in Tables 5 and 6. The result rejected the Null hypothesis of no significant difference in passive ventilation in Student Hostels for thermal comfort in a hot humid tropical environment arising from different building orientations of the study area. This implies that there is a significant difference at less than 0.05 significant levels.
Table 5: ANOVA of Drew and Fry Hostel
| Sum of Squares | df | Mean Square | F | Sig. | |||
| Between Groups | (Combined) | 8.761 | 1 | 8.761 | 21.639 | 0.000 | |
| Linear Term | Unweighted | 8.761 | 1 | 8.761 | 21.639 | 0.000 | |
| Weighed | 8.761 | 1 | 8.761 | 21.639 | 0.000 | ||
| Within Groups | 5.263 | 13 | .405 | ||||
| Total | 14.024 | 14 | |||||
Source: Authors’ Field Work (2010)
Table 6 shows that there was a very high correlation (0.905) between design strategies adopted in Drew & Fry and Ekwueme hotels. There is a high correlation (0.611) between the design strategies adopted for Drew & Fry and Ogbuefi hotels. Also, a moderate correlation (-0.406) was observed between the design strategies in Ekwueme and Ogbuefi hotels.
Table 6: Test of Level of Significance Among Ventilation and Design Strategies of the Study Area
| Significant Variables | Level of Significant Score | Level of significant Rank | Remark |
| Ventilation against Drew & Fry | 0.197 | 2nd | Low significant impact |
| Ventilation against Ekwueme | 0.297 | 3rd | Low significant impact |
| Ventilation against Ogbuefi | 0.051 | 1st | Moderate significant impact |
Source: Author’s Field Work (2010)
Based on the correlation results, the Null hypothesis which states that no significant correlations existed between design strategies and passive ventilation in students’ hostels in the study area was rejected. Thus, the study concludes that there are significant correlations between design strategies and passive ventilation in students’ hostels in the hot humid tropical environment of the study area. The levels of the correlation are presented and discussed. The correlation variables of Drew & Fry’s design strategy against Ekwueme’s scored 0.91. This implies that both design strategies exhibited near-perfect correlations among the parameters of the study. In addition, the correlation variables of Drew & Fry and Ogbuefi design strategies scored 0.61. This implies that both design strategies have a high correlation among the parameters of the study. Ventilation against Drew and Fry scored 0.27, ventilation against Ekwueme scored 0.18 and ventilation against Ogbuefi scored 0.49. The implication of this is that ventilation against the three design strategies is correlated.
The results of the correlation analyses are presented and analysed in Tables 7 and 8. It can be seen from the results that the level of correlation was very low compared to the correlation that exists among the design strategies outside ventilation. These different design strategies must be responsible for this correlation result. Moreover, it is interesting to point out that the correlation results for ventilation against the Ogbuefi design strategy which scored 0.49 indicated a moderate correlation among the parameters of the study. The correlation variable score for Ekwueme against Ogbuefi is -0.41. This implies that both design strategies have an inverse correlation. This explained why Ogbuefi (NFH) had a ventilation coefficient of 0.72m/s, above the global standard value while Drew & Fry (PG) and Ekwueme (UG) which correlated very highly among themselves failed to attain the global standard score.
Table 7: Correlation Results of Different Design Strategies Against Each Other
| S/n | Correlation Variables | Very High Score | High Score | Moderate Score | Low Score |
| 1 | Drew & Fry against Ekwueme | 0.905* | |||
| 2 | Drew & fry against Ogbuefi | 0.611* | |||
| 3 | Ekwueme against Ogbuefi | -0.406 |
Source: Author’s Field Work (2010)
Table 8: Correlation Variables Results of Ventilation and Different Design Strategies
| S/N | Correlation Variables | High Score | Moderate Score | Low Score |
| 1 | Ventilation against Drew & Fry | 0.271 | ||
| 2 | Ventilation against Ekwueme | 0.176 | ||
| 3 | Ventilation against Ogbuefi | 0.494 |
Source: Author’s Field Work (2010)
From the field investigations and analyses, the room temperature averages for all the design strategies were within the acceptable range of between 27o C 30oC. The indoor relative humidity rates were also moderate between 50% – 65%, which is also within the acceptable range. However, the problem was found to be from low outside wind pressure and the orientation of the buildings to an assumed wind direction, hence the inability to properly harvest the wind. Even when the outside wind was within the recommended value of 1.0m/s, the ventilation coefficient was still below the global standard of (≥0.6m/s) for the majority of the nine hostels investigated.
Rainy season experiments – Wind path (April – October)
Figure 5 shows the pressure distribution at 2m height for north-east leading wind conditions within the Campus as obtained from simulations using the PHOENICS-VR programme. It is evident from Figure 5 most of the pressure was reduced due to adjacent structures, preventing proper harvesting of the wind for passive ventilation. Also, the wind direction was unreliable and unpredictable, so orientation became irrelevant and utterly useless for maximal wind harvest (see Figure 5).
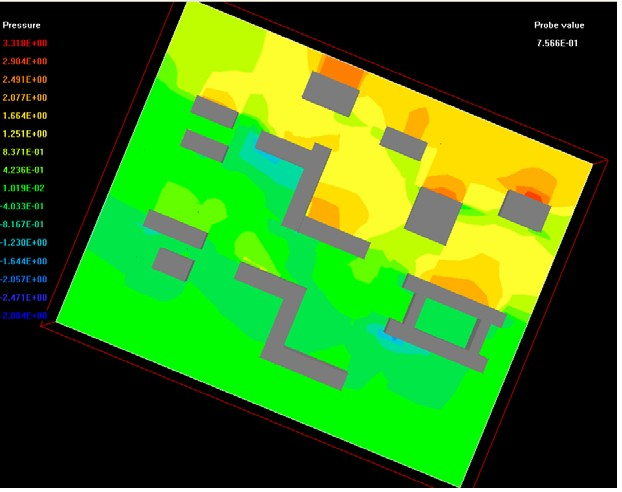
Figure 5. Pressure distribution at 2m height for north-east leading wind condition.
(Source: Author’s Computer Simulation of the Field Survey)
Table 9 is a display of the measured wind speed and direction on the university campus, where the hostels are located. The average wind speed in the hostels was 0.98 m/s, the highest wind speed was recorded along the northeast-east direction at 2.00 pm, while the least (0.5 m/s) was recorded along the northeast-east direction at 3.00 pm
Table 9: Measured wind speed and direction in the study area
| Time | 14 July 2010 | |
| Wind direction | Wind speed m/s | |
| 12:00 am | South West | 1.2 |
| 1:00 pm | North East | 0.9 |
| 2:00 pm | North East-East | 1.7 |
| 3:00 pm | North East-East | 0.5 |
| 4:00 pm | North East | 0.9 |
| 5:00 pm | North East | 0.7 |
Average wind speed 0.98
Table 10 shows the results of the analysis of the co-relational studies of the room air velocity readings, used to determine the rate of airflow (ventilation), temperature and relative humidity in the hostel rooms tested.
Table 10. Experimentation and Evaluation of Rainy Season Climatic Factors (April – October)
| Time | Outdoor Climatic Factors of the Hostel Region | Room Climatic factors of Drew & Fry Hostel Design Strategy (Postgraduate (PG) Hall) | Room Climatic Factors of Ekwueme Hostel Design Strategy (Undergraduate (UG) Hall | Room Climatic factors of Ogbuefi Hostel Design Strategy (NFH) | ||||||||
| Temp | Air Vel. | RH | Temp | Air Vel. | RH. | Temp | Air Vel. | RH. | Temp | Air Vel. | RH | |
| 6:00 | 26.6 | 0.9 | 64.6 | 25.7 | 0 | 70.1 | 25.4 | 0 | 70.1 | 26.2 | 0 | 70 |
| 7:00 | 28.2 | 0 | 65.7 | 25.8 | 0 | 67.7 | 24.9 | 0 | 67.7 | 26.4 | 0 | 71.9 |
| 8:00 | 28.1 | 1.1 | 64.8 | 26.6 | 0 | 67.3 | 25.5 | 0 | 67.3 | 27.3 | 1 | 68 |
| 9:00 | 29.3 | 1.1 | 57.2 | 27.9 | 0.7 | 62.5 | 26 | 0 | 62.5 | 29 | 1.4 | 61.3 |
| 10:00 | 28.3 | 1.2 | 56.4 | 27.9 | 0.1 | 65.1 | 26.4 | 0 | 65.1 | 29.1 | 1.1 | 60.4 |
| 11:00 | 29.1 | 0.6 | 51.6 | 28.3 | 0.9 | 64.2 | 26.3 | 0 | 64.2 | 31.6 | 1.1 | 49.6 |
| 12:00 | 29.9 | 0.9 | 47.2 | 29.9 | 0.8 | 59.8 | 27.3 | 0 | 59.8 | 32.7 | 0 | 40.9 |
| 13:00 | 30.5 | 1.2 | 52 | 29.8 | 0.5 | 60.3 | 27.3 | 0 | 60.3 | 31.1 | 0 | 53.7 |
| 14:00 | 31.1 | 1.2 | 54.1 | 31 | 0.1 | 57.2 | 28.1 | 0 | 57.2 | 30.8 | 0 | 56.2 |
| 15:00 | 31.1 | 1.2 | 54.3 | 31.6 | 0 | 57.1 | 27.5 | 0 | 57.1 | 31 | 0 | 55.1 |
| 16:00 | 31.1 | 1.4 | 49.1 | 30.6 | 0.9 | 56.5 | 29.4 | 0 | 56.5 | 31.7 | 1 | 53.2 |
| 17:00 | 30.2 | 1.2 | 55.5 | 30.1 | 0.4 | 58.5 | 28.3 | 0 | 58.5 | 30.4 | 0.8 | 58.6 |
| 18:00 | 29.9 | 0.5 | 55.6 | 29 | 0 | 61.6 | 27.3 | 0 | 61.6 | 30 | 0 | 59.7 |
| 19:00 | 28.7 | 0.4 | 63.3 | 28.5 | 0 | 65.7 | 27.4 | 0 | 65.7 | 29.4 | 0 | 66 |
| 20:00 | 27.2 | 0 | 63.3 | 26.5 | 0 | 66.8 | 27.5 | 0 | 66.8 | 28,8 | 0 | 68.7 |
Source: Field Survey (July 2010) PG (W&S) Average Ventilation Coefficient=0.28 (PG -VC=0.28); UG Ventilation Coefficient = 0 ( UG -VC=0) NFH Ventilation Coefficient=0.7 (NFH, VC=0.7 PG-W=PG Hostel-West wing, PG-S = results for the PG Hostel-South wing.
The correlation test was carried out to compare the performance of the two major orientation wings used in Hostel designs at UNEC namely the PG Hostel-West wing and the PG Hostel-South wing. It was discovered that PG-S which had fewer rooms and was assumed to have an orientation which did not align with the anticipated SW wind direction had a 1.34m/s ventilation coefficient, above the Global Standard ventilation coefficient of (≥0.6) and was found to be better than the PG-W, where the rooms were stacked with appropriate orientation to harvest the expected seasonal wind but had 0.5m/s. Temperature and relative humidity were within acceptable ranges of below 31.5˚C and 70% respectively (see Table 10 ). In addition, this test was used to compare the performance of the two major typologies, namely; the Post Graduate Hostel (Drew & Fry Hotel), which had an average ventilation coefficient of 0.28m/s and Kenneth Dike Hall- Undergraduate Hall (Ekwueme Hostel). which had a ventilation coefficient of 0.0m/s. They were both found to be below the global standard ventilation coefficient of (≥0.6). Similarly, the temperature and relative humidity were also within acceptable ranges of below 31.5˚C and 70%, respectively for the PG Hostel-South wing, which had a ventilation coefficient of 0.57m/s. and the New Female Hostel (NHF or Ogbuefi Hostel) had a ventilation coefficient of 0.7m/s. result, above the standard ventilation coefficient of (≥0.6) (see Table 4).
It was evident from these results that the building orientation was inconsequential, while the façade treatment was not appropriately designed to harvest wind from all sides. The adjoining structures could be among the major factors that restrained the wind meant for passive ventilation from entering the rooms using the outdoor airflow. Consequently, only the east-facing wing of the PG hostel could effectively leverage passive ventilation controls for indoor comfort during this season.
It is important to outline how outdoor temperature, air movement and humidity affect the comfort temperature of hostel occupants in hot-humid climates in the Comfort Scale climatic data (see Table 11). The results for Enugu State (southeastern Nigeria) using data from Table 11, show that comfort temperature overlaid on the outdoor temperature, indicating the temperature differential the building must achieve to remain comfortable indoors, was within range.
Table 11: Climatic Elements Comfort Scale
| Dry bulb temperature °C | Relative Humidity % | Desired wind speed in m/s |
| 27 | 90 | 0.2 |
| 28 | 85 | 0.3 |
| 28 | 90 | 0.7 |
| 29 | 70 | 0.22 |
| 29 | 85 | 1.2 |
| 30 | 65 | 0.38 |
| 30 | 75 | 1.5 |
| 31 | 60 | 0.7 |
| 31 | 65 | 1.4 |
| 32 | 55 | 1.2 |
Source: Central Building Research Institute Roorkee (U.P.) India, Ishwar Chand 1976. p24.
Dry season experiments- Wind path (November – February)
Figure 6 is the result of simulation analysis of wind velocity distribution at 2m height for south-east leading wind conditions on the Campus where the hotels are located. The result shows high wind pressure during this dry season of the year (Figure 6). This is expected to result in an increased rate of airflow into the buildings, and by extension an improvement in passive ventilation
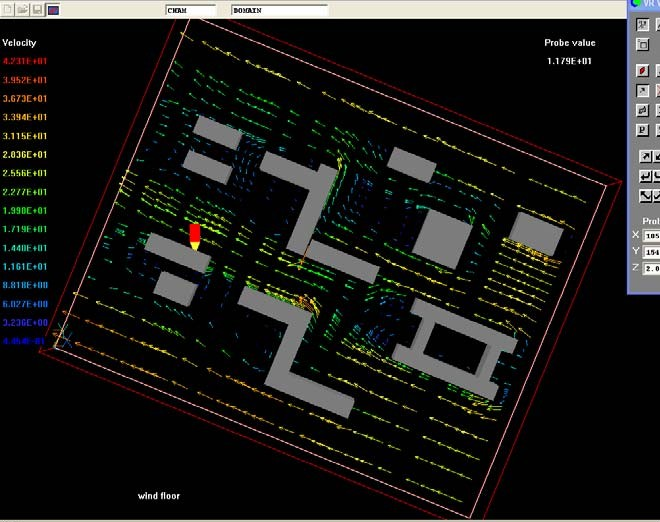
Figure 6: Wind velocity distribution at 2m height for south-east leading wind
Source: Author’s Field Survey (2010)
Table 12 shows the room air velocity, determining the rate of airflow, temperature and relative humidity, in the Hostel rooms tested.
Table 12: Measured wind speed and direction at the study area during the harmattan season
| Time | 16 November 2010 | |
| Wind direction | Wind speed m/s | |
| 06:00 am | NE | 0.6 |
| 07:00 am | NE | 0.9 |
| 08:00 am | NNE | 0.0 |
| 09:00 am | SE | 1.4 |
| 10:00 am | NE | 1.3 |
| 11:00 am | SE | 1.0 |
| 12:00 pm | NNE | 1.2 |
| 01:00 pm | NNE | 1.0 |
| 02:00 pm | NE | 0.5 |
| 03:00 pm | NNE | 1.2 |
| 04:00 pm | NNE | 1.7 |
| 05:00 pm | NNE | 2.7 |
| 06:00 pm | NE | 1.1 |
| Average wind speed | 1.1 | |
Source: Author’s Field Survey (2010)
These tests were carried out to compare the performance of the two major typologies in UNEC namely the Post Graduate Hostel which had a ventilation Coefficient of 0.51m/s and the Undergraduate Hostel had a Ventilation Coefficient of 0.08m/s. They were both found to have improved because of the slight improvement of outdoor wind but still below the global standard ventilation coefficient of (≥0.6m/s) in the Postgraduate and the Undergraduate Hostels. Similarly, the temperature and relative humidity were also within acceptable ranges of below 31.5˚C and 70%, respectively. Notably, these two major prototypes were not designed or arranged to harvest varied wind. Also, the pressure was reduced due to adjacent structures, preventing proper harvesting of the wind for passive ventilation. The wind direction was unreliable and unpredictable, so orientation became irrelevant and not useful for maximal wind harvest.
Wind Environment and Behaviour around the hostel buildings
A computer simulation was performed using computational fluid dynamics (CFD) as a tool to evaluate the wind environment around the hostel buildings and to ascertain the wind behaviour around the building. Computer simulation was necessary to predict the effect of wind movement on natural ventilation and to optimize the site planning criteria during designs. For this study, all iterations were observed for a basic airflow pattern within the environment. The wind speed and direction data in Table 12 were considered in creating the necessary wind speed and wind direction for the (CFD) model.
Measuring at the height of 12.6m, the wind paths recorded, presented in Table 13, a different pattern for the rainy season, while the dry season wind was mostly normal. This pattern which probably occurred due to the deflection of wind direction by terrain, vegetation, building clusters, climate change and other environmental factors contributes greatly to the problem of effectively harvesting the natural airflow during the rainy season.
Table 13: Experimentation and Evaluation of Dry Season Climatic Factors (November-March)
| Time | Outdoor Climatic Factors of the Hostel Region | Room Climatic Factors of Drew & Fry Hostel Design Strategy (PG) | Room Climatic Factors of Ekwueme Hostel Design Strategy (UG) | Room Climatic Factors of Ogbuefi Hostel Design Strategy (NFH) | ||||||||
| Temp | Air Vel. | RH. | Temp | Air Vel. | RH. | Temp | Air Vel. | RH. | Temp | Air Vel. | RH. | |
| 6:00 | 28.2 | 0 | 65.8 | 27.2 | 0 | 68.8 | 27.9 | 0 | 68.1 | 27.1 | 0 | 65.8 |
| 7:00 | 31.2 | 0 | 67.2 | 29.7 | 0 | 60.5 | 29.5 | 0 | 65.1 | 29.3 | 0.1 | 61.5 |
| 8:00 | 29.4 | 0.8 | 61.7 | 29.2 | 1.2 | 61.9 | 29.7 | 0 | 62.4 | 29.2 | 0.9 | 60.9 |
| 9:00 | 30.2 | 0.8 | 57.6 | 30.5 | 0.8 | 56.3 | 30.1 | 0 | 58.6 | 30 | 0.9 | 57.3 |
| 10:00 | 31.6 | 0 | 53.9 | 30.2 | 0 | 55.5 | 31.2 | 0 | 54.3 | 31.1 | 0.2 | 55.5 |
| 11:00 | 32.9 | 0.7 | 49.4 | 31.8 | 0 | 52.2 | 32.6 | 0.2 | 50.4 | 31.1 | 0.5 | 52.2 |
| 12:00 | 33.5 | 0.6 | 46 | 32.5 | 1 | 51.2 | 32.9 | 0 | 52 | 32 | 1 | 52.2 |
| 13:00 | 32.3 | 1.8 | 51.2 | 31.1 | 1.6 | 56.5 | 31.9 | 0.6 | 54.8 | 31.2 | 1.2 | 55.5 |
| 14:00 | 33.7 | 2 | 46.7 | 31.2 | 1 | 55.1 | 32.3 | 0 | 53.8 | 31.2 | 1.1 | 55.1 |
| 15:00 | 31.1 | 1.2 | 55.7 | 30.5 | 0.8 | 57.7 | 30.7 | 0 | 58.4 | 30.8 | 1.1 | 57.7 |
| 16:00 | 30.1 | 3.3 | 61 | 29.4 | 1.4 | 63 | 29.6 | 0.9 | 63.7 | 29.6 | 1.6 | 61.4 |
| 17:00 | 28.4 | 1.2 | 60.3 | 29.4 | 0.8 | 60.1 | 28.3 | 0.2 | 62.1 | 29 | 1 | 62.1 |
| 18:00 | 28.6 | 1.4 | 63 | 28.2 | 0.8 | 63.9 | 28.2 | 0.6 | 67.7 | 28.2 | 0.9 | 63.1 |
| 19:00 | 28.2 | 0 | 63.1 | 28 | 0 | 65.3 | 27.9 | 0 | 67.2 | 28 | 0.2 | 64.3 |
| 20:00 | 28.2 | 0 | 65.8 | 27.2 | 0 | 68.8 | 27.9 | 0 | 68.1 | 27.2 | 0 | 65.8 |
Source: Field Survey (November 2010) PG Ventilation Coefficient=0.51, (NFH, VC=0.51) UG Ventilation Coefficient=0.08, (UG, VC=0.08) NFH Ventilation Coefficient=0.94 (NFH, VC=0.94)
The CFD simulation performed using the wind path and pressure information in Tables (10 and 12) and Figures (5 and 6) produced the actual behaviour of the air movement around the hostel buildings in the University of Nigeria, Enugu Campus. From the results already presented here, ventilation was identified as an inadequate factor for thermal comfort in the study area. Notably, ventilation was identified as an inadequate factor for thermal comfort in the area. Specifically, the wind path was found not to be universal, consistent or in consonance with the given period of the rainy season. This made orientation, which was supposed to be a major factor in wind-driven passive ventilation systems, inconsequential and irrelevant as the wind could not be properly harvested into the hotels as expected. This was due to variations in wind directions and arrangement of the architectural characters (building façade characters). It was therefore evident that the architectural characteristics of the buildings might have been the major factor restraining passive ventilation for thermal comfort via the outdoor airflow.
From a theoretical perspective, this study has explored the knowledge of factors influencing thermal comfort in naturally ventilated Student Hostels in the hot-humid tropical environment of Nigeria. The key theoretical contribution of this study is that architectural characters (building façade characters) were found to have solutions for building clusters and low wind pressure when combined with the volumetric design principle. This is a combination of wind and stacks with roof apertures (Bernoulli – Venturi effect).
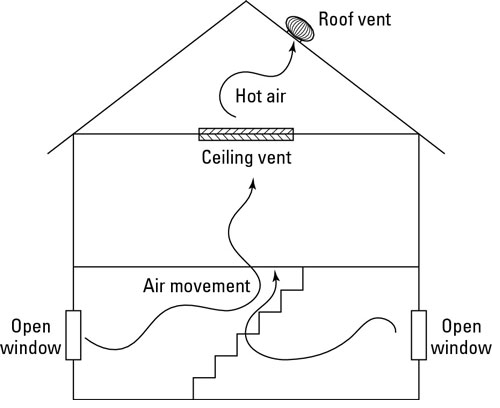 Figure 7: Combination of windows and roof openings for effective natural ventilation
Thus, this is recommended as an effective design strategy for effective natural ventilation for thermal comfort, in naturally ventilated buildings, in every possible scenario of the study area. Tropical buildings should have the ability to immediately respond and to be modified accordingly, to suit the occupants’ thermal needs. Innovative façade-designs such as apertures on every external wall for maximum wind harvest should also be encouraged in combination with the Bernoulli – Venturi effect, if thermal comfort should be guaranteed all year round, irrespective of the wind direction of the zone. With innovative façade-designs, at least 50% of every external wall will have apertures, which are not less than 25% of the floor area of the room and fenestrations for maximum varied wind harvest, the number of floor levels should be increased to four, for better stack effect using high-level indoor air vents in every room feeding the central ventilation core with a roof vent.
Computer simulation of the experimental Model showed that with proper application of these innovative principles, an improvement in ventilation, well above 0.72m/s, of the New Female Hostel is guaranteed all year round. There is no gaining that nowadays, great architecture is also designed by instinct and in unison with nature. Underneath, the intuitive solution is still there” [24]. In this context, only the east-facing wing of the PG hostel and those not shielded from the pressure of the wind can effectively apply passive ventilation controls for indoor thermal comfort during this season, as the pressure of the wind is shielded by other structures before them, as shown in wind paths and the wind pressure diagrams (See Figures 5 and 6). As demonstrated in the experimental model, the applicability of innovative façade design and the knowledge base actions are required to mitigate thermal comfort problems in the hot-humid tropics.
CONCLUSION, STUDY IMPLICATIONS AND RECOMMENDATIONS
This study investigated the effects of design strategies on thermal comfort in naturally ventilated student hostels. The results revealed that there was a significant correlation between design strategies which were hinged on ventilation, temperature and relative humidity with passive ventilation for thermal comfort. The study has further confirmed that ventilation has a significant impact on thermal comfort in naturally ventilated student hostels in hot-humid tropical environments. This suggests that the massive usage of mechanically induced ventilation equipment devices like fans and air conditioners is evidence of a lack of adoption of design strategies that optimise natural ventilation in buildings.
Based on the findings of this research the following recommendations are made. The first conclusion is that the knowledge of passive design strategies for effective natural ventilation of hostel buildings should be widely circulated for eventual application by architects and other building design professionals. This will drastically reduce the use of fossil fuel and energy consumption in the student hostels in the hot-humid tropical environment. Second, architects need to carefully undertake climatology and ventilation design strategies studies for any microclimate before embarking on any design if maximum wind harvest and improved stack for natural ventilation of interiors of buildings are to be achieved. Third is that for effective natural ventilation maximum wind harvest inlets, not dependent on a prevailing wind path should be provided on every external wall, and roof to accommodate variable wind direction.
This study is limited to hotels at the University of Nigeria, Enugu Campus (UNEC) and thus, the findings cannot be generalised for other hostels within and outside Enugu. The study used data collected during November and March, this implies that the findings cannot be generalised for every other month of the year. In addition, the research did not involve stakeholders such as students, faculty, and facility managers in the research process to determine the extent to which the suggested design interventions align with the needs and preferences of the end-users and long-term acceptance. Given these limitations, further studies are required in other hostels within and outside Enugu and across other months of the year. Future studies should also engage end-users of the buildings to gain insight into their perspective of any recommended design solutions.
REFERENCES
- Chand, I. (1976). Design Aid for Natural Ventilation in Buildings” in Functional Aspect of Building Design, Lecture Programme, CBRI, Roorkee (U.P.) India. April 26-28, Pp 24 – 36.
- Rajapaksha, I. (2004). Passive Cooling in the Tropics: A Design Proposition for Natural Ventilation”. Plea.2004- The 21st Conference on Passive and Low Energy Architecture, Eindhoven, The Netherlands, 19-22 Sept. Pp 1-6.
- Arens, E.A. and Watanabe, N. (1986). A Method for Designing Naturally Cooled Buildings Using Bin Climate Data. E-Scholarship Repository. University of California Pp 779-792.
- Lechner, N. (1991) Heating, Cooling, Lighting. Design Methods for Architects. New York: John Wiley & Sons. Pp 173-206.
- Uzuegbunam, F.O. (2012) Evaluation of the effectiveness of design strategies for passive ventilation in a hot-humid tropical environment: A case study of the design strategies used in student hostels of the University of Nigeria Enugu campus. JP Journal of Heat and Mass Transfer. Vol. 6, No.3, 2012, Pp 235-275.
- Von Meiss, P. (1991) Elements of Architecture, from Form to Space. Lausanne, Switzerland: Chapman and Hall. Pp Ix-10.
- Burberry, P. (1979) Environment and Services. London: BT Baisford Limited. 32-38.
- Boutet, T.S. (1987) Air Movement. A Manual for Architects Controlling and Builders. New York: McGraw Hill. Book Company. Pp 41-142.
- Santamouris, M. (1998) Natural Ventilation in Buildings. A Design Guide. London: James & James (Science Publishers) Lt
- Institute of British Architects Publications (1965) Architectural Practice and Management Handbook. London: Royal Institute of British Architects Publications.
- Watson, D. (1982). “Bioclimatic Design Research Advances” in Solar Energy in Boer K.W. (ed) New York: Plenum Press.
- Walker, A. (2003) Natural Ventilation Design Guidance. National Renewable Energy Laboratory. Pp 3-4.
- Komolafe, L.K. (1988). Influence of Climate on Building Design and Thermal Performance Assessment of some Construction Materials” in Omange G.N. (ed) Ten Years of Building and Road Research Commemorative Publication. Lagos: NBRRI) Pp 95-108.
- Tantasavasdi, C., Srebric, J. & Chen, Q. (2001) Natural Ventilation Design for Houses in Thailand. Thailand: Energy and Buildings. 33,8, Pp 815-824.
- IHVE (1970) A Guide Book. London: Institution of Heating and Ventilation Engineers.
- Baiyewu, O. (2002) Post-Occupancy Evaluation: The Missing Link in Nigerian Architectural Practice”. Journal of Environmental Technology School of Environmental Technology, Vol.1, No. 2, Pp 49-55.
- Liman, K. & Abadie, M. (1998). Naturally Ventilated Buildings – Porte Ocean Residence, in Allard F. ed., Natural Ventilation in Buildings. London: James and James (Science Publishers) Ltd. (1998). 307-314.
- Guarracino, G. & Richalet, V. (1998). Natural Ventilation in Buildings”. in Allard F. ed., Natural Ventilation in Buildings. London: James Science Publishers) Ltd. Pg. 315-325
- Nicol, J.F. & Humphreys, A.M. (2002) Adaptive thermal comfort and sustainable thermal Standards for buildings, Energy & Building Pp 563.
- Bordens, K.S. & Abbott, B.B. (2008) Research Design and Methods. A Process Approach 7th Ed. Pp 428-438 McGraw-Hill: New York
- Rummel, R. (1970). Applied Factor Analysis, Evanston III: Northwest University Press.
- Kerlinger, F.N. & Lee, H.B. (2000) Foundations of Behavioural Research, Wadsworth, U.S.A.
- Kim, J. (1975). Factor Analysis. in H. Norman et al Statistical Package for the Social Sciences (SPSS), Pp 468-514.
- Corbusier, Le (1967). Towards a New Architecture Architectural Press Ltd, London.