Nutritional Composition, Rancidity Profile and Sensory Acceptability of Bread Produced Using Shea Butter as Shortening
- Jimoh, K. O
- Osunrinade, O. A
- Adedokun, S. O
- Akute, B. R
- 233-241
- Jul 4, 2024
- Food Science and Technology
Nutritional Composition, Rancidity Profile and Sensory Acceptability of Bread Produced Using Shea Butter as Shortening
Jimoh, K. O; Osunrinade, O. A; Adedokun, S. O; Akute, B. R
Department of Food Science and Technology, The Oke-Ogun Polytechnic, Saki Oyo State, Nigeria.
DOI: https://doi.org/10.51584/IJRIAS.2024.906021
Received: 26 December 2023; Accepted: 05 January 2024; Published: 04 July 2024
ABSTRACT
The high cost of commercially available butter for bread production in developing countries is increasing bread prices but, in West Africa shearbutter which is a cheap vegetable fat has less utilization. Therefore, this study aimed to evaluate the effects of its addition on bread production. Shea butter (Raw and deodorized) were added to bread dough at 15, 20, 25 and 30 g and 20g of margarine added to bread dough served as a control sample. The proximate composition, peroxide value and free fatty acid of the bread samples were determined and sensory acceptability of bread samples were determined by 25-member panelist. The percentages of crude protein, moisture, crude ash, crude fat, crude fibre and carbohydrate contents of the bread samples ranged as 13.77 – 28.89, 28.13 – 31, 0.83 – 1.83, 1.89 – 3.62, 0.27 – 0.85 and 34.26 – 53.45%, respectively. The peroxide value and free fatty acid ranged as 7.00 – 14.27 meq/kg and 0.075 – 0.132%, respectively. Shea butter inclusion led to a significant increase in crude protein, ash and crude fat contents and significant difference in all the sensory parameters evaluated. However, acceptability rating showed that addition up to 25g of raw or deodorized Shea butter could be acceptable.
Keywords: Bread, Shea butter, Deodorization, Quality
INTRODUCTION
Bread is a bakery product produce from wheat flour and is priced for its taste, aroma and texture. Bread has become a staple food throughout the world and most people consumed it on a daily basis. It is prepared by baking dough of flour and water (Hamelman, 2004). The popularity of bakery products has contributed to increased demand for ready-to-eat, convenience food products, such as bread, biscuits and other pastry products (Kaur et al., 2012). However, fats, such as butter vegetable oils, lards or that contained in eggs, affect the development of gluten in breads by coating and lubricating the individual strands of protein. They also help to hold the structure together. A fat content of approximately 3% by weight is the concentration that produces peak leavening action (Cauvain and Young, 2007). The high cost of commercially available vegetable fat in developing countries is a major challenge to food security. Another source of vegetable fats in some African countries like Nigeria is a locally produced natural butter from shea tree having closely related properties (texture, color, ability to solidify and liquefy with change in temperature) (Olajide et al., 2000).
Shea butter is a vegetable fat produced from the seeds of Vitellaria paradoxa C.F. Gaertn. It is a unique natural product of African countries and is of great nutritional and commercial significance (Maranz et al., 2004). Shea butter is used as a base for medicinal ointments, and has been claimed to have anti- inflammatory, emollient and humectants properties. In West Africa, especially Ghana, Nigeria and Togo, shea butter is used as cooking oil (Olajide et al., 2000). Shea butter is edible and may be used in food preparation and occasionally the chocolate industry uses shea butter as a substitute for cocoa butter, although the taste is different. Due to its rich nutritional content, shea butter has found market as baking fat, margarine and other fatty spreads, confectionery and chocolate industry in Europe and Asia (Akhter et al., 2008). At room temperature shea butter could be a creamy solid that easily spreads like dairy butter on bread.Bakery fats (shortenings) are tailored fat systems, whose nutritional and functional properties have been modified in order to deliver specific functional needs; as tenderizing agents, facilitate aeration, texture, mouthfeel, carry flavours and colours, provide a heating medium, and structural integrity to pies, breads, pasta and other bakery products (Rios et al., 2014). This modification gives desirable consistency and keeping quality. The use of Shea butter in bread production will further enhance the utilization of these agricultural raw materials and could provide a brand that will compete favorably with the predominant palm stearinbased margarine and shortenings in Nigeria market. Also, Shea butter is cheap and if properly processed with improved sensory and keeping qualities can complement and compete with groundnut and other vegetable oils (Israel, 2015), which have become too expensive for regular household use. Hence, the aim of this study was to evaluate the effect of shea butter addition on the nutritional composition, rancidity profile and sensory acceptability of bread.
MATERIALS AND METHODS
Materials
The Shea butter fruit was obtained from a local market in Saki, Oyo state. Wheat flour and other baking ingredients were also obtained from the same source. All reagents used were of analytical grades and equipment used were mixing machine (Laboratory Kenwood type), oven (Gas), blender, weighing balance, and kneading machine.
Processing of Raw and Deodorized Shea Butter
Shea butter was produced using the method of Babatunde and Olaoye (1997) as shown in figure 1. Ripe fresh Shea fruits were sorted, left to ferment for 3 days at ambient temperature (26 ± 2 oC) to remove pulp. The Shea seed was washed and parboiled for 10 minutes, sundried for four hours before size reduction using mortar and pestle. Subsequently, grinding and Shea butter extraction from 5kg of Shea powder was done. Five kilograms of the Shea paste was slowly hand-mixed and churned with gradual addition of warm water before it was vigorously churned till a brownish white shea fat separated from the brownish water solution. The Shea fat was scooped out and washed several times using potable water to remove the brownish colour. The fat was heated to melt and water dried off. The Shea oil was allowed to cool and settle overnight before filtration through muslin cloth. The filtered oil was measured and packaged into clean plastic sample for solidification. The packaged solidified Shea butter samples were stored in the freezer till required. The processing flow chart is as shown in Figure 1. The deodorized shea butter was produced by subjecting the raw shea butter to bleaching by heating at 100 ºC for 10mins.
Production of Bread Samples
The bread samples were processed using straight dough method as described by AACC, (1990). Wheat flour was measured into the mixer and sugar, salt, yeast, flavor and improvers added and were mixed using laboratory Kenwood mixer. Then margarine was replaced by shear butter (raw and deodorized) at 15g, 20g, 25g and 30g level as experimental samples and 25g margarine as control sample with water added and was mixed to becomes a dough. The resulting dough was kneaded and cut into sizes and left in the baking pan for about 1 to 2 hours to ferment. After fermentation, the fermented dough was baked at 350˚C for 45 minute, cooled and packaged in a polyethylene bag. The flow charts for bread processing are presented in figure 2.
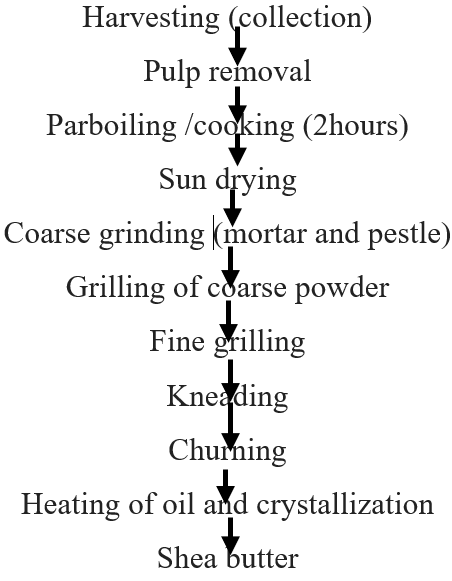
Figure 1: Flow chart for the local processing of shea butter
Source:Babatunde and Olaoye, (1997).
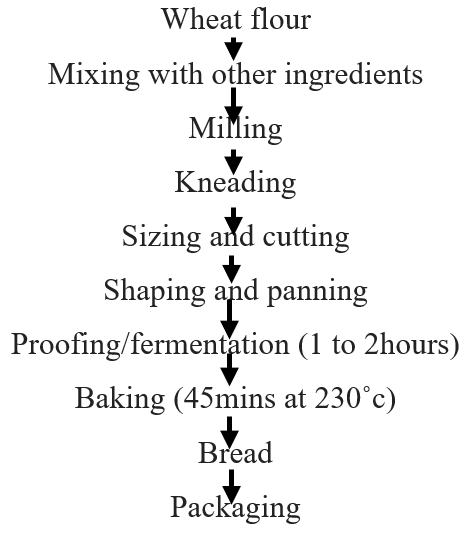
Figure 2: Flow chart of bread production
Source: (AACC, 1990).
ANALYSIS OF SAMPLES
Determination of Nutritional Composition of Bread Samples
Moisture, ash, crude fat, protein and crude fibre content were determined by the AOAC (2005). Moisture content was determined using the air oven method and ash using muffle furnace operated at 600˚C for 6 hours. Crude fat was determined by using soxhlet extraction method while protein content was by the kjeldahl apparatus. Carbohydrate was determine by difference (subtracting the moisture, ash, crude fat, protein and crude fibre from hundred).
Determination of Rancidity Profile of Shea Butter Bread
The rancidity profile of the bread samples were evaluated by using the peroxide and free fatty acid composition of oil extracted from the bread samples.
Determination of Peroxide Value of Bread Sample
Peroxide value of bread samples was determined from oil extracted. 20ml of 2:1 v/v of glacial acetic acid and chloroform together with 1 g of KI were added to 1 g of oil sample. The mixture was boiled for 60 seconds. The hot mixture was added to 20 ml of 5% KIO3 solution after which starch solution was added in drop. The mixture was then titrated against 0.025 M Na2S2O3 solution. The titre value was used to calculate the peroxide value.
Determination of Free fatty acid of Bread Sample
Extracted oil sample was analyzed for free fatty acid using AOAC method 940.28 (AOAC, 2000). 2ml of 1 % phenolphthalein solution was added to 20 ml of a mixture 0f 1: 1 v/v ethanol and diethyl ether which was carefully neutralised with 0.1 N NaOH. 1 g oil sample was added to the mixture and then titrated against 0.1 N NaOH solution. Titre value was taken when persistent pink colour end point was reached. The titre value was used to calculate the acid value and the free fatty acid.
Sensory evaluation of Bread Samples
A total of 25 untrained assessors drawn from the community of the Oke-Ogun Polytechnic Saki served as panelist to assess the bread with shea butter and the bread without shea butter (control). Sensory evaluation was carried out on all the samples using 9 – point hedonic scale, the scale ranges from 1–dislike extremely to 9-like extremely. The following attributes: appearance, colour, viscosity, texture, taste and the overall acceptability were evaluated.
Statistical analysis
All data obtained were analyzed using SPSS version 16.0. The mean and standard error of means (SEM) of the triplicate analyses was calculated. The analysis of variance (ANOVA) was performed at 5% significant difference between the mean, while the means was separated using the new Duncan Multiple range test.
RESULTS AND DISCUSSION
Nutritional composition of Bread samples
Table 1: The effect of Shea butter addition on the proximate composition of bread
| Parameters | Crude Protein (%) | Moisture (%) | Ash Content (%) | Crude Fat (%) | Crude Fibre (%) | Carbohydrate (%) |
| RBB | 13.77e±0.69 | 29.60a±0.87 | 0.83c±0.57 | 1.89f±0.06 | 0.45c±0.06 | 53.45a±1.01 |
| RSB0 | 17.33d±0.33 | 30.53a±0.70 | 1.16±abc0.28 | 3.22e±0.02 | 0.47c±0.02 | 45.25bc±0.87 |
| RSB1 | 18.89c±0.19 | 29.33a±2.03 | 1.43abc±0.11 | 3.22e±0.02 | 0.66b±0.01 | 47.76b±2.09 |
| RSB2 | 20.44b±0.83 | 30.47a±0.50 | 1.50abc±0.00 | 3.42bc±0.02 | 0.67b±0.02 | 44.03c±0.77 |
| RSB3 | 28.89a±0.83 | 30.73a±1.15 | 1.83a±0.28 | 3.62a±0.01 | 0.85a±0.02 | 34.26e±0.41 |
| DSB0 | 19.44bc±0.83 | 29.93a±1.01 | 1.07bc±0.11 | 3.33d±0.06 | 0.49c±0.03 | 45.20bc±1.48 |
| DSB1 | 19.56bc±0.19 | 31.00a±2.12 | 1.07bc±0.11 | 3.36cd±0.05 | 0.31de±0.06 | 44.11c±2.23 |
| DSB2 | 19.89bc±0.83 | 28.93a±1.92 | 1.17abc±0.76 | 3.42bc±0.03 | 0.41cd±0.04 | 46.68bc±2.36 |
| DSB3 | 28.22a±0.50 | 28.13a±2.39 | 1.53ab±0.05 | 3.49b±0.06 | 0.27e±0.06 | 38.98d±2.48 |
Values with difference letter superscript in the same column are statistically different (P<0.05).
Key: RBB = Refined butter bread (control); RSB0 = 15g raw Shea butter bread; RSB1 = 20g raw Shea butter bread, RSB2 = 25g raw Shea butter bread; RSB3 = 30g raw Shea butter bread; DSB0 = 15g deodorized Shea butter bread; DSB1 = 20g deodorized Shea butter bread; DSB2 = 25g deodorized Shea butter bread; DSB3 = 30g deodorized Shea butter bread.
Discussion
The effect of Shea butter addition on the proximate composition of bread samples is presented in Table 1. The values for crude protein, moisture, crude ash, crude fat, crude fibre and carbohydrate contents of the bread samples ranged from 13.77 – 28.89%, 28.13 – 31.00%, 0.83 – 1.83%, 1.89 – 3.62%, 0.27 – 0.85% and 34.26 – 53.45%, respectively. There was significant different among the samples in all the proximate parameters evaluated except for moisture content. Crude protein, ash and crude fat contents of the bread samples increased as the Shea butter addition increased with highest values in 30g of raw and deodorized Shea butter sample and the control sample had the least value. The protein content increased agreed with Enaberue et al., (2014) reported values of 8.29, 8.24 and 6.29% for Shea butter obtained from different regions in Nigeria. Proteins play an important role in nutrition (catalyzing, regulating, protecting and providing energy) and consumption of Shea fruit protein can supplement plant protein such as bean and peas widely consumed in many rural communities (Okullo et al., 2010). The high moisture (28.13 – 31.00%) of samples could affect the shelf life of the bread samplesas high moisture could aid microbial growth leading to short storage life (Ezeama, (2007; Onwuka, 2005).The ash content of bread samples increased significantly with increased Shea butter (raw and deodorized) addition with 30g raw Shea butter having the highest value (1.83%) closely followed by 30 g deodorized Shea butter sample (1.53%) and the control samplethe least value (0.83%). Enaberue et al., (2014) reported value of 5.5–6.9% ash content for Sheabutter fruit and lower value denotes low biomass energy valueand a measure of the mineral content of the food (Onwuka, 2005).
Crude fat content increased significantly as Shea butter addition increasedwith 30g sample having the highest value (3.62%) and the control the least value. While raw Shea butter had higher values than deodorized Shea buttersample as a result ofraw Shea butter having saturated fats acids called “medium chain triglycerides” (MCTs), which is easily digested and readily burned for energy without the spike in blood sugar, thus becoming beneficial to people with diabetes and weight loss (Pamela et al., 2005). Also, it is less deposited in adipose tissue causing no obesity (Cecille dela Paz et al., 2010). Lipid is a good sources of energy, aids in transport of fat soluble vitamins, insulates and protects internal tissues and contributes to important cell processes (Jones et al., 1985; Pamela et al., 2005). Crude fibre content also increased with increasing level of Shea butter addition with 30g sample having highest value andthe control sample had the least value. The increase might be attributed to the high value of fibre in Shea butter fruit (10.25-17.4%) as reported by Enaberue et al., (2014). Fibre helps in peristaltic movement of the intestinal tract,reduce occurrence of constipation, colon diseases, diabetes, cardiovascular diseases and obesity, type 2 diabetics and cardiovascular related diseases (Omosuli et al., 2009). However, it is imperative to note that very high intakes of fiber (i.e., above 50 to 60 g/day) can result in hard, dry stools that are painful to eliminate (Byrd- Bredbenner et al., 2013). While carbohydrate content decreased as the level of Shea butter increased which agreed with resultof Makinde and Makanjuola, (2017) in addition of margarine and/or coconut oil on quality of bread prepared from wheat flour.
Rancidity Profile of Shea Butter Bread
Table 2: The effect of Shea butter addition on the rancidity profile of bread
| Parameters | Peroxide Value (PV) Meq/Kg) | Free Fatty Acid (FFA)(%) |
| RBB | 6.67c±0.57 | 0.094±cd0.06 |
| RSB0 | 7.00±c2.00 | 0.056±f0.00 |
| RSB1 | 8.00±c3.60 | 0.075±e0.01 |
| RSB2 | 8.73±bc1.41 | 0.085±de0.00 |
| RSB3 | 12.00±a1.00 | 0.132±a0.01 |
| DSB0 | 7.00±c0.00 | 0.052±f0.01 |
| DSB1 | 8.03±c0.45 | 0.103bc±0.01 |
| DSB2 | 11.50±ab0.50 | 0.112b±0.00 |
| DSB3 | 14.27±a2.75 | 0.141a±0.00 |
Values with difference letter superscript in the same column are statistically different (P<0.05).
RBB = Refined butter bread (control); RSB0 = 15g raw Shea butter; RSB1 = 20g raw Shea butter, RSB2 = 25g raw Shea butter; RSB3 = 30g raw Shea butter; DSB0 = 15g deodorized Shea butter; DSB1 = 20g deodorized Shea butter; DSB2 = 25g deodorized Shea butter; DSB3 = 30g deodorized Shea butter.
Discussion
The effect of shea butter addition on the rancidity profile of bread is presented in Table 2. The values for peroxide value and free fatty acid ranged from 7.00 – 14.27 meq/kg and 0.075 – 0.132%, respectively. There was significant difference in the rancidity profile among the samples with peroxide value increased significantly as the level of Shea butter addition increased. The peroxide values of shea butter samples are below the maximum acceptable value (except for bread samples with 30g unrefined shea butter, and 25g and 30g deodorized samples with values of 12.00Meq/kg, 11.50Meq/kg and 14.27Meq/kg respectively) of 10 meq KOH/g set by the Codex Alimentarius Commission for groundnut seed oils (Abayeh et al., 1998). The low peroxide values could be an indication that the bread samples would not easily go rancid when properly stored free from atmospheric oxygen and other contaminants. Kirk and Sawyer (1991) described peroxide as a first product of oxidation of unsaturated fats and oils.
The free fatty acid of the bread samples was significantly influenced by addition of Shea butter. The highest value of free fatty acid was obtained from deodourised shea butter bread. This could be due to the dcomposition cause by heat treatment during the process of deodourisation. The decomposition of triglycerides is also measured by free fatty acid (FFA) percentage. The maximum tolerated amounts of FFA for cosmetic and food uses are 1% and 3%, respectively (Kassamba, 1997). This indicates that the values obtained in this study are within the range of 3% maximum tolerable amount. FFA produced irritation on the tongue and in the throat (Kirk and Sawyer, 1991).
Sensory Acceptability of Bread Samples
Table 3: The effect of Shea butter addition on the sensory attributes of bread
| Samples | Texture | Flavour | Taste | Appearance | Aftertaste | Mouth feel | Overall Acceptability |
| RBB | 7.93a±0.88 | 7.67a±0.82 | 8.00a±1.20 | 8.13a±0.92 | 7.67a±0.82 | 7.87a±1.13 | 8.40a±0.91 |
| RSB0 | 7.40ab±1.35 | 6.87ab±1.55 | 6.73b±1.44 | 7.80ab±1.26 | 6.67ab±1.45 | 7.20ab±1.15 | 7.07b±1.39 |
| RSB1 | 7.33ab±1.23 | 6.80ab±1.08 | 6.73b±1.33 | 7.33b±1.76 | 6.60ab±1.40 | 6.93ab±1.22 | 7.07b±1.10 |
| RSB2 | 7.13ab±1.46 | 6.67abc±1.50 | 6.47bc±1.85 | 7.00ab±1.31 | 6.47b±1.85 | 6.53b±1.68 | 7.00b±1.41 |
| RSB3 | 6.60b±1.06 | 5.47c±2.03 | 5.40bc±2.03 | 6.80b±1.37 | 5.47bc±1.96 | 6.27b±1.91 | 6.40bc±1.80 |
| DSB0 | 7.60ab±1.50 | 6.53abc±1.51 | 6.13bc±1.51 | 7.47ab±1.19 | 6.47b±1.36 | 6.73b±1.49 | 6.80b±1.32 |
| DSB1 | 7.13ab±1.41 | 6.40bc±1.59 | 5.93bc±1.87 | 7.67ab±1.50 | 6.13bc±1.36 | 6.60b±1.35 | 6.47b±1.64 |
| DSB2 | 7.00ab±1.25 | 6.27bc±1.44 | 5.87bc±1.64 | 7.13ab±1.46 | 5.87bc±0.99 | 6.33b±1.45 | 6.33bc±1.45 |
| DSB3 | 6.73ab±1.49 | 6.20bc±1.37 | 5.27c±1.67 | 6.80ab±1.42 | 5.13c±1.60 | 5.07c±1.39 | 5.33c±1.54 |
Values with difference letter superscript in the same column are statistically different (P<0.05).
RBB = Refined butter bread (control); RSB0 = 15g raw Shea butter; RSB1 = 20g raw Shea butter, RSB2 = 25g raw Shea butter; RSB3 = 30g raw Shea butter; DSB0 = 15g deodorized Shea butter; DSB1 = 20g deodorized Shea butter; DSB2 = 25g deodorized Shea butter; DSB3 = 30g deodorized Shea butter
Discussion
The effect of Shea butter addition on the sensory attributes of bread is presented in Table 3. The mean score for texture, flavor, taste, appearance, aftertaste, mouth feel and overall acceptability ranged from 6.60 – 7.93, 6.53 – 7.67, 5.27 – 8.00, 6.80 – 8.13, 5.13 – 7.67, 5.07 – 7.87 and 5.33 – 8.40 respectively. Increase addition of Shea butter(unrefined and deodorized) decreased sensory scores for the acceptability of the bread samples but, addition still gives slightly liked. There was no significant difference in texture, flavour, appearance and mouthfeel, between the control sample and samples with up to 25 g of raw Shea butter but panelist preference for the taste decrease with increased level of shea butter addition. While the appearance of the bread outside layer gave of both control and rest samples gave smooth and golden brown color. The aftertaste and mouth feel of the bread samples was significantly different from the control sample when more than 20 g of raw shea butter was added. In general, in terms of sensory attributes, bread of acceptable sensory attributes could be produced with addition of both raw and deodorized shea butter with addition level of up to 25g shea butter (both raw and deodorized). The result obtained in this work was in close agreement with those obtained by Ifesan et al., (2012) for bread produced from 100% Shea butter spread.
CONCLUSION
Unrefined and deodorized Shea butter were used as shortening for bread production. There was significant difference among the samples in all the proximate parameters evaluated except for moisture content. The crude protein, ash and crude fat contents of the bread samples increased as a result of shea butter addition. With respect to the rancidity profile, the peroxide value and the free fatty acid of the bread samples increased significantly due to the addition of shea butter. The highest value of free fatty acid was obtained from deodourised shea butter bread. The values obtained in this study are within the range of 3% maximum tolerable amount for free fatty acid. There was significant difference in all the sensory parameters evaluated. However, sensory acceptability rating showed that bread of acceptable sensory attributes could be produced with the addition of up to 25g raw or deodorized shea butter.
REFERENCE
- AACC (1990). Optimized Straight-Dough Bread-Making Method; AACC International Method 10– 03; AACC International: St. Paul, MN, USA.
- Abayeh, O.J., Aina, E.A., & Okounghae, C.O. (1998). Oil content and oil quality characteristics of some Nigerian oils In Journal of Pure and Applied Sciences, 1(1), 17 – 23.
- Akther, S., Halim, A., Sohel, S.I., Sarker, S.K., Chowdhury, M.H.S., & Sonet, S.S. (2008). A review of the uses of non-timber forest products in beauty care in Bangladesh. In Journal of Forest Research. 1(19), 72 -78.
- AOAC. (2005) Association of Official Analytical Chemists (18th Ed.).Washington D.C. USA:
- Byrd-Bredbenner , Moe G., Beshgetoor D., & Berning J. (2013). Wardlaw’s perspectives in nutrition. 9th ed. McGraw-Hill International Edition.
- Cecille dela Paz M.D., Cecilia Jimeno M.D., Rody Sy M.D., Eduardo F,& Punzalan M.D (2010). The effect of virgin coconut oil on lipid profile and fasting blood sugar: A phase I clinical trial. Philipp J Intern Med, 48: 1-6.
- Enaberue, L. O., Obisesan, I. O., Okolo, E. C.& Ojo, A. (2014). Proximate and Chemical Composition of shea (Vitellaria paradoxa C.F. Gaertn) fruit pulp in the Guinea Savanna of Nigeria. World Journal of Agricultural Sciences 2 (4), 078-083.
- Ezeama F. (2007). Food microbiology: Fundamentals and applications. Natural Prints Limited, Lagos.
- Hamelman, Jeffrey (2004). Bread: a baker book of techniques and receipes. New York John wiley 7(13).
- Ifesan, B. O. T., Fasasi, O. S., & Ehoniyotan, F. A. (2012). Production Of Bread–Spread from Blends of Shea Butter (Vitellaria paradoxa), Garlic (Allium sativum), Ginger (Zingiber officinale), Scent Leaf (Occimum gratissimum), and Suya Spice. JMBFS: 1(6) 1406-1423.
- Ifesan, B.O.T., Siripongvutikorn, S., & Voravuthikunchai, P. (2009). Application of Eleutherine Americana crude extract in homemade salad dressing. In Journal of Food Protection. 72(3), 650-655.
- Ifesan, B.O.T., Siripongvutikorn, S., & Voravuthikunchai, S.P. (2010). Evaluation of the ability of eleutherine Americana crude extract as natural food additive in cooked pork. In Journal of Food 74(7), 353 – 357.
- Israel, M. O. (2015) Shea Butter: An Opposite Replacement for Trans Fat in Margarine. J Nutr Food Sci S11:
- Jones M.M., Johnson D.O., Netlerville J.T., Wood J.I., Joesten M.D (1985). Chemistry and Society. 5th , Saunders College Publishers U. S. A., 521- 577.
- Kassamba B (1997). Summary of known extraction and packaging techniques of shea butter in Burkina Projet fili`erekarit´e du CECI IRSAT. IRSAT, Ouagadougou.
- Kaur, A., Jassal, V., Thnd, S. S., & Aggarwal, P. (2012). Rice bran oil an alternative bakery shortening. Journal Food Science and Tecnology, 49(1), 110-114.
- Kirk R.S. & Sawyer R. (1991). Pearson’s Composition and Analysis of Foods. Longman Scientific and Technical, Harlow, P. 36.
- Makinde, F. M., & Makanjuola, O. (2017). Influence of Margarine and/or Coconut Oil on Quality of Bread Prepared from Wheat Asian Journal of Plant Science and Research, 2017, 7(1):23-30.
- Maranz, S., Wiesman, Z., & Garti, N. (2003). Phenolic constituents of shea (Vitellaria paradoxa) In Journal of Agriculture and Food Chemistry. 51(21), 6268-6273
- Okullo J.B.L., Omujal F., Agea J.G., Vuzi P.C., Namutebi A., Okello J.B.A., Nyanz S.A (2010). Physico-chemical characteristics of shea butter (Vitellaria paradoxa C. F. Gaertn.) oil from the shea districts of Afr. J. Food Agric. Dev., 10 (1): 2069-2084.
- Olajide, J.O., Ade, B.I.O., & Otunla, E.T.(2000). Some physical properties of shea kernel. In Journal of Agricultural Engineering 76(4), 419 – 421.
- Omosuli S.V., Ibrahim T.A., Oloye D., Agbaje R.,& Jude-Ojei B. (2009). Proximate and mineral composition of roasted and defatted Cashew Nut (Anarcadium occidentale) 8(10): 1649-1651.
- Onwuka, G. I. (2005). Food Analysis and Instrumentation; Theory and Practice. Naphthalic Prints, Surulere, Lagos, Pp219- 230.
- Pamela C.C., Richard A.H., & Denise R.F. (2005). Lippincotts illustrated Reviews Biochemistry 3rd , Lippincott Williams and Wilkins, Philadelphia, Pp. 335- 388.
- Rios, V., & Lannes, S. C. S. (2012). The influence of different fats in cake batter. In XVII Pharmaceutical Science and Technology Meeting – XLVII Sao Paulo University Pharmacy and Biochemistry Meeting – 4th Annual Research Symposium on Pharmaceutical Sciences, São Paulo. Brazilian Journal of Pharmaceutical Sciences, 48, 54-54.
- Rios, R. V., Pessanha, M. D. F., Almeida, P. F., Viana, C. L. & Lanne, S.C. (2014). Application of fat in some food Food Sci.Technol. 34 (1)