
Optimization of Nutrient Composition of Foam-Mat Dried Protein Rich Weaning Food Supplement Produced from Carrot Juice (Daucus Carota), Egg White and Crayfish (Nematopalaemon Hastatus)
- Ugwu Linus Ejiofor
- Ishiwu C. N.
- Mofunanya Grace Nneka
- Okocha Kalu Sunday
- 146-169
- Mar 28, 2025
- Food Science and Technology
Optimization of Nutrient Composition of Foam-Mat Dried Protein Rich Weaning Food Supplement Produced from Carrot Juice (Daucus Carota), Egg White and Crayfish (Nematopalaemon Hastatus)
Ugwu Linus Ejiofor*, Ishiwu C. N., Mofunanya Grace Nneka, Okocha Kalu Sunday
Department of Food Science and Technology, Nnamdi Azikiwe University Awka, Anambra State of Nigeria
*Corresponding Authors
DOI: https://doi.org/10.51584/IJRIAS.2025.10030011
Received: 19 February 2025; Accepted: 24 February 2025; Published: 28 March 2025
ABSTRACT
This study was carried out to evaluate the quality of protein rich food supplement of foam-mat dried carrot juice (Daucus carota), egg white and crayfish (Nematopalaemon hastatus) blend. Carrot root was cleaned and the juice extracted. Crayfish was cleaned, dried, milled and sieved; while egg white was separated from the egg yolk. The egg white was whipped to foam before crayfish and carrot juice were mixed. The design keys were egg white (20 – 30 g) crayfish (30-40 g) and carrot juice 30-40 g) which generated fourteen (14) runs. The samples generated were mixed and dried using foam-mat drying and subsequently subjected to laboratory analysis including proximate and mineral composition using standard methods. The result showed that in proximate composition, the higher the carrot juice powder, the higher the carbohydrate and moisture. The protein and fibre content of the samples also increased with higher crayfish addition. There was also high ash content in all samples; high fat was observed in samples with high concentration of carrot juice. The mineral composition showed that the calcium, potassium, zinc, magnesium, phosphorus and iron content increased with increase in the concentration of crayfish in the supplement. Ash, protein, carbohydrate, calcium, iron and phosphorus were selected for optimization. Optimized mixture ratio was 30 g egg white, 35.969 g crayfish and 34.031 g carrot juice powder and possessed the best nutrients of interest for child health with 92.9% desirability.
Keywords: Foam-mat dried, supplement, carrot, crayfish, egg, weaning food
INTRODUCTION
Complementary food refers to any healthful and energy-containing solid, semisolid or liquid meal consumed by babies aside from breast milk or formula (Okoronkwo et al., 2023). The awareness of malnutrition is necessary in infant feeding because childhood malnutrition is widely prevalent in many countries of the world, particularly in developing countries like Nigeria (Maja et al., 2019). Protein, energy and micronutrient malnutrition are the commonest forms. Micronutrients malnutrition in babies and young children became a major concern to public health nutrition before the World Summit for Children in the late 80’s. The focus expanded from protein and energy malnutrition to include other parameters such as vitamin A, iodine and iron deficiencies (Tiencheu et al., 2016). There is an emerging interest on zinc and copper nutrition (Barber et al., 2017). Complementary foods are usually introduced from the age of 4–6 months when breast milk, considered the best choice and the safest meal for young babies, can no longer supply the adequate nutrients and energy needed to enable the infant to grow and thrive (Javed et al., 2018). Adequate nutrition is needed during infancy and early childhood so as to ensure that a child grows optimally and does not have any nutritional deficiencies, as infancy is the most rapid period of growth in human life, as well an important period for cognitive, behavioral and physical development (Aduni et al., 2016). Inappropriate complementary feeding practices remain one of the most determinant factors that make children susceptible to irreversible outcomes of stunting, poor cognitive development and increased risk of infectious diseases (Okoronkwo et al., 2023). Fortified nutritious commercial complementary foods are unavailable especially in the rural areas and where available, they are often too expensive and beyond the reach of most families in Nigeria. FAO/WHO emphasized the use of local foods formulated in the home and guided by the following principles: high nutritional value to supplement breastfeeding, acceptability, low price and use of local food items (Ikunjenlola, 2014). The utilization and exploitation of a crop generally depends on the available knowledge on it. The dearth of information on acha, egg, crayfish and carrot in their optimum nutritional and functional properties has made these potentially beneficial crops under-utilized. As with egg, some undesirable constituents of egg include allergy that interfere with absorption and utilization of important protein and thus need to be treated prior to utilization. It is known that processing methods such as foam-mat drying inactivate the allergic compound in egg and other raw materials and can be used to improve the nutritional quality of the fortified cereals complementary food (Omah et al., 2017).
When liquids foods containing higher amount of water is considered to dry, foam-mat drying is suitably used. It is a drying technique for fruits and vegetable extracts which are very sensitive to heat and those which are viscous, sticky and difficult to dry. Using this technique a large range of food materials such as milk, vegetables puree, fruit juices and soluble coffee are dried without quality changes (Mogor et al., 2023). The foam mat drying process is an old technology re-gained importance due to various advantages such as high speed drying and the ability to control the final product properties (Maja et al., 2019).
Carrot (Daucus carota L.) is a nutritious root vegetable and also known as a multinutritional food source (Kamel et al., 2023). Carrots are root vegetables and are usually orange, but there are purple, black, red, white, and yellow varieties (Masresha et al., 2023). It is rich in natural bioactive compounds, such as phenolics, carotenoids, polyacetylenes, and ascorbic acid, fiber, and minerals. Hence, carrots can be used as a functional ingredient in any product to increase the biological and nutritional values (Kamel et al., 2023). Crayfish (Nematopalaemon hastatus) are small fresh water crustaceans that can be found in many parts of the world. These distinctive invertebrates are rich protein sources and serve as good protein supplements in our diets (Afolabi et al., 2018). Crayfish is a cheap source of protein and sea food similar to the much expensive shrimp and lobster, but much less in price and relatively short life span.
Crayfish are nutritious and valuable human food (similar to lobster) and are sold in fish market throughout the world (Ibironke et al., 2014). They are proximately composed of 13.86% ash, 58.14% protein, 1.28% crude fibre, 89.92% dry matter and 2.87% gross energy (Afolabi et al., 2018). Health benefit of crayfish including supply of vitamin D and A, also present were mineral elements such as calcium, potassium copper, zinc and iodine (Ibironke et al., 2014).
Egg is an inseparable part of the human diet throughout the world. Nowadays, substantial growth has been reported in using egg fractions in various food products such as cakes, desserts, confectionaries, pies, and powdered soup. The three main components of the whole egg are the shell, the yolk, and the white (Saeed et al., 2023). Egg white, the main component of the whole egg, makes up 58% of it by volume, while egg yolk and eggshell comprise about 31% and 11%, respectively. Egg white mainly consists of water (88%), protein (10.5%), carbohydrate (0.5%), ash (0.8%), and lipids (0.2%). Whole egg contains energy content of 594kj, protein 12.7%, fat 10.1%, cholesterol 375 mg/100g and iron 1.6 mg/100g (Makrides et al., 2012).
Due to the high nutritional value of food items with added functional ingredients, the demand for those types of foods has increased significantly. The presence of food containing protein-energy rich sources in our daily diet may reduce birth defects, cancer, cardiovascular, and neurodegenerative diseases (Kamel et al., 2023). There is therefore the need to produce complementary foods that are of nutritional balanced and caloric-dense to meet the nutritional needs of the infant using locally available and affordable ingredients
MATERIALS AND METHODS
The raw materials used in this study were carrot (Daucus carota), egg white and crayfish (Nematopalaemon hastatus) and were purchased from Ogbete Main Market Enugu North Local Government Area, Enugu State of Nigeria.
Processing of Carrot (Daucus carota)
The method used for vegetable preparation was as described by Tumwine et al. (2018) with slight modification. Carrots roots was sorted, washed with running tap water to remove surface soil, sliced into 1 cm thickness and blended. The blended carrot was filtered using muslin cloth, packaged and stored for use
Preparation of Crayfish Powder
The method used was as described by Aduni et al. (2016) with slight modification. One (1) kg of crayfish was sorted for stones and other unwanted particles and hard bones. The crayfish was washed, drained for 20 min, dried in oven at 50 oC for 6 h and dry-milled into flour, sieved with a 60 mm mesh aperture sieve in order to remove large particles so as to obtain smooth flour which were all stored in polythene bag pending diet formulation.
Preparation of Egg White
The method used was as described by Tiencheu et al. (2016) with slight modification. Whole eggs were washed to remove dirt and then cracked, deshelled and the egg white separated from the egg yolk. The egg yolk was discarded. The egg white was whipped properly, ready for mixing it with the carrot juice and crayfish powder
The protein rich food supplement was produced using mixture design (Simplex Lattice Design) from Design Expert statistical software version 12 (2019). The design key is shown on Table 1. The experiment had a total of fourteen (14) runs. The mixture components, A (egg white), B (crayfish), C (carrot juice) was summed up to 100 was presented in Table 2
Table 1: Key depicting independent variable and their levels
| Components | Unit (g) | Level of the factors | |
| Low | High | ||
| A (egg white) | 20 | 30 | |
| B (crayfish) | 30 | 40 | |
| C (carrot juice) | 30 | 40 | |
Table 2: Design of experiment for composite protein rich food supplement
| Runs | Egg white (g) | Crayfish (g) | Carrot juice (g) |
| 1 | 30 | 40 | 30 |
| 2 | 25 | 35 | 40 |
| 3 | 26.6667 | 36.6667 | 36.6667 |
| 4 | 30 | 40 | 30 |
| 5 | 25 | 35 | 40 |
| 6 | 25 | 40 | 35 |
| 7 | 30 | 30 | 40 |
| 8 | 25 | 40 | 35 |
| 9 | 30 | 35 | 35 |
| 10 | 30 | 35 | 35 |
| 11 | 20 | 40 | 40 |
| 12 | 25 | 40 | 35 |
| 13 | 25 | 35 | 40 |
| 14 | 30 | 35 | 35 |
Foam-Mat Drying of Samples
The method of foam-mat drying was as described by Buljat et al. (2019) with slight modifications. The response variable runs in Table 2 were mixed for 4 min using a kitchen blender where homogenous foam was obtained. After mixing, the foam samples were evenly spread into aluminum trays and put in a conventional oven, left to dry for 3 h at 55 °C. Dried foam samples was milled, sieved using 60 mm sieve and stored in polyethylene bags at 4 °C until analysed.
Laboratory Analysis
Proximate Analysis
The proximate composition such as moisture, fat, fibre ash, protein and carbohydrate were determined using AOAC (2019) method.
Minerals Analysis
The iron, potassium, magnesium and phosphorus were determined using Ezenobi et al. (2016) method; calcium was determined by AOAC (2019) method, while the method of Renee et al. (2006) was used in zinc determination
Statistical Analysis
Analysis of variance (ANOVA) was performed using SPSS software version 20.0.0 (SPSS, 2010). Numerical optimization was performed using Design Expert software V12 ((Design expert, 2019). Multiple response were optimized simultaneously through the use of desirability function that combines all the response into one measurement. The method finds operating conditions (combination of independent variables) that maximize the desirability function. The constraints were set to get the value of a variable for an optimum response (a minimum and maximum level must be provided for each variable included). The optimization of the food supplement process was aimed at finding the levels of egg white, crayfish and carrot juice, which could yield the best product with improved nutritive attributes and desirability when used to fortify pap gruel.
RESULT AND DISCUSSION
Table 3 Proximate Composition of Protein Rich Food Supplement
| Concentration of Components Egg white (g) Crayfish (g) Carrot juice (g) | Moisture (%) | Ash (%) | Fats (%) | Protein (%) | Fiber (%) | Carbohydrate (%) | ||
| 30 | 40 | 30 | 8.15e±0.017 | 19.23b±0.003 | 1.26g±0.005 | 55.63c±0.009 | 1.12c±0.020 | 14.60d±0.026 |
| 25 | 35 | 40 | 10.76a±0.007 | 17.72e±0.003 | 2.42b±0.005 | 48.62f±0.006 | 1.24b±0.116 | 19.25b±0.115 |
| 26.6667 | 36.6667 | 36.6667 | 9.65b±0.004 | 19.43a±0.003 | 1.67d±0.004 | 54.74d±0.007 | 1.13c±0.006 | 13.38e±0.022 |
| 30 | 40 | 30 | 8.15e±0.017 | 19.23b±0.003 | 1.26g±0.005 | 55.63c±0.009 | 1.12c±0.020 | 14.60d±0.026 |
| 25 | 35 | 40 | 10.76a±0.007 | 17.72e±0.003 | 2.42b±0.005 | 48.62f±0.006 | 1.24b±0.116 | 19.25b±0.115 |
| 25 | 40 | 35 | 9.18d±0.008 | 18.16d±0.008 | 1.42f±0.007 | 53.42e±0.005 | 1.09c±0.036 | 16.74c±0.062 |
| 30 | 30 | 40 | 9.22c±0.010 | 15.52g±0.224 | 2.61a±0.004 | 48.16g±0.002 | 1.24b±0.003 | 23.23a±0.237 |
| 25 | 40 | 35 | 9.18d±0.008 | 18.16d±0.008 | 1.42f±0.007 | 53.428±0.005 | 1.07c±0.036 | 16.74c±0.062 |
| 30 | 35 | 35 | 7.96f±0.005 | 18.54c±0.009 | 1.89c±0.002 | 56.93b±0.005 | 1.37a±0.006 | 13.31e±0.017 |
| 30 | 35 | 35 | 7.96f±0.005 | 18.54c±0.009 | 1.89c±0.002 | 56.93b±0.005 | 1.37a±0.006 | 13.31e±0.018 |
| 20 | 40 | 40 | 9.20d±0.032 | 16.66f±0.005 | 1.47e±0.013 | 59.13a±0.004 | 1.41a±0.008 | 12.12f±0.053 |
| 25 | 40 | 35 | 9.18d±0.008 | 18.16d±0.008 | 1.42f±0.007 | 53.42e±0.005 | 1.09c±0.036 | 16.74c±0.062 |
| 25 | 35 | 40 | 10.76a±0.006 | 17.72e±0.003 | 2.42b±0.005 | 48.62f±0.006 | 1.24b±0.012 | 19.25b±0.115 |
| 30 | 35 | 35 | 7.96f±0.005 | 18.54c±0.009 | 1.89c±0.002 | 56.93b±0.005 | 1.37a±0.006 | 13.31e±0.018 |
Data presented are mean ± standard deviation values of triplicate determinations. Mean values in a column, with same superscript letter are significantly similar (P>0.05).
Table 4: Mineral Composition of Protein Rich Food Supplement
| Concentration of Components Egg white (g) Crayfish (g) Carrot juice (g) | Calcium (mg/100g) | Magnesium (mg/100g) | Iron (mg/100g) | Potassium (mg/100g) | Zinc (mg/100g) | Phosphorous (mg/100g) | ||
| 30 | 40 | 30 | 40.66a±0.008 | 252.61c±0.283 | 3.89a±0.005 | 160.27g±0.008 | 2.37g±0.004 | 0.56f±0.003 |
| 25 | 35 | 40 | 29.88d±0.007 | 227.43f±0.011 | 3.22d±0.006 | 175.19c±0.003 | 2.45d±0.004 | 0.58e±0.006 |
| 26.6667 | 36.6667 | 36.6667 | 27.92e±0.003 | 249.62d±0.005 | 3.49c±0.004 | 169.84e±0.009 | 2.39f±0.004 | 0.54g±0.004 |
| 30 | 40 | 30 | 40.66a±0.008 | 252.61c±0.283 | 3.89a±0.005 | 160.27g±0.008 | 2.37g±0.004 | 0.56f±0.003 |
| 25 | 35 | 40 | 29.88d±0.006 | 227.43f±0.0011 | 3.22d±0.006 | 175.19c±0.003 | 2.45d±0.004 | 0.58e±0.006 |
| 25 | 40 | 35 | 20.42g±0.003 | 265.27a±0.004 | 3.77b±0.004 | 160.92f±0.003 | 2.42e±0.003 | 0.62d±0.005 |
| 30 | 30 | 40 | 24.91f±0.004 | 255.83b±0.003 | 3.14e±0.012 | 171.10d±0.020 | 2.56d±0.006 | 0.66c±0.004 |
| 25 | 40 | 35 | 20.42g±0.003 | 265.27a±0.004 | 3.77b±0.004 | 160.92f±0.003 | 2.42e±0.003 | 0.62d±0.005 |
| 30 | 35 | 35 | 36.89b±0.003 | 241.22e±0.006 | 3.90a±0.006 | 177.32b±0.118 | 2.77b±0.005 | 0.72a±0.009 |
| 30 | 35 | 35 | 36.89b±0.003 | 241.22e±0.006 | 3.90a±0.006 | 177.32b±0.118 | 2.77b±0.005 | 0.72a±0.009 |
| 20 | 40 | 40 | 30.76c±0.006 | 226.83g±0.004 | 3.90a±0.004 | 178.57a±0.008 | 2.79a±0.002 | 0.69b±0.004 |
| 25 | 40 | 35 | 20.42g±0.003 | 265.27a±0.004 | 3.77b±0.004 | 160.92f±0.003 | 2.42e±0.003 | 0.62d±0.005 |
| 25 | 35 | 40 | 29.88d±0.007 | 227.43f±0.011 | 3.22d±0.006 | 175.19c±0.003 | 2.45d±0.004 | 0.58e±0.006 |
| 30 | 35 | 35 | 36.89b±0.003 | 241.22e±0.006 | 3.90a±0.006 | 177.32b±0.118 | 2.77b±0.005 | 0.72a±0.009 |
Data presented are mean ± standard deviation values of triplicate determinations. Mean values in a column, with same superscript letter are significantly similar (P>0.05).
Proximate Composition of Protein Rich Food Supplement
Table 3 shows the proximate composition of the food supplement from the mixture of egg white, crayfish and carrot juice.
Moisture
The moisture content of the samples ranged from 7.96 to 10.76%. Samples 2, 5 and 13 had equal mean values (10.76%) and highest moisture content while samples 9, 10 and 14 had the lowest moisture content (7.96%). There were no significant difference (P>0.05) among samples 1, 4 and 13; samples 2, 5 and 13 were similar (P>0.05). Similarly, samples 7, 10 and 14 were not significant different (P>0.05). The moisture content of the samples obtained in this research (7.96 to 10.76%) were in line with 9% reported by Sodamade et al. (2013) in Moringa oleifera leaf protein concentrate. This finding is however slightly higher than 7.3% moisture reported by Bolajoko et al. (2017) in protein isolate from Parkia biglobosa seed; and agreed with 8.3% moisture reported by Ezeokeke and Onuoha (2016) in maize, soybean and banana complementary food. A similar study in groundnut concentrate had 7.15% moisture content which is slightly lower than the findings of this study. It was observed that higher percentage of moisture in samples 2, 5 and 10 could be due to highest concentration of carrot juice in the samples. However, the low moisture content of the samples is advantageous because reduction in moisture content will reduce the proliferation of spoilage organisms especially mold, thus, improving the shelf stability of the product (Ezeokeke and Onuoha, 2016)
From the ANOVA, quadratic model was suggested. Quadratic model for moisture content showed a significant lack of fit (P = 0.03) with Adj-R2 of the 99.6%. The probability of the F value for the quadratic model was significant (P = 0.0001) making moisture content fit into the model. Regression equation for prediction was obtained for moisture content
Moisture = -3.13A+6.67B+17.19C+25.48AB+8.69AC-10.99BC (Eq. 1)
The mathematical model for the moisture content of the protein rich food supplement as presented in equation (1) showed that Y is the moisture content. The coefficient; A, B, C are egg white, crayfish and carrot juice respectively. Any term that has a negative coefficient means antagonistic to the response variables in question. From Eq. (1), egg white (A) has negative coefficient (-3.13), that mean increase in the amount of egg white in the mixture decreases the moisture content while increase in crayfish and carrot juice increased the moisture content of the protein rich food supplement. However, the carrot juice has high coefficient value (17.19) than crayfish (6.67) suggesting that carrot juice incorporation contributes to increase in moisture than the crayfish powder. The contour plot for the models of moisture content of the samples is shown in Fig. 1
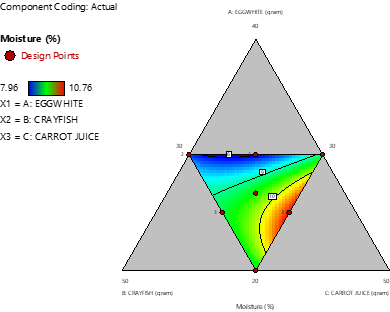
Fig 1: Contour graph for percentage moisture content of protein rich food supplement
From the graph, when the amount of egg white reduces from 29.89 to 26.49g, crayfish and carrot juice powder reduces from 35.32 to 35.15g and increase from 34.79 to 38.35 g respectively, the moisture content increase from 8.02 to 10.01%
Ash
The ash content of the samples ranged from 15.52 to 19.43%. Samples 3 (19.43%) had highest ash content while samples 7 (15.52%) had the lowest ash content. There were no significant difference (P>0.05) among samples 2, 5 and 13; samples 1 and 4 were significantly similar (P>0.05). Samples 9, 10 and 14 were not significant different (P>0.05). Samples 6 and 12 were significantly similar (P>0.05). The results obtained in this study are higher that 4.39% reported by Yellavila et at. (2015) in legume protein concentrate; these values were also higher than 1.13% ash reported by Ocheme et al. (2018) in wheat and groundnut protein concentrate. The variation in ash content could be difference in amount of raw material used. It has been reported by Afolabi et al. (2018) that crayfish is rich in ash with up to 13.86%. Ash in food is useful for judging nutritional characteristics of the food because ash has generally constant element composition because ash is used as an index of mineral content in foods (Omah et al., 2017). All the samples in this study meets the recommended ash content by WHO/FAO (2004) in the complementary food (<5 g/100 g).
From the ANOVA quadratic model was suggested. Quadratic model for ash content showed an insignificant lack of fit (P = 0.74) with Adj-R2 of the 91.4%. The probability of the F value for the quadratic model was significant (P = 0.0001) making ash content fit into the model. Regression equation for prediction was obtained for ash content is presented in Eq. (2)
Ash = 14.52A+9.20B+13.19C+29.31AB+6.32AC+21.52BC (Eq. 2)
The mathematical model for the moisture content of the protein rich food supplement as presented in equation (2) showed that Y is the ash content. The coefficient; A, B, C are egg white, crayfish and carrot juice respectively. From the equation 2 all the responses have positive integer; egg white (A) has coefficient value of 14.52 g, crayfish (B) 9.20 g and carrot juice (C)13.19 g which means that increase in egg white, crayfish and carrot juice in the mixture increases the ash content of the sample. Egg white highest coefficient value followed by carrot juice and lastly crayfish which showed that incorporation of egg white contributed to the high increase in ash content as well as carrot juice and crayfish respectively. The contour plot for the models of ash content of the samples is shown in Fig. 2
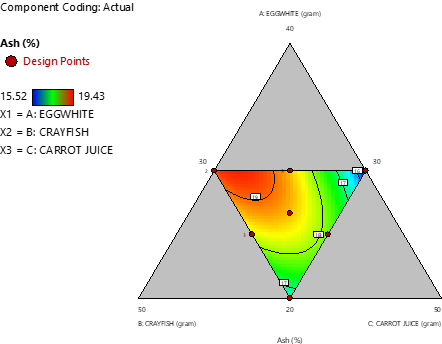
Fig 2: Contour graph for percentage ash content of protein rich food supplement
From the graph, when the amount of egg white increases from 27.89 to 29.99g, crayfish decreases from 38.39 to 30.30g and carrot juice powder increases from 33.72 to 39.72g respectively, the ash content decreases from 19.03 to 15.69%
Fat
The fat content of the samples ranged from 1.26 to 2.61%. Sample 7 (2.61%) had highest fat content while samples 1 (1.26%) had the lowest fat content. There were no significant difference (P>0.05) among samples 6, 8 and 12; samples 2, 5, and 13 were significantly similar (P>0.05). Samples 9, 10 and 14 were not significantly different (P>0.05). However, samples 3 differed significantly (P<0.05) from other samples. The result is lower than 5% fat reported by Obse et al. (2017) in complementary food from blend of maize, roasted pea and malted barley. This study findings were however in line with 1.28% fat reported by Gbadamosi et al. (2017) in wheat, soya beans and carrot flour infant food blend and similar to 1.11% fat in ogi and nutrend complementary foods by Ijaratimi et al. (2012). Fat have been known to impart on the sensory attributes of food products, however, high fat content of food products can predispose the food to rancidity and may therefore, reduce its keeping quality (Omah et al., 2017). For infant with low breast milk intake, complementary foods should provide dietary fats appropriating to 34, 38, and 42% of daily energy requirements for 6–8, 9–11, and 12–23 months, respectively. With adequate breast milk intake, however, the requirement from complementary foods is 0 g/day (0%) at 6–8 months, 3 g/day (5–8%) at 9–11 months, and 9–13 g/day (15–20%) at 12–23 months (Abeshu et al., 2016). In addition, this result is less than the daily recommended fat content in complementary foods which range from 10 to 25% (WHO/ FAO 2004). This could be due to the differences in raw material used and the processing methods employed during the formulation of the samples. From this finding, increasing the carrot juice powder in the mixture significantly increased the fat content of the supplement.
From the ANOVA quadratic model was suggested. Quadratic model for fat content showed insignificant lack of fit (P = 0.65) with Adj-R2 of the 96.43%. The probability of the F value for the quadratic model was significant (P = 0.0001) making fat content fit into the model. Regression equation for prediction was obtained for fat content
Fat = 0.73A-0.75B+4.53C+5.12AB+0.03AC-1.57BC (Eq. 3)
The mathematical model for the fat content of the protein rich food supplement as presented in equation (3) showed that Y is the fat content. The coefficient; A, B, C are egg white, crayfish and carrot juice respectively. Any term that has a negative coefficient means antagonistic to the response variables in question. From Eq. (3), crayfish (B) has negative coefficient (-0.75), meaning that increase in the amount of crayfish in the mixture decreases the fat content while increase in egg white and carrot juice increased the fat content of the protein rich food supplement. It was observed that carrot juice has high coefficient value (4.53) than egg white (0.73) suggesting that carrot juice incorporation contributes to increase in fat than the egg white.
The contour plot for the models of fat content of the samples is shown in Fig. 3
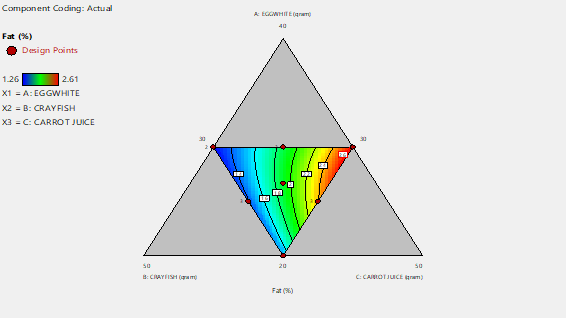
Fig 3: Contour graph for percentage fat content of protein rich food supplement
From the graph, when the amount of egg white increases from 27.59 to 29.49g, crayfish decreases from 39.45 to 30.72g and carrot juice powder increases from 32.96 to 39.79g respectively, the fat content decreases from 1.40 to 2.60%
Protein
The protein content of the samples ranged from 48.16 to 59.13%. Sample 11 (59.13%) had highest protein content while samples 7 (48.16%) had the lowest protein content. There were no significant difference (P>0.05) among samples 2, 5 and 13; samples 1 and 4 were significantly similar (P<0.05). Samples 6, 8 and 12 were not significant different (P>0.05). Samples 9, 10 and 14 were not significantly (P<0.05) different. The increase in crayfish concentration significantly increased the protein content of the food samples. The protein content obtained in this study were in line with 59.4% protein reported by Bolajoko et al. (2017) in in protein isolate from Parkia biglobosa seed; and slightly higher than 47% protein reported by Ibironke and Adepeju (2016) in protein isolate from crayfish and maize. These values were slightly higher than 39.31% protein reported by Sodamade et al. (2013) from Moringa oleifera leaf protein concentrate. Rich proteins in forms of flour, concentrates, and isolates have been incorporated in many food systems for better nutritional values and functionality than products produced solely from one raw material (Jideani, 2011). The required daily allowance for protein contents in the complementary foods is ≥15% (WHO/ FAO 2004).
From the ANOVA table, quadratic model was suggested. Quadratic model for protein content showed insignificant lack of fit (P = 3.90) with Adj-R2 of the 99.4%. The probability of the F value for the quadratic model was significant (P = 0.0001) making protein content fit into the model. Regression equation for prediction was obtained for protein content
Protein = 98.79A+48.77B+25.51C-73.01AB-56.76AC+87.16BC (Eq. 4)
The mathematical model for the protein content of the protein rich food supplement as presented in equation (4) showed that Y is the protein content. The coefficient; A, B, C are egg white, crayfish and carrot juice respectively. From Eq. (4), egg white (A) addition to the mixture had highest impact in protein mean vale with coefficient value of 98.79 followed by crayfish with coefficient value of 48.77. However, incorporation of carrot juice powder to the mixture had lowest protein increase due to its lowest coefficient value of 25.51 compared to other responses.
The contour plot for the models of protein content of the samples is shown in Fig. 4
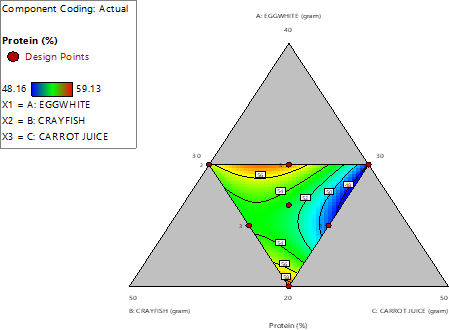
Fig 4: Contour graph for percentage protein content of protein rich food supplement
From Fig. 4 above, it was discovered that when the amount of egg white in the mixture increases from 28.29 to 28.94g crayfish increases from 32.01 to 37.06 and carrot juice decreases from 39.70 to 33.99 g, the protein content of the mixture increases from 48.02 to 56.04%.
Fibre
The fibre content of the samples ranged from 1.07 to 1.41%. Sample 11 had highest fibre (1.41%) content while samples 8 had the lowest fibre content (1.07%). There were no significant difference (P>0.05) among samples 1, 3, 4, 6, 8 and 12; samples 2, 5, 7 and 12 were not significantly different (P>0.05). Samples 9, 10, 11 and 15 were not significant different (P>0.05). The dietary fibre content of this research was lower than 4.33% and 2.11% fibre reported by Bintu et al. (2017) cerelac and Ezeokeke and Onuoha (2016) in maize, soybean and banana complementary food respectively. It was also lower than 5.37% fibre reported by Okpalanma et al. (2022) in maize-soybean complementary foods fortified with crayfish, bonga fish and carrot flours. A similar value too was obtained by Amah et al. (2017) (0.33-6.62%) who worked on Nutrient composition of friso gold wheat, cerelac and ‘tom bran’ Dietary fiber and help to soften and increase the bulk of stools thereby reduce the problem of constipation in children. Fibre is an important dietary component in preventing overweight, constipation, cardiovascular disease, diabetes and colon cancer (Bintu et al., 2017). High dietary fiber content has been reported to impair protein and mineral digestion and absorption in human subjects.. The recommended daily value of fibre is 5%, so this research report on fibre is within the acceptable value (Ijaratimi and Oluwalana, 2013).
From the ANOVA quadratic model was suggested. Quadratic model for fibre content showed a significant lack of fit (P = 0.001) with Adj-R2 of the 99.7%. The probability of the F value for the quadratic model was significant (P = 0.0001) making fibre content fit into the model. Regression equation for prediction was obtained for fibre content
Fibre = 5.28A+2.64B+3.66C-11.36AB-12.91AC-6.96BC+20ABC (Eq. 5)
The mathematical model for the fibre content of the protein rich food supplement as presented in equation (5) showed that Y is the fibre content. The coefficient; A, B, C are egg white, crayfish and carrot juice respectively. From Eq. (5), egg white (A) had highest coefficient value (5.28) indicating its highest contributor to the fibre content of the mixture followed by carrot juice powder with coefficient value of 3.66 and lowest in crayfish with the value of 2.64.
The contour plots for the models of fibre content of the samples are also shown in Fig. 5
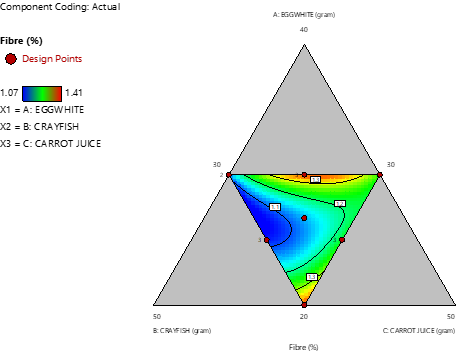
Fig 5: Contour graph for percentage fibre content of protein rich food supplement
From the graph, when the amount of egg white increases from 27.24 to 29.39g, crayfish decreases from 37.85 to 34.22g and carrot juice powder increases from 34.91 to 36.39g, the fibre content increases from 1.11 to 1.31%
Carbohydrate
The carbohydrate content of the samples ranged from 12.12 to 23.23%. Sample 7 had highest carbohydrate content (23.23%) content while samples 11 had the lowest carbohydrate content (12.12%). There were no significant difference (P>0.05) among samples 1 and 4. Samples 2, 5 and 13 were not significantly different (P>0.05). Samples 3, 9, 10 and 14 were not significant different (P>0.05). Similarly, samples 6 and 12 were not significant different (P>0.05). This finding is in line with 8.8% carbohydrate reported by Bolajoko et al. (2017) in protein isolate from Parkia biglobosa seed. However the carbohydrate content of this study was lower than 68.20 obtained by Dooshima et al. (2015) in maize, soybean and peanut fortified with Moringa oleifera leaf powder. It was also slightly higher than that of Ijarotimi et al. (2012) with 64.07% in nutrend. According to Ijaratimi and Oluwalana (2013), the daily recommended value intake for infant is 64%, therefore, all the samples will be capable of meeting up the daily need when taken to fortify cereal based gruel for infant. To improve nutritional quality of complementary foods, studies have advocated for the use of cereal and legumes or other locally available food materials in combinations which help to increase the protein and energy density of complementary foods fed to young children in developing countries. It is recommended that foods fed to infants should be adequate in protein and energy dense, because low energy dense foods tend to reduce total energy intake and other essential nutrients in children. Evidence has shown that high-energy foods are necessary for children to cover their energy needs considering the small size of their stomach (Bolajoko et al., 2017)
From the ANOVA quadratic model was suggested. Quadratic model for carbohydrate content showed a significant lack of fit (P = 7.33) with Adj-R2 of the 91.1%. The probability of the F value for the quadratic model was significant (P = 0.0001) making carbohydrate content fit into the model. Regression equation for prediction was obtained for carbohydrate content
Carbohydrate = -13.88A+35.78B+38.33C+45.09AC-98.67BC (Eq. 6)
The mathematical model for the carbohydrate content of the protein rich food supplement as presented in equation (6) showed that Y is the carbohydrate content. The coefficient; A, B, C are egg white, crayfish and carrot juice respectively. Any term that has a negative coefficient means antagonistic to the response variables in question. From Eq. (6), egg white (A) has negative coefficient (-13.88), that mean increase in the amount of egg white in the mixture decreases the carbohydrate content while increase in crayfish and carrot juice increased the carbohydrate content of the protein rich food supplement. However, the carrot juice has high coefficient value (38.33) than crayfish (35.78) suggesting that carrot juice incorporation contributes to increase in carbohydrate than the crayfish powder.
The contour plot for the models of carbohydrate content of the samples is shown in Fig. 6
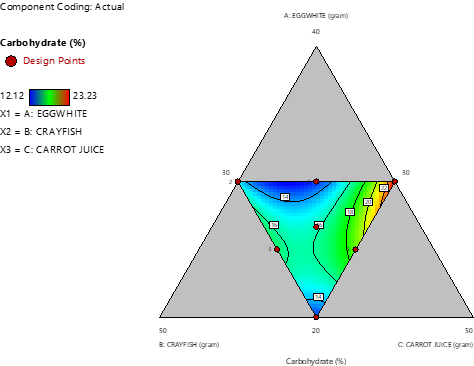
Fig 6: Contour graph for percentage carbohydrate content of protein rich food supplement
From the graph, when the amount of egg white increases from 28.49 to 29.84g, crayfish decreases from 37.49 to 30.59g and carrot juice powder increases from 34.03 to 39.57g, the carbohydrate content increases from 14.04 to 22.02%
Mineral Composition of Protein Rich Food Supplement
The calcium content of the samples ranged from 20.42 to 40.66 mg/100g. Samples 1 and 4 had equal and highest mean value while samples 6, 8 and 12 had equal and lowest mean value. Samples 1 and 4 were not significantly different (P>0.05). Samples 2, 5 and 13 were significantly similar (P>0.05). There were no significant different (P>0.05) among samples 6, 8 and 12; also, samples 9, 10 and 14 were not significantly different (P>0.05). The calcium content of these samples agreed with the findings of Yoon et al. (2018) with calcium range of 39-170 mg/100g in roe concentrates from skipjack tuna; and lower than 419.41 mg/100g reported in cerelac by Okpalanma et al. (2022) in maize-soybean complementary foods fortified with crayfish, bonga fish and carrot flours. The calcium content obtained in this study were also lower when compared with 87.22 mg/100g reported by Gbadamosi et al. (2017) in wheat, soya beans and carrot flour infant food blend. Calcium plays a vital role in the development and sustenance of strong bones and teeth (especially in foetus, infants, children, and the elderly), regulation of muscular contraction and relaxation, regulation of nerve function and absorption of cyanocobalamin (vitamin B12). Calcium may therefore be useful in the prevention of osteoporosis in the elderly (Dias, 2012). It also plays a key role in the coagulation of blood as it activates the process leading to the conversion of prothrombin to thrombin. Calcium is vital component for teeth and strong bone. Calcium value obtained fall below the RDA for calcium which is 400mg (Yoon et al., 2018). It is also below the one obtained by the commercial sold cerelac (419.41 mg/100g). So which means the blends have to be fortified/complement with milk product so as to meet the Childs nutritional needs.
The magnesium content of the samples ranged from 227.43 to 265.27 mg/100g. Samples 6, 8 and 12 had equal and highest mean value while samples 2, 5 and 13 had equal and lowest mean value. There were no significant difference (P>0.05) among samples 2, 5 and 13. Samples 1 and 4 were not significantly different (P>0.05). Samples 6, 7 and 12 were significantly similar (P>0.05). Similarly, samples 9, 10 and 14 were not significantly different (P>0.05). The magnesium content was higher than the value range of 0.00 to 9.84 mg/100g in in maize, soybean and banana complementary food and lower than 677 mg/100g in Sodamade et al. (2013) in Moringa oleifera leaf protein concentrate. They were however higher than 57 mg/100g reported by Yoon et al. (2018) in roe concentrates from skipjack tuna and lower than 119.79 mg/100g reported by Tiencheu et al. (2016) in weaning foods formulated from egg white, fermented maize, pawpaw and beans. The magnesium status of the body is greatly influenced by the health of both the digestive and renal systems. Any disorder of the gastro-intestinal tract that impair absorption processes, such as Crohn’s disease, can limit magnesium absorption by the body leading to depletion in body magnesium stores which could, in extreme cases, lead to chronic magnesium deficiency which may include symptoms like erythemia, hyperaemia, neuromuscular hyper-irritability which increases if the deficiency is unchecked and may be accompanied by cardiac arrhythmia and generalized tremours (Abugre, 2011). The daily recommended value for magnesium is 40 mg. Therefore, fortifying cereal with up to 20g of this protein concentrate could meet up with the daily requirement. Magnesium deficiency can be prevented by consumption of magnesium rich diets as well as supplementation of diets with magnesium if these diets are poor in magnesium content (Tiencheu et al., 2016).
The iron content of the samples ranged from 3.14 to 3.90 mg/100g. Samples 9, 10 and 14 had equal and highest mean value while samples 7 had lowest iron content. Samples 1, 4, 9, 10 and 14 were not significantly different (P>0.05). Samples 2, 5 and 13 were significantly similar (P>0.05). There were no significant different (P>0.05) among samples 6, 8 and 12. The iron mean values in this study were slightly lower than 6.57 mg/100g reported by Okoronkwo et al. (2023) in fonio, soybean and orange-fleshed sweet potato complementary food. The iron values were also lower than 10.12 mg/100g reported by Aderonke et al. (2019) in maize and crayfish complementary food. It was however in line with 1.6 mg/100g in egg by Makrides et al. (2012). The iron content in this research was lower compared with the report of Bintu et al. (2017) that reported iron value of maize based food blend fortified with cowpea Bambara nut to be 7.5 mg/100g. Nevertheless, this study is higher than the findings of Ijarotimi et al. (2012) with iron range of 0.00 to 1.00 mg/100g in popcorn-based (Zea may) complementary foods enriched with cashew nut. The variation in iron content could be due to difference in raw materials used. Iron is involved in strengthening the immune system. Iron is the functional component of haemoglobin and other key compounds used in respiration, immune function and cognitive development. Iron is crucial for cognitive development and transportation of oxygen in the body. The recommended daily allowance of iron intake by infants is between 0.27 and 11 mg. The Fe content in these samples (3.14 to 3.90 mg/100g) could be enough to cover the daily minimum needs if consume in large quantity. All the samples contained acceptable quantities of iron when compared to the recommended daily allowance (Aderonke et al., 2019)
The potassium content of the samples ranged from 160.27 to 178.57 mg/100g. Samples 11 had highest mean value while samples 1 and 4 had equal and lowest mean value while. Samples 1 and 4 were not significantly different (P>0.05). Samples 2, 5 and 13 were significantly similar (P>0.05). There were no significant different (P>0.05) among samples 6, 8 and 12; also, samples 9, 10 and 14 were not significantly different (P>0.05). These values were higher than 116.21 mg/100g and lower than 700 mg/100g reported by Ijaratimi et al. (2012) in ogi and nutrend complementary foods and Gbadamosi et al. (2017) in complementary foods. It was also lower than 635 mg/100g reported by Bintu et al. (2017) in maize based food blend fortified with cowpea and Bambara nut. Potassium is the major cation in intracellular fluid and functions in the maintenance of weight, regulation of acid-base balance, conduction of nerve impulse, muscular contraction (especially of the cardiac muscle), correct functioning of the cell membrane, regulation of the sodium-potassium adenosine triphosphatase (ATPase) system and the maintenance of fluid volume (Agbaire, 2011). It also plays a vital role in the transfer of phosphate from adenosine triphosphate to pyruvic acid. The metabolism of potassium is regulated by the hormone, aldosterone. The estimated values for potassium intake are set at 400 mg/day for breastfed infants aged 0 to under 4 months, 600 mg/day for infants aged 4 to under 12 months, 1,100–4,000 mg/day for children and adolescents, 4,000 mg/day for adults and pregnant women and 4,400 mg/day for lactating women (WHO, 2012). The range of potassium content reported in this study shows that the vegetables may be a poor source, capable of providing about 14 to 16% of RDA for healthy living.
The zinc content of the samples ranged from 2.37 to 2.79 mg/100g. Sample 11 had the highest mean value (2.79%) while samples 1 and 4 had equal and lowest mean value. There were no significant difference (P>0.05) among samples 2, 5, 7 and 13. Samples 1 and 4 were not significantly different (P>0.05). Samples 6, 8 and 12 were not significantly different (P>0.05). There were no significant different (P>0.05) among samples 9, 10 and 14. The zinc content of these samples were in line with 2.74 mg/100g reported by Ezeokeke and Onuoha (2016) in maize, soybean and banana complementary food; and also agreed with 1.44 mg/100g in infant food by Ajala et al. (2020) in infant complementary food. These values were also lower than 3.4 mg/100g reported Kamel et al. (2023) in carrot. Zinc supports healthy immune system, helps in wound healing, synthesis of DNA and maintenance of sense of taste. It also helps in normal growth and development during pregnancy, childhood, and adolescence. It is essential for growth and sexual development in man (Kawade, 2012) and important in cell proliferation and protein synthesis. The RDA of zinc for infant 4-6 months (6.5mg/100g), 7-9 months (7.0mg/100g), 10-12 months (7-9mg/100g) and children, 1–3 years is 3.0 mg/day (Kawade, 2012; Ajala et al., 2020).
The phosphorus content of the samples ranged from 0.54 to 0.72 mg/100g. Samples 9, 10 and 14 had equal and highest mean value while sample 3 had the lowest mean value. Samples 1 and 4 were not significantly different (P>0.05). Samples 2, 5 and 13 were significantly similar (P>0.05). There were no significant different (P>0.05) among samples 6, 8 and 12; also, samples 9, 10 and 14 were not significantly different (P>0.05).The values of phosphorus obtained in this research was lower than the report of Ijaratimi et al. (2012) that had value range of 22.00-274.58 mg/100g in different infant formula and slightly higher than 0.18 mg/100g reported by Nyahabeh et al. (2020) in maize pap. The phosphorus content of these samples were however lower than 70 mg/100g reported by Joel et al (2019) in guinea corn, groundnuts, soya beans, tiger nuts, and date nut complementary food. The variation in phosphorus could be different in raw materials used. Phosphorus is concerned with many metabolic processes including those involving body fluid buffers, maintenance of normal kidney function as well as in the transfer of nerve impulses (Udo et al., 2013). Just like calcium, phosphorus also plays a key role in strengthening bones and teeth and in the maintenance of muscle growth (Udo et al., 2013). According to Vunchi et al., (2011), for good calcium absorption to occur, calcium-phosphorus ratio must be 1:1. The average calcium-phosphorus ratio for the leaves of all seven vegetables analyzed in this study indicates that diets containing these vegetables may need to be supplemented with other phosphorus sources. This is backed up by the fact that RDA requirement for phosphorus in both adult males and non-pregnant females is 700mg/day (Vunchi et al., 2011). The phosphorus daily recommended intake for ages between 0–6 and 7–12 months is estimated 100 and 275 mg, respectively. While in adults, an adequate intake of phosphorus is 700–1300 mg on daily basis (Gonzalez-Parra et al., 2012).
Model Fitting for Response Variables
Proximate Composition
The ANOVA values for model fitting of proximate composition are shown in Table 5.
Table 5 ANOVA Values Mixture Design Quadratic Models for Proximate composition
| Proximate composition | Std. Dev | Mean | C.V (%) | Press | R2 | Adj. R2 | Predic R2 | Adeq Prec. | P. Value | P –Lack of Fit | Significant Model |
| Moisture | 0.06 | 9.15 | 0.71 | 6.68 | 0.996 | 0.997 | 0.22 | 66.30 | 0.0001 (Significant) | 0.03 (Significant) | Quadratic |
| Ash | 0.30 | 18.09 | 1.68 | 149 | 0.95 | 0.91 | -9.59 | 18.80 | 0.0001 (Significant) | 0.74 Insignificant | Quadratic |
| Fat | 0.09 | 1.82 | 4.97 | 13.11 | 0.98 | 0.96 | -3.41 | 23.03 | 0.0001 (Significant) | 0.065 Insignificant | Quadratic |
| Protein | 0.69 | 53.59 | 1.30 | 782.39 | 0.98 | 0.96 | -3.41 | 23.99 | 0.0001(Significant) | 3.90 Insignificant | Quadratic |
| Fibre | 0.006 | 1.22 | 0.51 | NA | 0.99 | 0.99 | NA | 74.85 | 0.0001(Significant) | 0.001 Significant | Quadratic |
| Carbohydrate | 0.95 | 16.13 | 5.90 | 1451.21 | 0.95 | 0.91 | -9.92 | 17.85 | 0.0001(Significant) | 7.33Insignificant | Quadratic |
Model is adequate when p<0.05, lack of fit (p>0.05), Adjusted R2 (>60%)
Model Fitting for Mineral Composition of the Supplement
The ANOVA values for model fitting of Mineral composition are shown in Table 6
Table 6 ANOVA Values Mixture Design Quadratic Models for Mineral composition
| Minerals | Std. Dev | Mean | C.V (%) | Press | R2 | Adj. R2 | Predic R2 | Adeq Prec. | P. Value | P –Lack of Fit | Significant Model |
| Calcium | 0.04 | 30.46 | 0.13 | 2.67 | 1.0 | 1.0 | 0.996 | 759.30 | 0.0001(Significant) | 0.0133 (Significant) | Quadratic |
| Magnesium | 1.64 | 245.66 | 0.67 | 4297.43 | 0.99 | 0.99 | -0.55 | 36.89 | 0.0001 (Significant) | 21.42 Insignificant | Quadratic |
| Iron | 0.043 | 3.64 | 1.19 | 3.00 | 0.98 | 0.98 | -1.40 | 26.85 | 0.0001 (Significant) | 0.015 Significant | Quadratic |
| Potassium | 0.54 | 170.02 | 0.32 | 467 | 0.99 | 0.75 | 0.38 | 52.03 | 0.0001(Significant) | 2.33 Insignificant | Quadratic |
| Zinc | 0.05 | 2.53 | 1.86 | 3.57 | 0.95 | 0.92 | -8.70 | 13.83 | 0.0001(Significant) | 0.02 Significant | Quadratic |
| Phosphorus | 0.03 | 0.63 | 5.15 | 1.67 | 0.85 | 0.75 | -29.73 | 6.78 | 0.0041(Significant) | 0.008 Significant | Quadratic |
Model is adequate when p<0.05, lack of fit (p>0.05), Adjusted R2 (>60%)
Calcium
The ANOVA table for mineral composition of the samples showed that quadratic model was suggested. Quadratic model for calcium content showed a significant lack of fit (P = 0.0133) with Adj-R2 of the 100%. The probability of the F value for the quadratic model was significant (P = 0.0001) making calcium content fit into the model. Regression equation for prediction was obtained for calcium content
Calcium = 104.32A-39.14B+68.03C+32.29AB-245.03AC+65.29BC (Eq. 7)
The mathematical model for the calcium content of the protein rich food supplement as presented in equation (7) showed that Y is the calcium content. The coefficient; A, B, C are egg white, crayfish and carrot juice respectively. From Eq. (7), crayfish (B) has negative coefficient (-39.14) indicating that increase in concentration of crayfish in the mixture significantly reduces the calcium content. Although, the addition of egg white and carrot juice significantly increased the calcium content; however, egg white has higher impact on increase in calcium content than carrot juice due to their coefficient values of 104.32 and 68.03 respectively. The contour plots for the models of calcium content of the samples are also shown in Fig. 11
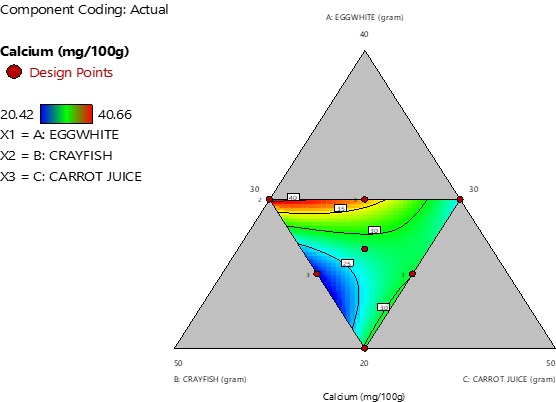
Fig 11: Contour graph for mg/100g calcium content of protein rich food supplement
From the graph, when the amount of egg white increases from 25.39 to 29.94g, crayfish increases from 38.12 to 38.27g and carrot juice powder decreases from 36.48 to 31.79g, the calcium content increases from 25.01 to 29.94%
Magnesium
From the ANOVA, quadratic model was suggested. Quadratic model for magnesium content showed insignificant lack of fit (P = 21.42) with Adj-R2 of the 99%. The probability of the F value for the quadratic model was significant (P = 0.0001) making magnesium content fit into the model. Regression equation for prediction was obtained for magnesium content
Magnesium = 178.45A+428.85B+120.15C-205.08AB+424.27AC-192.53BC (Eq. 8)
The mathematical model for the magnesium content of the protein rich food supplement as presented in equation (8) showed that Y is the magnesium content. The coefficient; A, B, C are egg white, crayfish and carrot juice respectively. Egg white (A) has coefficient of estimation value of 178.48, crayfish had 428.85 while carrot juice had 120.15. From the coefficient of estimation values crayfish has highest contributing factor to the increase in magnesium content of the mixture followed by egg white and lastly carrot juice. However, addition of these complementary food ingredients significantly increases the magnesium content of the samples.
The contour plot for the models of magnesium content of the samples is shown in Fig. 12
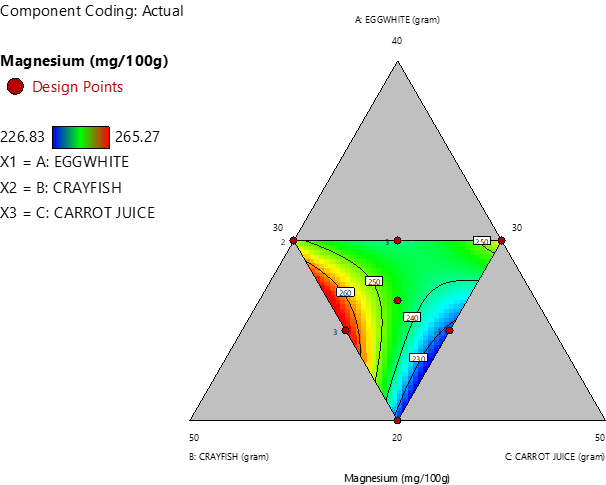
Fig 12: Contour graph for mg/100g magnesium content of protein rich food supplement
From the graph, when the amount of egg white increases from 23.69 to 27.54g, crayfish increases from 36.89 to 39.17g and carrot juice powder decreases from 39.40 to 33.29g, the magnesium content increases from 230.01 to 260.00%
Iron
From the ANOVA quadratic model was suggested. Quadratic model for iron content showed a significant lack of fit (P = 0.015) with Adj-R2 of the 98%. The probability of the F value for the quadratic model was significant (P = 0.0001) making iron content fit into the model. Regression equation for prediction was obtained for iron content
Iron = 6.49A+3.93B+1.02C-5.26AB-2.41AC+5.75BC (Eq. 9)
The mathematical model for the iron content of the protein rich food supplement as presented in equation (9) showed that Y is the iron content. The coefficient; A, B, C are egg white, crayfish and carrot juice respectively. From Eq. (9), all the responses have positive impact to the iron content of the samples. Response with higher coefficient of estimation is said to possess higher impact in increase in iron content. Hence, egg white with coefficient of estimation of 6.49 is the highest contributor to the increase in iron content, followed by crayfish (3.93) and then, carrot juice powder (1.02). The contour plot for the models of iron content of the samples is shown in Fig. 13
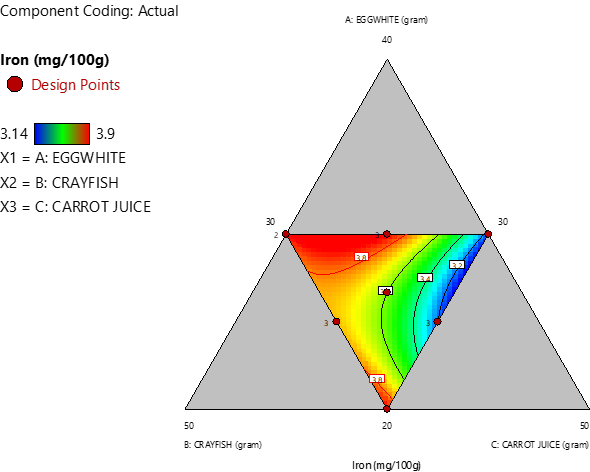
Fig 13: Contour graph for mg/100g iron content of protein rich food supplement
From the graph, when the amount of egg white increases from 28.19 to 28.44g, crayfish increases from 32.36 to 37.21g and carrot juice powder decreases from 39.45 to 34.36g, the iron content increases from 3.20 to 3.81%
Potassium
From the ANOVA quadratic model was suggested. Quadratic model for potassium content showed a insignificant lack of fit (P = 2.33) with Adj-R2 of the 99%. The probability of the F value for the quadratic model was significant (P = 0.0001) making potassium content fit into the model. Regression equation for prediction was obtained for potassium content
Potassium = 233.42A+87.28B+179.63C-141.10+181.06BC (Eq. 10)
The mathematical model for the potassium content of the protein rich food supplement as presented in equation (10) showed that Y is the potassium content. The coefficient; A, B, C are egg white, crayfish and carrot juice respectively. The equation shows that all the responses have positive impact to potassium increase. It is observed that egg white with coefficient of estimation value of 233.42 has highest positive increase in potassium mean value when added to the mixture when compared with carrot juice powder and crayfish with 179.63 and 87.28 coefficient of estimation respectively. However, interaction of egg white with crayfish is insignificant (P>0.05) and its equation was omitted.
The contour plot for the models of potassium content of the samples is shown in Fig. 14
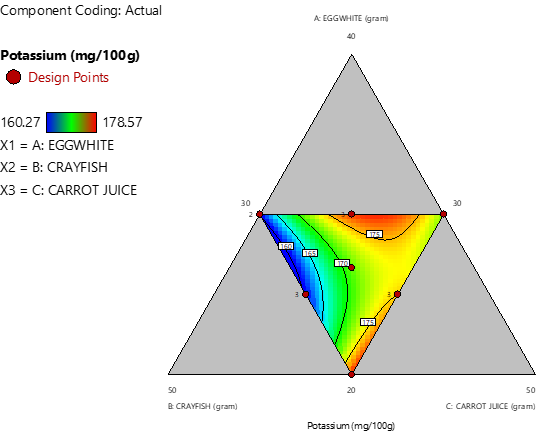
Fig 14: Contour graph for mg/100g potassium content of protein rich food supplement
From the graph, when the amount of egg white increases from 28.34 to 28.44g, crayfish decreases from 39.72 to 34.01g and carrot juice powder increases from 31.94 to 37.55g, the potassium content increases from 160.02 to 175.04%
Zinc
From the ANOVA quadratic model was suggested. Quadratic model for zinc content showed a significant lack of fit (P = 0.018) with Adj-R2 of the 92%. The probability of the F value for the quadratic model was significant (P = 0.0001) making zinc content fit into the model. Regression equation for prediction was obtained for zinc content
Zinc = 5.03A+1.77B+1.62C-4.10AB-3.01AC+4.43BC (Eq. 11)
The mathematical model for the zinc content of the protein rich food supplement as presented in equation (11) showed that Y is the zinc content. The coefficient; A, B, C are egg white, crayfish and carrot juice respectively. From Eq. (11), egg white (A) has highest coefficient of estimation (5.03) and suggested to play highest role in zinc content increase in the mixture. The equation also showed that the coefficient of estimation for crayfish and carrot juice power are 1.77 and 1.62 respectively indicating the ability of crayfish to contribute to the zinc content increase more than carrot juice powder.
The contour plot for the models of zinc content of the samples is shown in Fig. 15
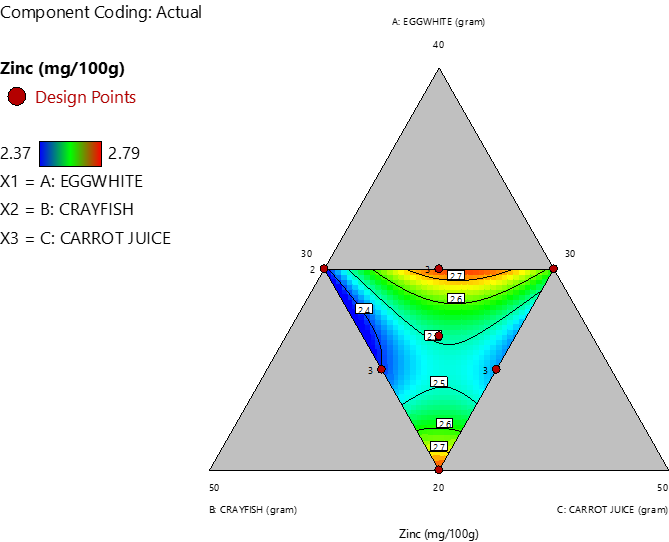
Fig 15: Contour graph for mg/100g zinc content of protein rich food supplement
From the graph, when the amount of egg white increases from 27.84 to 29.49g, crayfish decreases from 39.36 to 34.52g and carrot juice powder increases from 32.79 to 35.99g, the zinc content increases from 2.40 to 2.71%. Increase in egg white, decrease in crayfish and increase in carrot juice increased the zinc content of the supplement
Phosphorus
From the ANOVA, quadratic model was suggested. Quadratic model for phosphorus content showed a significant lack of fit (P = 0.083) with Adj-R2 of the 75.10%. The probability of the F value for the quadratic model was significant (P = 0.0041) making phosphorus content fit into the model. Regression equation for prediction was obtained for phosphorus content
Phosphorus = 1.46A+0.597B+0.07C-1.86AB-0.38AC+1.46BC (Eq. 12)
The mathematical model for the phosphorus content of the protein rich food supplement as presented in equation (12) showed that Y is the phosphorus content. The coefficient; A, B, C are egg white, crayfish and carrot juice respectively. It was observed that egg white had highest coefficient of estimation (1.46) and being the highest contributor to phosphorus increase. Crayfish also had better phosphorus increase than carrot juice with coefficient of estimation values of 0.59 and 0.07 respectively. However, all the responses have positive impact on increase in phosphorus content of the mixtures
The contour plot for the models of phosphorus content of the samples is shown in Fig. 16
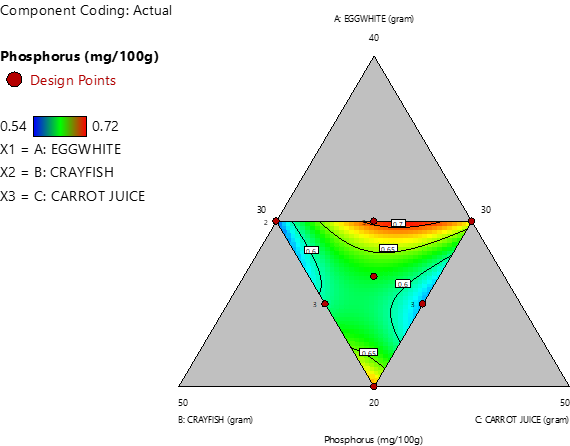
Fig 16: Contour graph for mg/100g phosphorus content of protein rich food supplement
From the graph, when the amount of egg white increases from 28.14 to 29.74g, crayfish decreases from 39.13 to 34.14g and carrot juice powder increases from 32.73 to 36.13g, the phosphorus content increases from 0.60 to 0.70%
Optimization of the Mixture of the Ingredients
Optimization was based on significant regression models (P <0.05), high Adj-R2 values ( P ≥ 0.70) of the parameters (ash, protein, carbohydrate, calcium, iron and phosphorus) regardless of significant lack of fit (P< 0.05) values for ash, protein, carbohydrate, calcium, iron and phosphorus (Table 7). Though Anand et al. (2017) reported that if a model has a significant lack of fit (P<0.05), it is not a good indicator of the response and should not be used for prediction. However, Elsabet and Ramesh (2022) pointed out that when a large amount of data was obtained in analysis, a model with significant lack of fit can still be used, since high Adj. R2 and significant p-values were considered as evidence of applicability of the regression models. Also, Goos (2012) stated that statistically significant lack of fit might have little impact on the interpretation of data and can be effectively ignored.
Optimization procedure was conducted by maximizing ash, protein, calcium, iron and phosphorus, while carbohydrate was put in range. All other nutritional parameters were not used for optimization because they are not very essential in infant nutrition.
Results of numerical optimization in Table 8 revealed that 30% egg white, 35.969% crayfish and 34.031% carrot juice powder produced food protein rich supplement with ash content of 18.968%, protein 57.723%, carbohydrate 12.333%, calcium 38.247 mg/100g, iron 3.942 mg/100g and phosphorus 0.694 mg/100g. This mixture of 30% egg white, 35.969% crayfish and 34.031% carrot juice powder had a desirability function of 0.93. A similar desirability value (0.91) was reported by Elsabet and Ramesh (2022) for overall optimization of complementary food made with oat (40 g), chickpea (25.81 g), yellow maize (13.78 g), avocado powder (10.4 g), and Jaggery (10 g). All the mixture response variables were located within the range of experimental values of the independent variables; hence the fitted response equations were adequate for depicting response near stationary point. The contour plot generated as a result of optimization is shown in Figure 17
Table 7: Description of Fitted Model for Optimized Parameters
| Parameter | Adj-R2 | Probability of the F value for the Quadratic model | Lack of fit |
| Ash | 0.91 (91%) | 0.0001 | 0.7433 |
| Protein | 0.96 (96%) | 0.0001 | 3.90 |
| Carbohydrate | 0.91 (91%) | 0.0001 | 7.23 |
| Calcium | 1.00 (100%) | 0.0001 | 0.0113 |
| Iron | 0.98 (98%) | 0.0001 | 0.0150 |
| Phosphorus | 0.75 (75%) | 0.0041 | 0.0083 |
Values based P < 0.05, for model, P > 0.05 or lack of fit and Adj- R2 ≥ 0.7 (70%)
Table 8: Optimum Values of Ingredient combination for Production of Food Protein Concentrate
| Number | Egg white (g) | Crayfish (g) | Carrot juice (g) | Ash (%) | Protein (%) | Carbohydrate (%) | Calcium (mg/100g) | Iron (mg/100g) | Phosphorus (mg/100g) | Desirability |
| 1 | 30.000 | 35.969 | 34.031 | 18.968 | 57.723 | 12.333 | 38.247 | 3.942 | 0.694 | 0.929 |
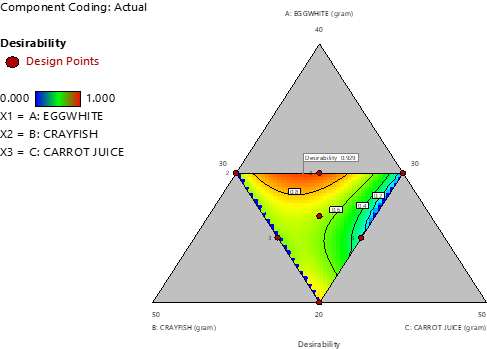
Fig. 17: Optimization graph
CONCLUSION
This study has shown that protein rich supplement for complementary food fortification can be produced from combination of egg white, crayfish and carrot juice powder. All the different formulations of the egg white, crayfish and carrot juice powder possessed high nutritional composition including proximate composition and mineral content. However, after optimization of the mixture, it was discovered that combination of 30 g of egg white, 35.969 g crayfish and 34.031 g carrot juice powder possessed the best nutrients of interest for child health in terms of protein, ash, carbohydrate, calcium, iron and phosphorus with 92.9% desirability. Therefore, the protein concentrate from egg white, crayfish and carrot juice powder can be considered a good source of protein and other vital nutrients which could be developed as a complementary food to combat protein-energy malnutrition among infants
RECOMMENDATION
From the research carried out, the following recommendations were made;
It is however important to stress that egg, crayfish and carrot juice powder concentrates is not food on their own but contains nutritional potential that could find application in food ingredient, infant formula, protein rich food supplement and food formulation
It is important to use the ratio of 30:35.969:34.031 for egg white, crayfish and carrot juice powder respectively for optimum nutritional composition.
The protein rich food supplement produced can be recommended for fortification of any cereal gruel intended for infant food.
Further research in the microbial study and protein digestibility of these products is encouraged.
ACKNOWLEDGEMENT
We would like to offer our gratitude to Prof. C. N Ischium, Prof. H. O. Agu, Mrs. Mofunanya Grace Nneka and all other UNIZIK Food Science and Technology lecturers for their technical support.
REFERENCES
- Abeshu, M. A., Lelisa, A. and Geleta, B. (2016). Complementary feeding: Review of recommendations, feeding practices, and adequacy of homemade complementary food preparations in developing countries – lessons from Ethiopia. Frontier Nutrition 3 (41): 1-9
- Abugre, C. (2011). Assessment of some traditional leafy vegetables of upper east region and influence of stage of harvest and drying method on nutrients content of spider flower (Cleome gynandra L.). Kwame Nkrumah University of Science and Technology. Pp. 100-105
- Aduni, U., Achidi, B.T., Noel, T., Hilaire, M.W. , Marcel, N.M., Lucy, T.E. and Fossi, T. (2016). Quality Evaluation of Nine Instant Weaning Foods Formulated from Cereal, Legume, Tuber, Vegetable and Crayfish, International Journal of Food Science and Nutrition Engineering 6 (2): 21-31.
- Afolabi, S. H., Okache, T. A., Eke, M. O. and Alakali, J. S. (2018). Physico-chemical properties and sensory attributes of butter produced from peanut, crayfish and ginger. International Journal of Food Science and Biotechnology 3 (1): 21-32
- Agbaire, P. O. (2011). Nutritional and Anti-nutritional Levels of Some Local Vegetables (Vernonia amygdalina, Manihot esculenta, Teiferia occidentalis, Talinum triangulare and Amaranthus spinosus) from Delta State, Nigeria. Journal of Applied Science and Environmental Management, 15 (4): 625-628.
- Amah, G. H., Adeyemi, M. M., Akamo, A. J., Oyinloye, B. E., Aja, J. and Osilesi, O. (2017). Comparative proximate and mineral nutrients compositions of friso gold wheat®, cerelac® and ‘tom bran’ as complementary foods. Journal of Biotechnology and Biochemistry 3(5): 61-68
- Anand, J. K., Ganesh, K. M. and Ajith, A. B. (2017). Introduction to optimization. Springer International Publishing, 1st Edition, Switzerland. Pp. 3-5
- AOAC. (2019). Official Methods of Analysis (14th Ed.). Association of Official Analytical Chemists, Will behington, DC.
- Barber, L. I., Obinna-Echem, P. C. and Ogburia, E. M. (2017). Proximate composition micronutrient and sensory properties of complementary food formulated from fermented maize, soybeans and carrot flours. Sky Journal of Food Science 6(3): 033 – 039
- Bintu, B. P., Hauwa, H., Falmata, A. S., Modu, S., Aliyu, D. and Maryam, B. K. (2017). Studies on the nutritive value, antinutritional factors and in vitro protein digestibility of maize based food blend fortified with cowpea bambaranut”. Ecronicon Nutrition 10(5): 199-213.
- Bolajoko, I. O., Babatunji, E. O., Foluso, O. O., Abidemi, P. K. and Opoku, A. R. (2017). Comparative study on proximate, functional, mineral, and antinutrient composition of fermented, defatted, and protein isolate of Parkia biglobosa seed. Food Science & Nutrition 2017; 5(1): 139–147
- Buljat, A. M., Tamara, J., Tusek, A. J., Valinger, D., Kljusuric, J. G. and Benkovic, M (2019). Applicability of foam mat drying process for production of instant cocoa powder enriched with lavender extracts. Food Technology and Biotechnology 57(2): 159–170.
- Design expert, (2019). Design expert version 12. Stat – Ease Inc, 1300Godward Street, Northeast suit 640 Minneapolis, MN 55413.
- Dias, J. S. (2012). Nutritional quality and health benefits of vegetables: a review. Food and Nutrition Sciences, 3(10): 1354-1374.
- Elsabet, G. A. and Ramesh, D. (2022). Formulation and optimization of complementary food based on its nutritional and antinutritional analysis. Hindawi International Journal of Food Science 3(1): 1-7
- Ezenobi, U. V., Amaku, F. J. and Agbidi, C. (2016). Ricinus communis Seeds (Ogiri-Okpei) And Its Phytochemical Composition. Global Journal of Engineering Science and Researches, 3 (7): 6-13
- Ezeokeke, C. T. and Onuoha, A. B. (2016). Nutrient composition of cereal (maize), legume (soybean) and fruit (banana) as a complementary food for older infants and their sensory assessment. Journal of Food Science and Engineering 6 (1): 139-148
- Gbadamosi, T. R., Otitoola, O. C., Akanfe, F. A. Asimi, T., Bamisaye, F. D. and Isola, O. E. (2017). Chemical analysis of the nutritional composition of formulated complementary foods. International Conference of Science, Engineering & Environmental Technology 2(18): 141-147
- Gonzalez-Parra, E., Gracia-Iguacel, C. and EgidoJ, O. A. (2012). Phosphorus and nutrition in chronic kidney disease. International Journal of Nephrology 10(1): 1-5.
- Goos, P. (2012). Testing for lack of fit in block and split-plot response surface designs. In optimal design of blocked and split plot experiment; Springer Belgium. Pp. 100-103
- Ibironke, S. I., Fashakin, J. B. and Ige, M. M. (2014). Nutritional quality of animal polypeptide (crayfish) formulated into complementary foods. American Journal of Food and Nutrition, 2 (3): 39-42
- Ijaratomi, O. S. and Ayantokun, O. A. (2006). Nutritional composition, sensory and biological evaluation of a potential weaning diet from low cost materials (sorghum bicolor and cajanuscajan). Journal of Food Technology 4 (3): 178-184.
- Ikunjenlola, A. V. (2014). Chemical and functional properties of complementary food blends from malted and unmalted acha (Digitaria exilis), soy bean (Glycine max) and defatted sesame (Sesamun indicum L) flours. African Journal of Food Science 8(7): 361-367
- Javed, I. M., Abbas, A., Rafique, H., Furqan, N. M. and Ammadm, R. (2018). A review paper on foam-mat drying of fruits and vegetables to develop powders. Journal of Food Process Technology 6(6): 465‒467
- Joel, E. B., Mafulul, S. G., Kutshik, R. J., Tijjani, H., Gonap, B. J., Auta, B. L., Welye, H. and Ekundayo, A. A. (2019). Nutrient composition of a low-cost infant’s diet formulated from five locally available foodstuffs in northern Nigeria. Int. J. Biol. Chem. Sci. 13(3): 1411-1419
- Kawade, R. (2012). Zinc status and its association with the health of adolescents: a review of studies in India. Global Health Action, 5(3): 34-39.
- Maja, B., Maja, P., Ana, J. T., Tamara, J., Jasenka, G. K. and Davor, V. (2019). Optimization of the foam mat drying process for production of cocoa powder enriched with peppermint extract. Learning with Technologies Food Science and Technology 113(1): 1-5
- Makrides, M., Hawkes, J. S., Neumann, M. A. and Gibson, R. A. (2012). Nutritional effect of including egg yolk in the weaning diet of breast-fed and formula-fed infants: a randomized controlled trial. American Journal of Clinical Nutrition 75 (1): 1084–1092.
- Masresha, G. E., Alemneh, Y. A. and Wondemagegn, F. (2023). Nutritional enhancement of bread produced from wheat, banana, and carrot composite flour. Journal of Food Quality 1(1): 1- 7
- Mogor, E. O., Ishiwu, C. N., Nduka, C. O. and Anene, N. M. (2023). Proximate composition of foam mat-dried tomato powder as affected by process variables: A review. Pakistan Journal of Nutrition, 22: 59-80.
- Nyahabeh, M. A., Wasiu, A. A., Williams, M. S. E., Mayiza-Dixon, B. and Babatunde, O. E. (2020). Appraisal and composition of some traditional complementary foods for infant nutrition in Sierra Leone. International Journal of the Science of Food and Agriculture 4(1): 73-79
- Obse, F., Geremew, B., Sirawdink, F. F. and Mathewos, T. (2017). Nutritional quality and sensory acceptability of complementary food blended from maize (Zea mays), roasted pea (Pisum sativum), and malted barley (Hordium vulgare). Food Science & Nutrition 5(2):173–181
- Ocheme, O. B., Adedeji, O. E., Chinma, C. E., Yakubu, C. M. and Ajibo U. H. (2018). Proximate composition, functional, and pasting properties of wheat and groundnut protein concentrate flour blends. Food Science and Nutrition, 6(1), 1173– 1178
- Ocloo, F. C. K., Bansa, D. Boatin, R., Adom, T., Agbemavor, W. S. (2010). Physico-chemical, functional and pasting characteristics of flour produced from Jackfruits (Artocarpus heterophyllus) seeds. Agriculture And Biology Journal Of North America 1(5): 903-908
- Okoronkwo, N. C., Okoyeuzu, C. F., Eze, C. R., Mbaeyi-Nwaoha, I. E. and Agbata, C. P. (2023). Quality evaluation of complementary food produced by solid-state fermentation of fonio, soybean and orange-fleshed sweet potato blends. fermentation 9 (250): 1-20
- Okpalanma, E. F., Ukpong, E. S., Chude, O. C. and Abah, C. R. (2022). Production of maize-soybean complementary foods fortified with crayfish, bonga fish and carrot flours rich in essential nutrients. African Journal of Food Science 16 (12): 319-325
- Omah, E. C., Umego, E. C., Onah, P. C. and Onu, D. A. (2017). Evaluation of complementary foods from blends of roasted rice and soybean flours. Innovare Journal of Food Sciences 5 (4): 21-24
- Renee, S., Jirina, S., Ondrej, D. and Lenka, M. (2006). The status of micronutrients (Cu, Fe, Mn, Zn) in tea and tea infusions in selected samples imported to the Czech Republic. Czech Journal of Food Science 24 (2):62-71
- Saeed, M. R., Hoda, F., Sepideh, A. and Ali, R. (2023). An overview of the functional properties of egg white proteins and their application in the food industry. Food Hydrocolloids 135 (1): 5-10
- Sodamade, A., Bolaji, O. S. and Adeboye, O. O. (2013). Proximate analysis, mineral contents and functional properties of Moringa oleifera leaf protein concentrate. Journal of Applied Chemistry 4 (6): 47-51
- SPSS, (2010). SPSS statistics for windows, release 17.0.0. Statistical Package for Social Sciences (SPSS). Inc; USA
- Tiencheu, B. A. A. U., Tenyang, N., Tatsinkou, F. B., Moyeh, N. M., Womeni, H. M. (2016). Nutritive value, functional and sensory attributes of weaning foods formulated from egg white, fermented maize, pawpaw and beans. American Journal of Food Science and Nutrition Research 3 (3): 22-30.
- Tiencheu, B., Achidi, A. U., Tenyang, N., Tatsinkou, F. B., Moyeh, N. M., Womeni, H. M. (2016). Nutritive value, functional and sensory attributes of weaning foods formulated from egg white, fermented maize, pawpaw and beans. American Journal of Food Science and Nutrition Research 3 (3): 22-30.
- Tumwine, G., Atukwill bee, A., Tumuhimbise, G. A., Tucungwiirwe, F. and Linnemann, A. (2018). Production of nutrient-enhanced millet-based composite flour using skimmed milk powder and vegetables. Food Science and Nutrition 3 (1): 1–13.
- Udo, S. E., Obi-Abang, M., Okoi, A. I. and Akwaji, P. (2013). Nutrition and anti nutrition components of two popular lesser known vegetables in farming communities of Cross River State, Nigeria. International Journal of Applied and Natural Sciences 2 (5): 85-90.
- Vunchi, M. A., Umar, A. N., King, M. A., Liman, A. A., Jeremiah, G. and Aigbe, C. O. (2011). Proximate, vitamin and mineral composition of Vitex doniana (black plum) fruit Pulp. Nigerian Journal of Basic and Applied Science 19 (1): 97-101.
- WHO, (2012). Guideline: Potassium intake for adults and children. WHO Document Production Services, Geneva, Switzerland p. 34
- WHO/ FAO. 2004. Human vitamin and mineral requirements. Report of a joint FAO/WHO consultation, Bangkok, Thailand. Rome: Food and Agriculture Organization of the United Nations (FAO) and World Health Organization (WHO)
- Yellavila, S. B., Agbenorhevi, J. K., Asibuo, J. Y. and Sampson, G. O. (2015). Proximate composition, minerals content and functional properties of five lima bean accessions. Journal of Food Security 3 (3): 69-74
- Yoon, I. S., Lee, G. W., Kang, S. I., Sun, Y. P., Jung, S. L., Jin-Soo, K. and Min, S. H. (2018). Chemical composition and functional properties of roe concentrates from skipjack tuna (Katsuwonus pelamis) by cook-dried process. Food Science and Nutrition 6 (1):1276–1286.