Performance Evaluation of Mobile Network Service Delivered Within Federal Polytechnic Bali and Its Environs; With a Focus on 2G and 3G Technologies
- Chibueze Okoro
- Dayo J. Oluloro
- 261-273
- Apr 10, 2024
- Information Technology
Performance Evaluation of Mobile Network Service Delivered Within Federal Polytechnic Bali and Its Environs; With a Focus on 2G and 3G Technologies
Chibueze Okoro1, Dayo J. Oluloro2
1Electrical/Electronic Engineering Technology Department,
Federal Polytechnic Bali, Taraba State Nigeria.
2Electrical/Electronic Engineering Department,
Federal Polytechnic Bali, Taraba State, Nigeria.
DOI: https://doi.org/10.51584/IJRIAS.2024.90325
Received: 27 February 2024; Accepted: 02 March 2024; Published: 09 April 2024
ABSTRACT
Monitoring the QoS (Quality of Service) of mobile network service providers is key if end users must derive maximum satisfaction from the numerous mobile services provided to them. In this research, data was collected via drive test, using mobile phones, Test Mobile System (TEMS) software a technology used by telecom operators to measure, analyze, and optimize their mobile networks, and Mapinfo software for post processing. For 2G technology, four parameters were analyzed which are Rx Lev (Received Signal Level), and Rx Qual (Received Signal Quality), while for 3G technology three parameters were analyzed which are RSCP (Received Signal Code Power), Ec/Io, and downlink throughput. The serving cells, Broadcast control channels as well as the Primary scrambling codes for all mobile network operators were recorded. The data collected was for MTN, Airtel and GLOBACOM (Glo) Networks, and the area of study comprised Bali metropolis, Maihula, Gazuba and Garbabi. It was deduced that the Rx_Lev range of negative 10dBm to negative 65dBm covered just 4.53%, 4.31% and 6.62% of the total route driven for MTN, Airtel and Glo respectively, which falls below the 75% requirement by the Nigerian Communication Commission (NCC). It was recommended amongst others the physical optimizations be carried out for PSC 19, 46, 70, 205, 313, 368 in order to improve coverage, quality and downlink throughput.
The results of this study have practical implications for all mobile network operators within the area of study as it provides valuable information enabling them to enhance their network infrastructure and services in order to meet set key performance indicators (KPIs) by the regulator, as well as ensure user derive satisfaction.
INTRODUCTION
Mobile network basically provides telecommunication services to end-users at all-time even when they are on the move. The services provided include voice calls, short message service, video calls, internet access etc. Initially mobile service providers were concerned with addressing the challenge with voice calls, this gave raise to 1G and 2G technologies, it became important to incorporate data then came 2.5G, when the speed of internet connection as well as data transfer arose, 3G,4G and even 5G were developed (Boutaba, K., et al.2019). Good QoS is essential in determining the performance of a mobile network, this has become an issue of national interest so much so that the senate of the Nigerian National Assembly asked mobile service providers to leave the country if they cannot improve the quality of service provided. Users get connected to mobile networks on daily basis hence the need to evaluate the QoS provided by the mobile service providers. Mobile operators also need to ensure the quality of service they provide meets international standards as well as ITU best practice. Furthermore, since mobile services are locally provided by Base Transceiver Stations (BTS), it becomes important to evaluate the performance of the cells within a cluster. The evaluation of network performance mainly has to do with taking measurement of certain KPIs of interest over the network. For evaluation of 2G QoS, voice clarity, call setup success rate, traffic channel congestion which impacts block calls as well as drop calls are the indicators to be watched out for (Biswas, S., & Dey, M. 2018). While for evaluation of 3G QoS, packet switched network would be the target and indicators to watch includes; Received Signal Code Power (RSCP), Frame Erasure Rate (FER). The area of research will cover the premises of Federal Polytechnic Bali as well as its immediate environs which comprised of Maihula town, Federal Polytechnic Bali, Bali metropolis and Gazabu.
Historical Development and Deployment of 2G and 3G Technologies in Nigeria
The historical development and deployment of 2G technology in Nigeria can be traced back to the early 2000s. Nigeria’s telecom sector began to experience significant growth and liberalization during this period (Ndukwe, 2003). Key milestones include:
- Introduction of GSM: In August 2001, Nigeria officially launched GSM (2G) services with the issuance of licenses to mobile operators like MTN, Airtel (formerly Econet), and Glo (Globalcom). This marked the beginning of digital mobile communication in the country (NCC, 2020).
- Network Expansion: Mobile operators rapidly expanded their networks to provide coverage in urban and rural areas. This expansion greatly increased mobile phone penetration, making telecom services more accessible to Nigerians (Owens-Ibie, 2017).
- Subscriber Growth: The introduction of 2G technology led to a significant increase in mobile subscribers. By 2010, Nigeria had one of the largest mobile subscriber bases in Africa, with millions of subscribers (ITU, 2010).
The deployment of 3G technology in Nigeria came as a natural progression to meet the increasing demand for data services and higher data speeds. Key developments include:
- Issuance of 3G Licenses: In 2007, the Nigerian Communications Commission (NCC) issued licenses to mobile operators to provide 3G services (NCC, 2020). This marked a significant step towards offering advanced mobile services.
- Network Upgrades: Mobile operators invested in upgrading their infrastructure to support 3G technology. This involved the deployment of 3G base stations and the integration of 3G-capable handsets into their offerings (Oyedele, 2013).
- Data Revolution: The deployment of 3G technology ushered in a data revolution in Nigeria. It enabled faster internet access, multimedia services, and mobile applications, transforming how Nigerians used mobile devices for communication and entertainment (Oyedele, 2013).
- Increased Competition: The availability of 3G services led to increased competition among mobile operators, resulting in competitive pricing and improved service quality (ITU, 2014).
METHODOLOGY
The following are the sub-headings; Drive test method for 2G and 3G Mobile Network evaluation, Instrument for data collection and the method of data analysis.
Drive Test Method for 2G and 3G Mobile Network Evaluation
Drive testing is a fundamental method for evaluating the performance of mobile networks, including 2G (2nd Generation) and 3G (3rd Generation) technologies. The method used in this research involved the physical movement of a specially equipped vehicle with a team of technicians using mobile measurement equipment to assess various aspects of network performance.
Equipment Setup
For drive testing, specialized measurement equipment was used, which includes W995 Sony Ericsson Test Phone, Car Inverter, Garmin GPS (Global Positioning System), and TEMS Investigation Software version 16.3.4 for data collection. These devices were placed inside the vehicle.
The software in these devices collected various network-related data, such as signal strength, call setup times, handover success rates, and data transfer rates.
SIM: a Subscriber Identity Module was used for connection to the Network from the Mobile Station. For this research, three SIMs were used which are those of the three major MNOs in Bali Metropolis.
Test Route
The route covered comprised of Maihula town, Federal Polytechnic Bali, Bali Metropolis and Gazabu.
Data Collection
As the vehicle moved along the predefined route, the measurement equipment continuously collected data related to network performance. Key performance indicators (KPIs) were measured, including but not limited to:
-
- Signal strength and quality.
- Channel to Interference
- Data throughput and latency.
- Broadcast control channel (BCCH) servers.
- Received Signal Code Power (RSCP).
- UMTS Active Radio Frequency Channel Number (UARFCN).
- Primary Scrambling code.
Data Analysis
Collected data was analyzed using Mapinfo software and simple average form KPI counts. The analysis included generating coverage maps, plotting KPI trends, and comparing results to predefined benchmarks or service-level agreements (SLAs).
RESULT
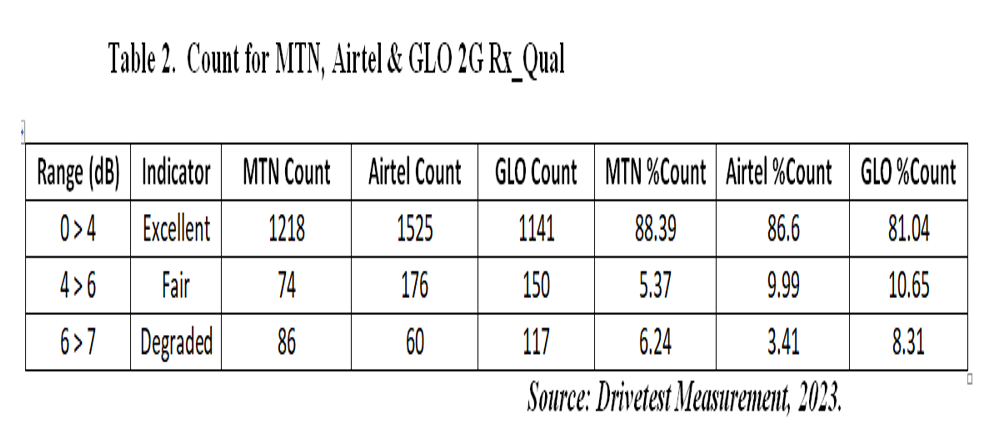
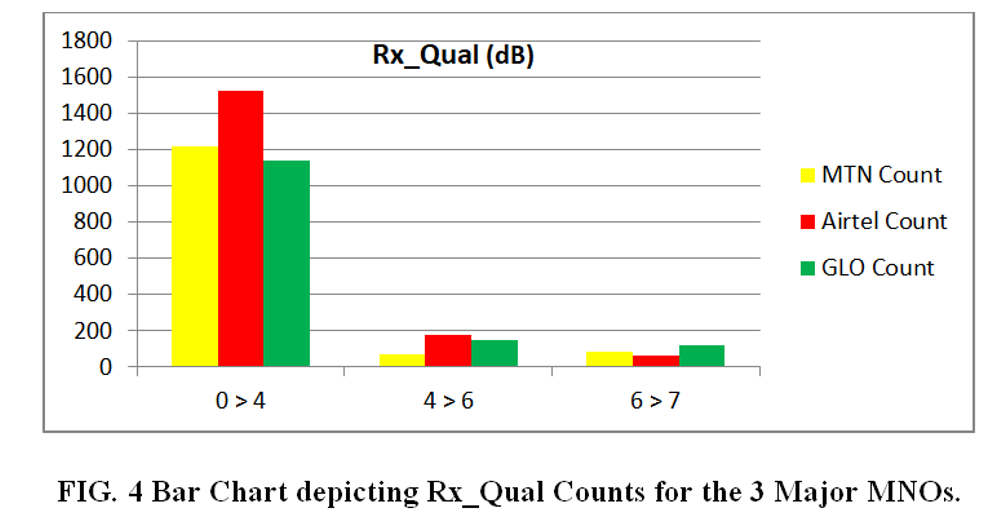
Result For 2G Technology
Result For 3G Technology
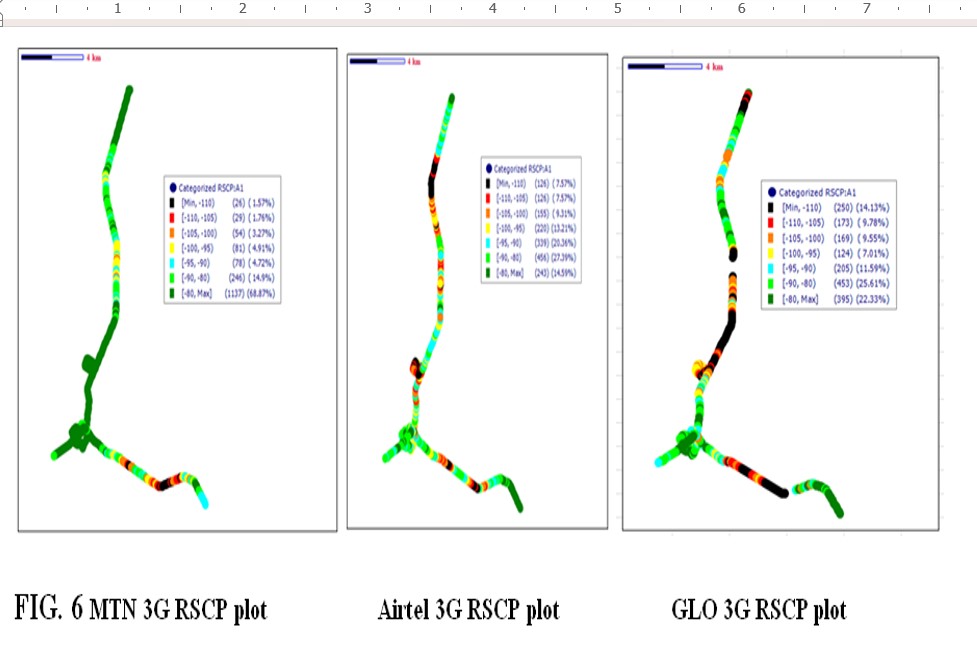
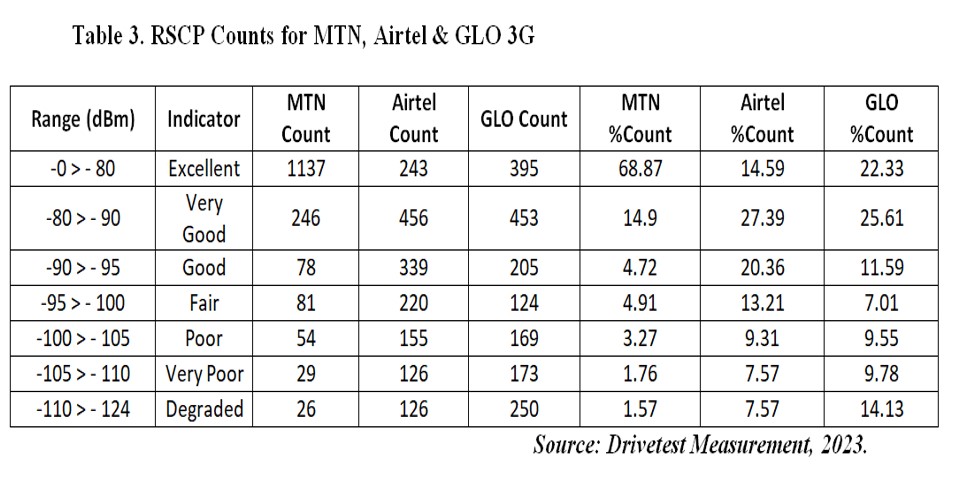
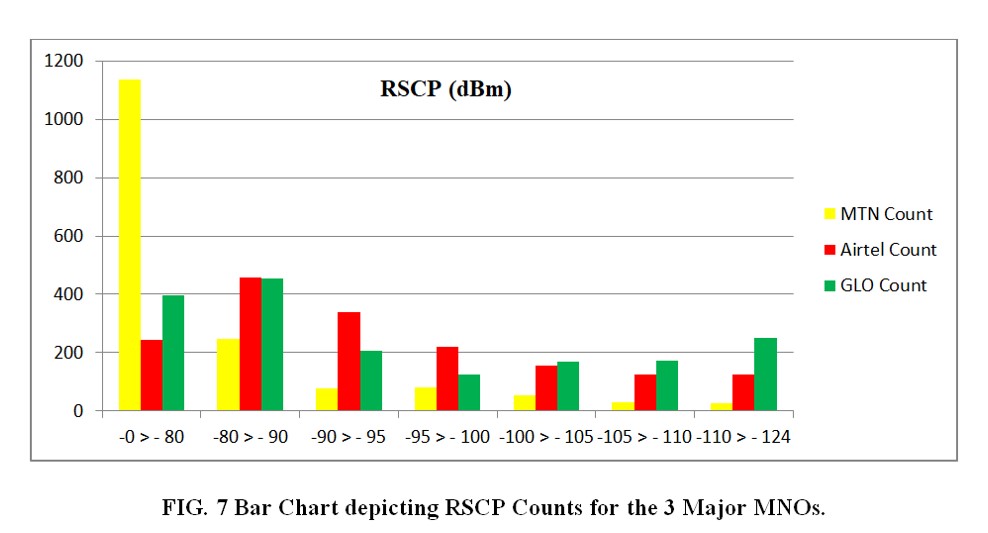
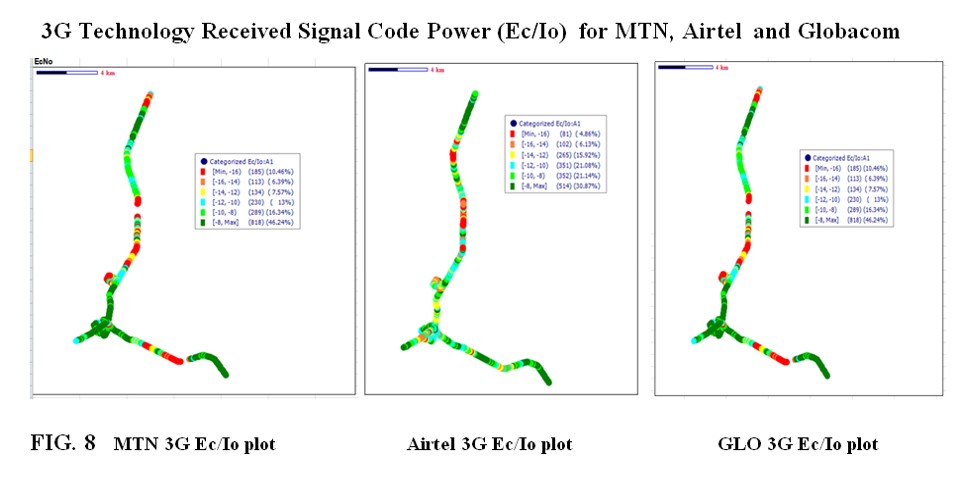
3G Technology Received Signal Code Power (RSCP) for MTN, Airtel and Globacom
DISCUSSION OF RESULTS
All the result obtained from the drive test measurement for individual Mobile network operators’ performance is analyzed, the reasons for poor coverage and poor received signal quality for each Mobile Network Operator are analyzed, while for 3G technology the reasons for poor downlink throughput for each Mobile Network Operator are analyzed too.
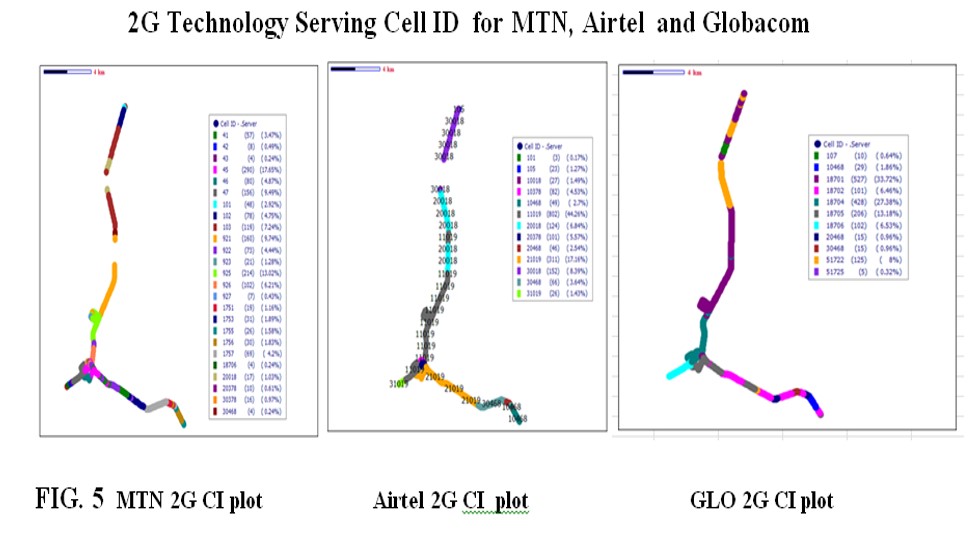
MTN 2G Result Discussion
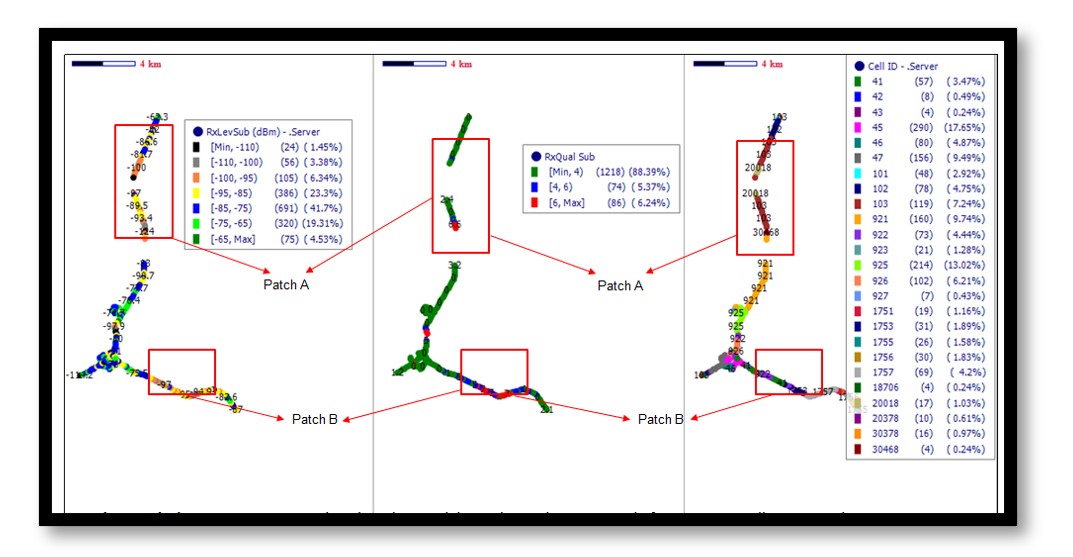
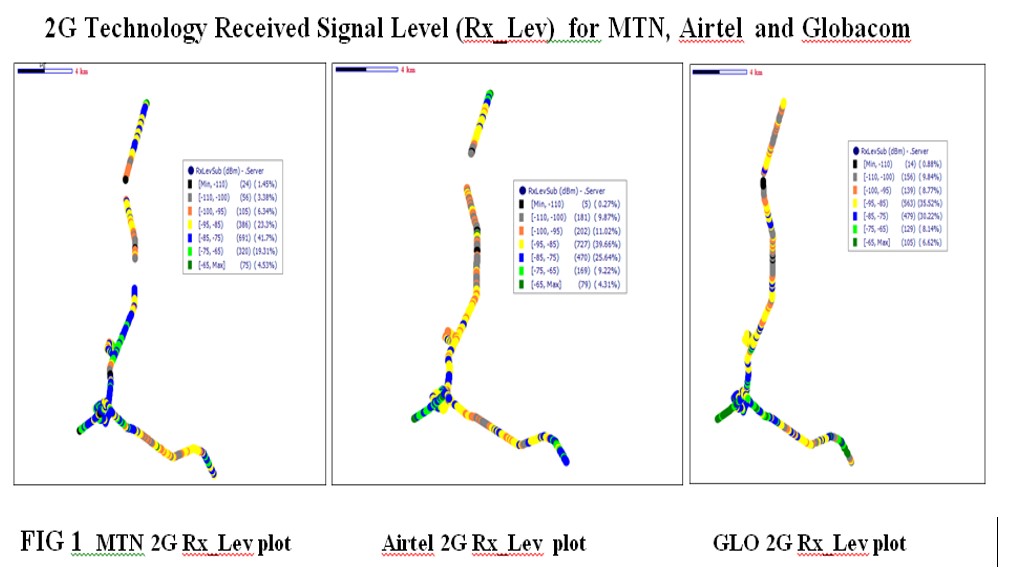
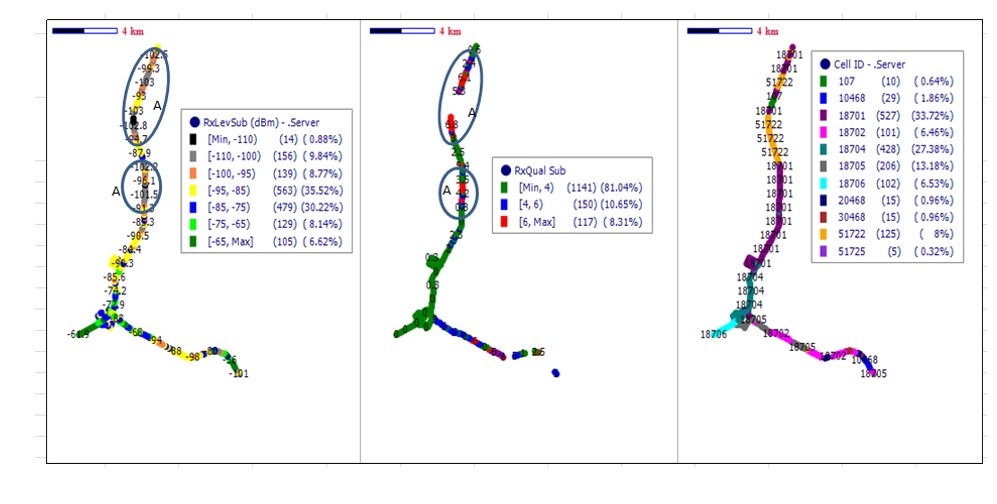
From the figure above, patch A and patch B reveals poor coverage and poor received signal quality resulting from limited-service mode from serving cells 20018, 103 and from serving cells 41, 922, 1753 respectively.
Airtel 2G Result Discussion
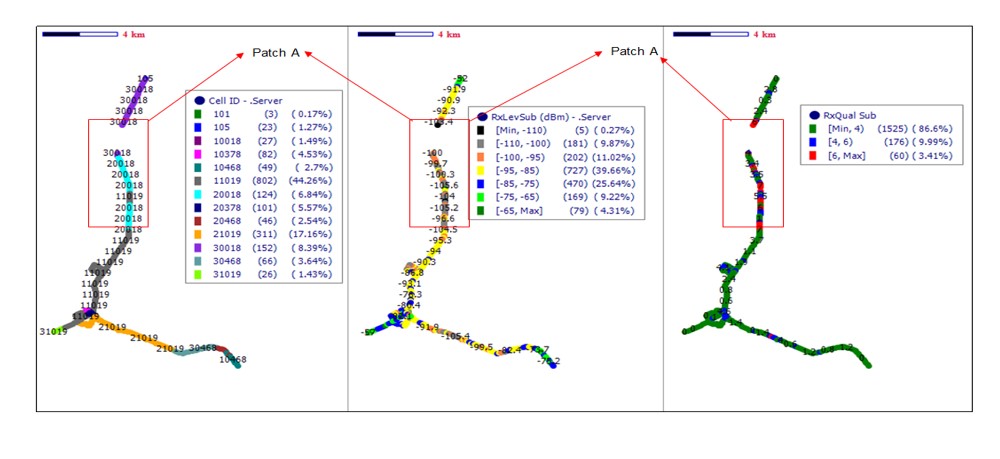
From the figure above, patch A reveals Poor coverage and quality due to poor dominancy from serving cells 30018, 20018 & 11019.
GLO 2G Result Discussion
From the figure above, patch A reveals Poor coverage and quality due to limited service from serving cells 51722, 107 & 18701.
MTN 3G Result Discussion
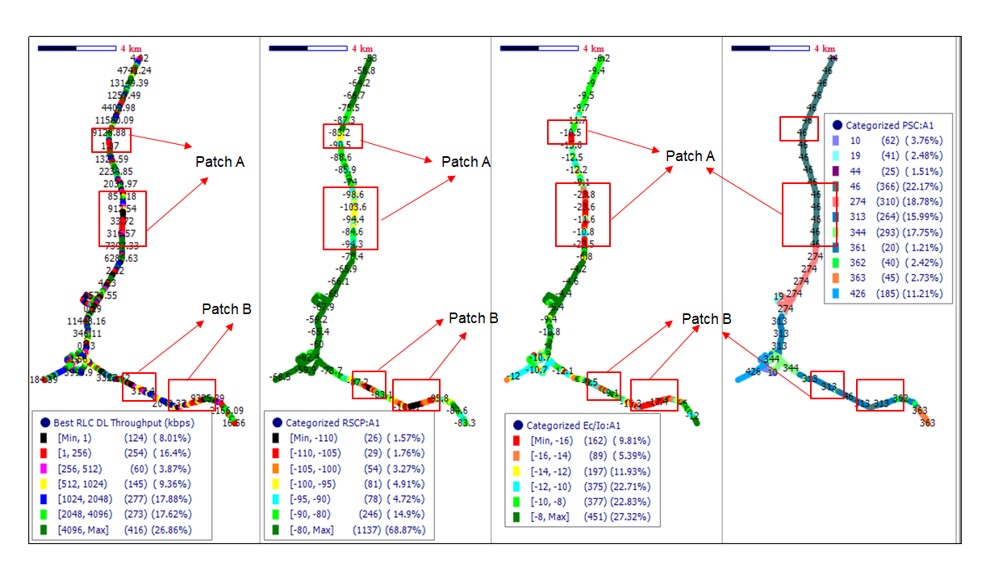
From the figure above, patch A reveals poor downlink throughput due to poor coverage and received signal code power from serving primary serving code (PSC) 46, while patch B reveals poor downlink throughput due to poor coverage and received signal code power from serving PSC 313.
Airtel 3G Result Discussion
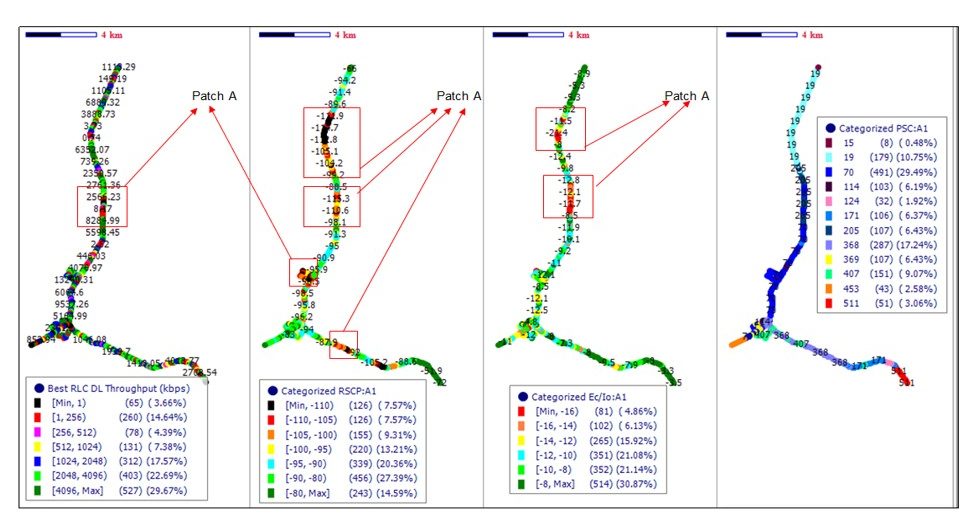
From the figure above, patch A reveals poor downlink throughput due to poor coverage and quality and low dominance from serving PSCs 19, 205, 70 and 368.
GLO 3G Result Discussion
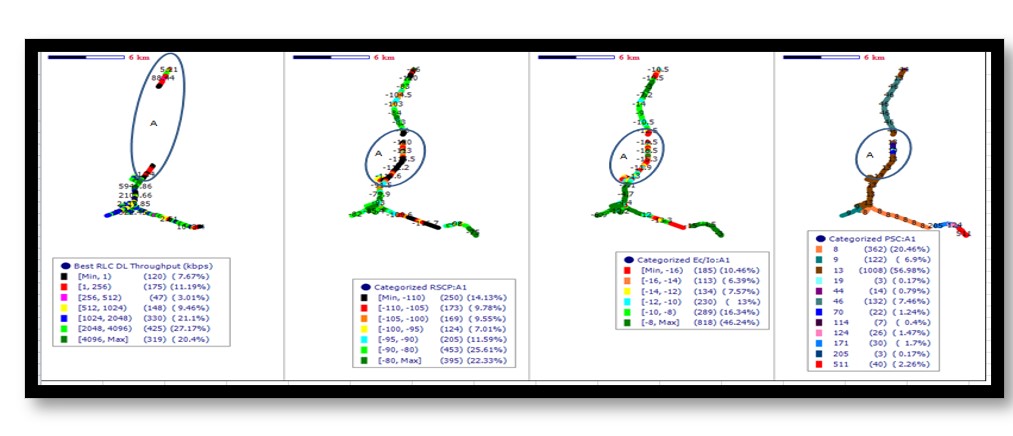
The figure above reveals poor downlink throughput due to limited service, poor coverage resulting from excess vegetation along the coverage path, and poor received signal code power from serving PSCs 13 and 19.
Result Analysis and Comparison between major MNOs evaluated.
i. Comparison of Rx_Lev and Rx_Qual values from the major MNOs evaluated.
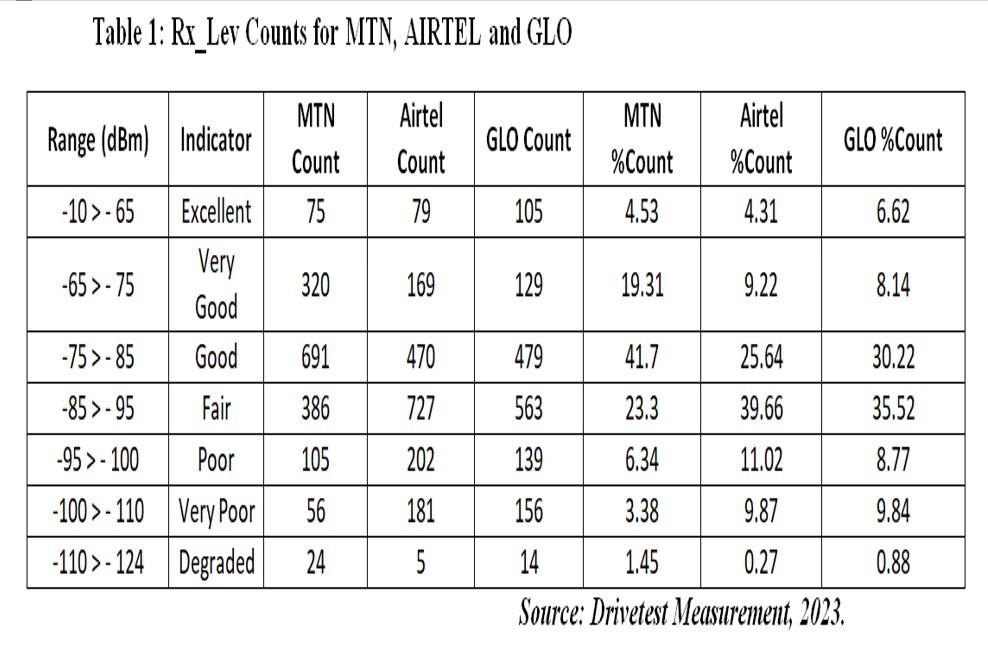
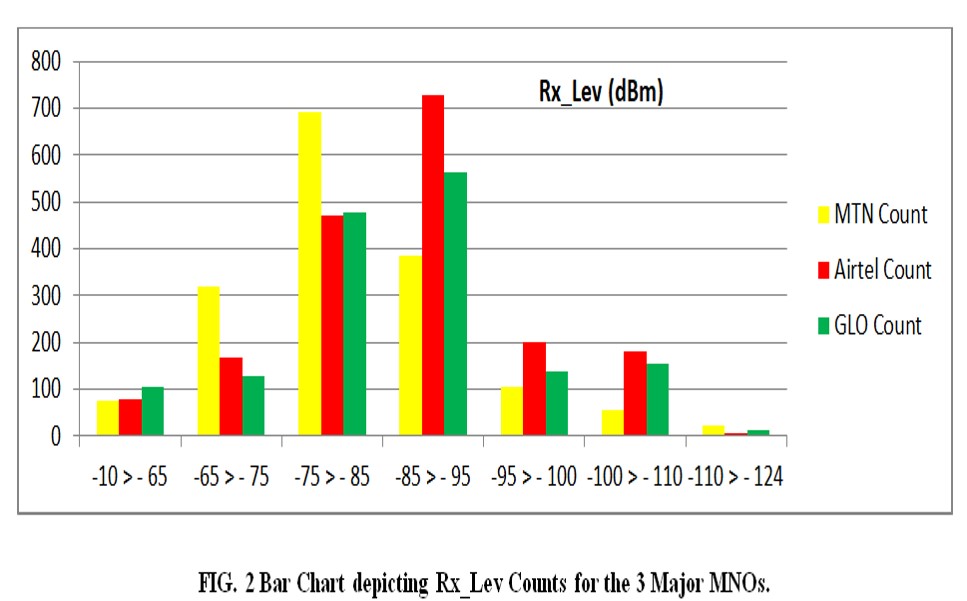
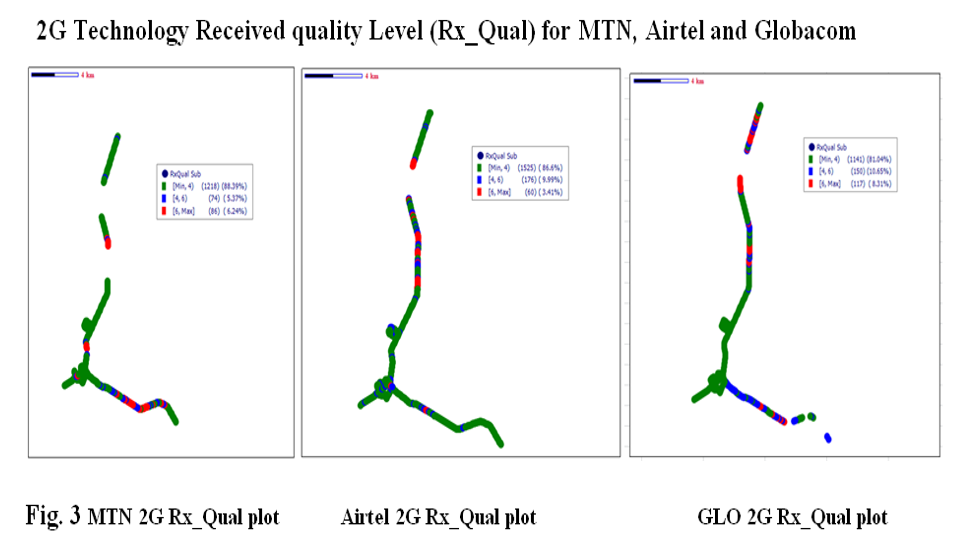
From table 1 and table 2, the Rx_Lev range of -10dBm to -65dBm covered just 4.53%, 4.31% and 6.62% of the total route driven for MTN, Airtel and Glo respectively, while the Rx_Qual range of 0dB to 4dB covered 88.33%, 86.60% and 81.04% of the total coverage area for MTN, Airtel and Glo respectively. For the Rx_Lev, it falls below the 75% being stipulated by the Nigeria Communication Commission (NCC) of the total coverage area (Akinyemi, 2014). While for the Rx_Qual the level across all the MNOs is high and meets stipulated standard.
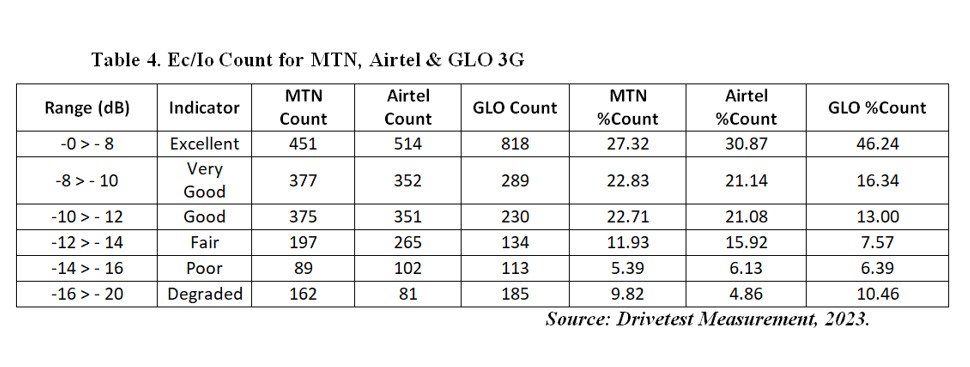
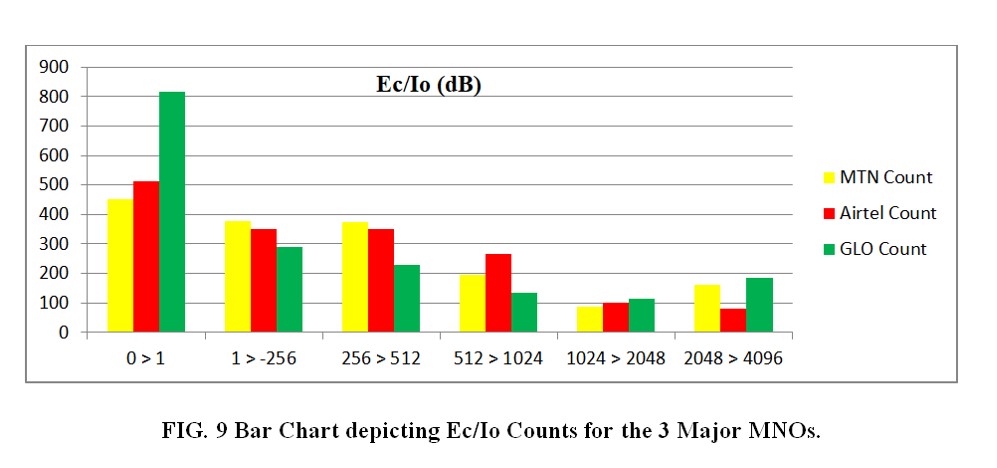
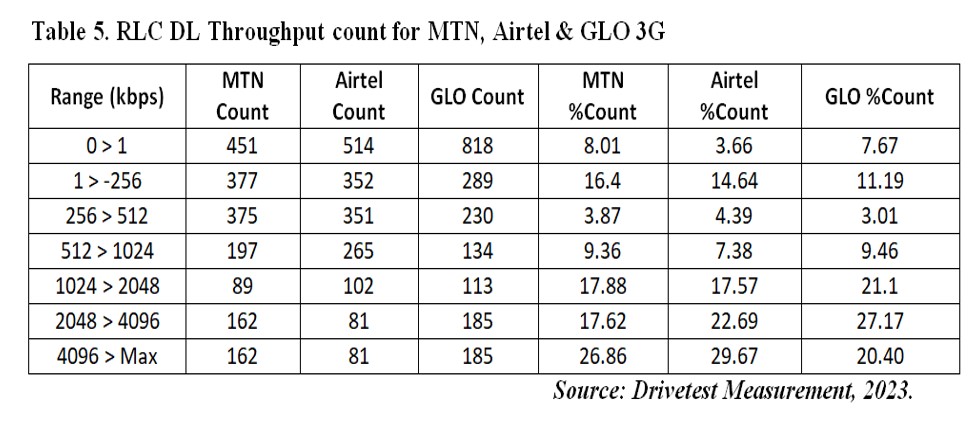
ii. Comparison of RSCP, Ec/Io and DL Throughput values from the major MNOs.
From table 3, table 4 and table 5, the RSCP range of 0dBm to -80dBm covered just 68.87%, 14.59% and 22.33% of the total route driven for MTN, Airtel and Glo respectively, while Ec/Io range of 0dB to 8dB covered 27.32%, 30.87% and 46.24% of the total coverage area for MTN, Airtel and Glo respectively, lastly maximum RLC DL Throughput values achieved for MTN, Airtel and Glo covered a total of 44.48%, 52.36% and 47.57% of the total coverage area.
CONCLUSION & RECOMMENDATIONS
Conclusion
Based on our findings, the following conclusions have been drawn:
The Rx_Lev along Bali-Maihula, part of Bali metropolis as well as the road from Bali town to Gazabu were very bad for all mobile network operators, the researchers concluded that this should be as a result of the vegetative coverage along this axis. Also, the inability to have maximum throughput counts for MTN, Airel and Glo mobile network was every pronounced, and the researchers concluded that this is as a result of low RSCP and Ec/Io counts that were recorded.
Recommendations
In view of the results of the study and the conclusions drawn, the following results were proffered by the researchers:
- For MTN network, the poor coverage and quality issues found on 2G network would require physical optimization for serving cells; 20018, 103, 922, 418 and 1753, while for the 3G network, the poor coverage, quality and low downlink throughput issues found require physical optimization for PSC; 19, 205, 70 and 368.
- For Airtel 2G network, the poor coverage and quality issues found would require physical optimization for serving cells; 30018, 20018,11019, while for the 3G network, the poor coverage, quality and low downlink throughput issues found would require physical optimization for PSC; 19, 205, 70, 368.
- For Glo 2G network, the poor coverage and quality issues found would require physical optimization for serving cells; 51722,107,18701, while for the 3G network, the poor coverage, quality and low downlink throughput issues would require physical optimization for PSC; 13, 19. Further checks need to be carried out on PSC 13 to rule out suspected overshooting.
REFERENCES
- Akinyemi, Lateef. (2014). Evaluation and Analysis of 3G Network in Lagos Metropolis, Nigeria. International Transaction of Electrical and Computer Engineers System,. 2. 81-87.10.12691/iteces-2-3-1.
- Biswas, S., & Dey, M. (2018). A Comprehensive Survey of Handover Management Schemes in 2G, 3G, and 4G Cellular Networks. IEEE Communications Surveys & Tutorials, 20(1), 97-139.
- Boutaba, K., et al. (2019). Key Performance Indicators (KPIs) in Network and Service Management: A Survey. IEEE Communications Surveys & Tutorials, 21(2), 1445-1483.
- ITU. (2014). ITU-T Recommendation G.114: One-way Transmission Time. Geneva, Switzerland: ITU.
- ITU. (2014). Measuring the Information Society 2014. International Telecommunication Union.
- ITU. (2010). Measuring the Information Society 2010. International Telecommunication Union.
- Ndukwe, E. (2003). Historical development and deployment of 2G technology in Nigeria: A review. Nigerian Telecommunications Journal, 1(2), 45-56.
- Owens-Ibie, N. (2017). Rapid expansion of mobile networks and increased mobile phone penetration in Nigeria. Journal of Nigerian Telecommunications Research, 12(3), 78-89
- Oyedele, L. O. (2013). Mobile operators’ investment in upgrading infrastructure to support 3G technology. International Journal of Mobile Communications, 11(5), 463-480.
- NCC (Nigerian Communications Commission). (2020). Annual Report 2020. Abuja, Nigeria: Nigerian Communications Commission.