Assessment of Physicochemical Quality, Heavy Metals, and Total Petroleum Hydrocarbon Concentration in Surface Water from Communities of the Jones Creek Oil Field, Niger Delta Nigeria
- Ikhumetse, A.A
- Abioye, O.P
- Ijah, U.J.J
- Kovo, A.S
- 75-93
- Jun 1, 2024
- Environmental Impact
Assessment of Physicochemical Quality, Heavy Metals, and Total Petroleum Hydrocarbon Concentration in Surface Water from Communities of the Jones Creek Oil Field, Niger Delta Nigeria
Ikhumetse, A.A*1., Abioye, O.P1., Ijah, U.J.J1. and Kovo, A.S2
1Department of Microbiology, Federal University of Technology, Minna, Nigeria
2Department of Chemical Engineering, Federal University of Technology, Minna, Nigeria
*Corresponding Author
DOI: https://doi.org/10.51584/IJRIAS.2024.905007
Received: 12 May 2024; Revised: 23 May 2024; Accepted: 27 May 2024; Published: 01 June 2024
ABSTRACT
This study was carried out to assess the physicochemical parameters, concentrations of heavy metals and Total Petroleum hydrocarbons in surface water from Kokodiagbene and Akpata Egbebe in the Jones Creek oil field communities of the Niger Delta region of Nigeria. Physicochemical properties were determined using standard methods. The metal concentrations were analyzed using Atomic Absorption Spectrometer (AAS), while Total Petroleum Hydrocarbon (TPH), was extracted from the water samples using standard solvent extraction method, and Gas Chromatography/Mass Spectroscopy (GC/MS) was used to quantify the TPH present in the water samples. The results reviewed that pH, turbidity, concentrations of potassium, calcium, BOD5, nitrates, sulphates and phosphates in all water samples were below and within the WHO and Federal Environmental Protection Agency, Nigeria (FEPA) limits, while, the mean concentrations of electrical conductivity, total hardness, total dissolved solids, dissolved oxygen, chemical oxygen demand and chlorides (12900.00±200.51–22700.00±12.78 µs/cm, 952.00±10.62-2452.00±25.84 mg/L, 6350.00±50.34-11350.00±45.66 mg/L, 12.350.05-17.85±0.05 mg/L, 240.00±12.62-780.00±20.00 mg/L and 187.36±8.50-605.93±9.97 mg/L respectively) in all samples which were above the WHO and FEPA limits for surface water. Lead (Pb) in all water samples exceeded WHO permissible limits. Cadmium, chromium, and Arsenic in some of the water samples exceeded WHO permissible limits, while Zinc, Copper, Vanadium, Nickel, Manganese and Mercury concentrations were below the detection limits in all the water samples analyzed. Mean TPH value of 25.75±2.85 mg/L recorded in Kokodiagbene was above permissible limits, while others were within permissible limits. The study’s conclusions highlight the important consequences of oil exploration activities, which might gravely contaminate the creek if appropriate oversight bodies are not set up to keep an eye on them. Therefore, the research recommends that multinational corporations and other enterprises involved in the exploration and extraction of oil resources employ globally recognized remediation technologies immediately in order to clean up the contaminated water supplies.
INTRODUCTION
Water is an important resource that is necessary for human nutrition, food production, economic growth, disease prevention, and overall well-being (Bilewu et al., 2022). Water bodies serves as the habitat of numerous aquatic species which serve as the primary source of food for the food chain (Sayed et al., 2021). Water sources can originate from marine ecosystems such as estuaries and the ocean, or from freshwater settings such as lakes, ponds, reservoirs, rivers, streams, groundwater, and wetlands (Edori et al., 2021). Human activities near rivers frequently result in changes to the quality of surface water. Rivers are also used as a disposal site for trash, most of which comes from home, commercial, and agricultural sources. These water bodies are frequently extremely contaminated because they often get treated, untreated, or partially treated industrial pollutants (Sarfo et al., 2023).
The term “water pollution” refers to the direct or indirect contaminating of water bodies caused by human activity that is not well-planned (Edori et al., 2021). These contaminants pollute water, rendering it unfit for home, industrial, and agricultural use in addition to making it harmful to drink (Maxwell et al., 2023). Nigeria has benefited greatly from the exploration and exploitation of oil, but the unfavourable effects of these production processes have been catastrophic (Ogbuneke and Ezeibeanu, 2020; Ikhumetse et al., 2022). One of these is the discharge of hazardous organic and inorganic chemicals, such as heavy metals and hydrocarbons, into water bodies and even land, posing a local and global threat to agriculture, water security, the world ecology, and human health (Ikhumetse et al., 2019).
One of the principal oil field facilities found and used in Nigeria’s Niger Delta are the Jones Creek Oil Field and the Gas Plant that is connected to it. It is a significant Escravos River tributary (Ugbe, 2012). In addition to providing drinking water, it is used for recreation, sand dredging, transportation, fishing, and even trash disposal. The Niger Delta region has seen a significant rise in the number of oil spills as a result of increased oil exploration and production. Accidents and intentional acts by certain locals who damage pipelines to steal oil or express disapproval of the Federal government of Nigeria and oil corporations’ operations also result in spills (Ikhumetse et al., 2022).
The quality of the surface waters in the Niger Delta has been the subject of numerous studies; however, information regarding the Jones Creek water quality is lacking. Because water is essential to life and must be available to everyone, this study was therefore set out to determine the physicochemical characteristics, heavy metal concentrations, and total petroleum hydrocarbon concentrations of surface water from a selected communities in the Jones Creek Oil Field. The goal was to provide information on the quality status, sources of contamination, and risk to humans. Data from this study is useful for managing water quality and developing treatment plans for water.
MATERIALS AND METHODS
Study Area
The study area was the Jones Creek Oil Field and it is situated between latitudes 5°40’19.848″N and longitudes 5°19’4.354″E in Warri South West Local Government Area of Delta State in the Niger Delta of southern Nigeria (Figure 1). It is a water-body area contaminated by oil that is a part of the western ecology of the Niger Delta (Ugbe, 2012). The Escravos River served as the study’s control location since it is devoid of economic activity such as oil prospecting. Southern Nigeria’s center region is home to the Niger Delta. With a total land size of 7,000 km2, it is the largest delta in Africa (Ikhumetse et al., 2022). Farmers and fisherman make up the majority of the residents of Jones Creek. The Escravos River axis is home to a variety of industries, including as transportation, illegal oil bunkering, and oil exploration and production. Flow stations, oil fields, and gas plants are examples of oil production facilities owned by multinational oil firms, and they are the main cause of the river’s ongoing contamination (Muhammad et al., 2020) (Plate 1). The river water passes through a number of communities, including Akpata Egbebe and Kokodiagbene, with varying levels of oil exploration activities, which may have an impact on the overall quality of the water.
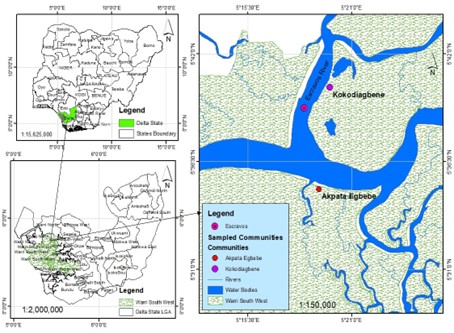
Figure 1: The Study Area (The Jones Creek Oil Field) Warri South West LGA, Delta State, Nigeria.
Source: Department of Geography, Federal University of Technology, Minna, Nigeria (2024)
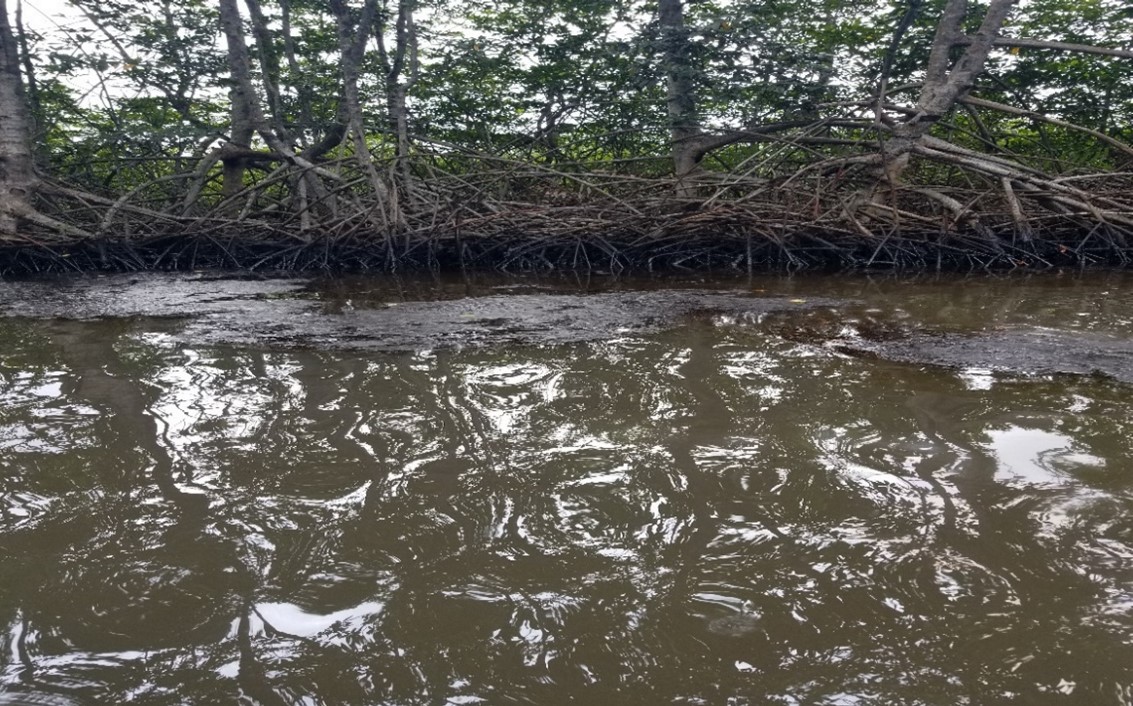
Plate 1: Hydrocarbon contamination of surface water in Kokodiagbene, Jones creek oil Field in Niger Delta Nigeria (Field Photograph)
Collection and Processing of Samples
Crude oil-contaminated water samples were collected from four (4) different points (two points per community), with a space of 50 m apart. About 2 litres of the sample collected from each point in a community were combined to get a composite sample for that community, which was used in the analysis. Water samples were also collected from the middle of the Escravos River which served as the control. Four-liter glass bottles that had been disinfected with 70% alcohol 24 hours before the final collection were used for the collection. In accordance with the procedure of Umeojiakor et al. (2019), the bottles were rinsed three times with the water samples before the final collection. The samples were transported in a cold box (4±1° C) to the Federal University of Technology’s Microbiology Laboratory in Minna, Nigeria, for physicochemical analysis using standard procedures as outlined by the American Public Health Association (APHA, 2017).
Determination of Physicochemical parameters of the Water Samples
Standard procedures were used to ascertain the water sample’s physicochemical characteristics (APHA, 2017). pH, nitrates, Biological Oxygen Demand (BOD), phosphates (PO₄), sulfate, potassium, calcium, turbidity, electrical conductivity (EC), Total hardness (CaCO3), chemical oxygen demand (COD), total dissolved solids (TDS), and dissolved oxygen (DO) were the parameters that were examined. Experiment was performed in triplicates and average values was used in the results.
Determination of Heavy metals in water samples
Atomic absorption spectrophotometer (AAS), was used to examine the levels of heavy metals (lead, cadmium, chromium, arsenic, copper, nickel, manganese, mercury, vanadium, iron, and zinc) (WHO, 2012). Accordingly, using a pipette, 50 mL of the water samples were measured individually into a 100 mL beaker. 10 mL of nitric acid was then added, and the beaker and contents were placed on a hot plate. The process of digestion was continued until the white fumes of nitric acid had disappeared. The heating process was kept going till the content dropped to 10 milliliters. After rinsing the material with de-ionized water, some insoluble particles were removed from the digest by filtering it. After the filtrate was moved, 50 mL of de-ionized water was added to the volumetric flask. The identical process was used to digest corresponding blank samples. Lastly, an atomic absorption spectrophotometer (AAS) (AAS 500 WIN) was used to quantify the content of heavy metals in each sample (Eze et al., 2014). Experiment was performed in triplicates and average values was used in the results.
Determination of Total Petroleum Hydrocarbon (TPH)
Standard solvent extraction (Gravimetric) method was applied to extract the TPH from the water samples and Gas Chromatography/Mass Spectroscopy (GC/MS) was utilized to measure the total petroleum hydrocarbon (TPH) present in the water samples (APHA, 2017). Experiment was performed in triplicates and average values was used in the results.
Solvent extraction (Gravimetric analysis) of Total Petroleum Hydrocarbon (TPH)
To determine the amount of TPH in the water samples, a partition gravimetric method was employed. Hexane was used as the extracting solvent in a liquid-liquid extraction procedure that was conducted. After shaking the water sample and measuring 20 mL, the organic solvent (hexane) was measured and placed into a separating funnel. The funnel was then shaken for five minutes. After mounting the separating funnel on the retort stand, it was given a few minutes to settle. Hexane was used for generating two immiscible liquid layers: an aqueous solution was in the bottom layer and petroleum hydrocarbons were in the upper layer. The organic phase (hexane) was collected in a pre-weighed tube (conical flask/film container) after passing through anhydrous sodium sulphate to remove the moisture, and the aqueous layer was collected in a beaker using the separating funnel’s tap (Eze et al., 2014). Three aliquots of hexane were used to extract the material one at a time in the separating funnel. In a fume cabinet, the solvent extracts were combined and dried by evaporation at room temperature (20–25 °C). Following solvent evaporation, the sample was used for Gas Chromatography analysis (Raed and Shimaa, 2014) and the total petroleum hydrocarbon was quantified gravimetrically (El-Borai et al., 2016).
Gas Chromatography/Mass Spectrometry (GC/MS) Analysis
Employing GC/MS, the major hydrocarbon components were extracted from water samples contaminated by crude oil (Bacosa et al., 2015). An Agilent model 6890 with a mass spectrometer detector was used for the analysis. The GC column had a capillary size of 0.25, 30m, and DB-5. After 3 mins, the column’s original temperature was 80o C. The temperature was set to rise by 5 o C per minute, reaching a maximum of 280 o C. A standard procedure involves injecting 1μl of the sample into the port, allowing it to vapourize instantly and be carried down the column using helium as the carrier gas. The components were determined following the separation in the column (Gupte and Sonawdekar, 2015).
Data Analysis
Data were analyzed using statistical package for social science (SPSS) version 20 and were presented as Mean ± SEM. Comparisons between different groups were done using two-way Analysis of Variance (ANOVA) and Duncan’s Multiple Range Test (DMRT). Values of P<0.05 were considered as statistically significant.
RESULTS
Physicochemical Parameters and TPH concentrations of water samples collected from communities of Jones Creek Oil Field
Table 1 displays the findings of the physicochemical examination and TPH concentrations of water samples from communities in the Jones Creek Oil Field. All of the water samples’ turbidity, pH, potassium, calcium, BOD5, nitrates, sulphates, and phosphates, as well as their nitrates, were found to be within the acceptable limits for surface water set by the Federal Ministry of Environment (FEPA, 2003), now the Federal Ministry of Environment, Standard Organization of Nigeria (SON, 2007) and World Health Organization (WHO, 2012). The water samples obtained from Kokodiagbene and along the Escravos River had mean chloride levels of 605.93±9.97 mg/L and 585.99±8.02 mg/L. These values were higher than the acceptable limits of 250 mg/L recommended by SON and WHO. On the other hand, the water samples obtained from Akpata Egbebe showed acceptable levels of chloride. All water samples that were examined had electrical conductivity (EC) levels that exceeded allowable limits. The water samples from Kokodiagbene, Akpata Egbebe, and along the Escravos River had mean EC values of 20150.00±50.62, 12900.00±200.51, and 22700.00±12.78 mg/L respectively. The water sample from along the Escravos River had the highest Total Hardness, measuring 2452.00±25.84 mg/L; Kokodiagbene had a mean value of 2132.00±100.25 mg/L; Akpata Egbebe had the lowest mean values, measuring 952.00±10.62 mg/L. All of these values were above the permissible limits of 200 mg/L and 150 mg/L, respectively, that the WHO and FEPA had set for surface water. The water sample had total dissolved solids (TDS) beyond the WHO and FEPA legal limits for surface water, which are 1000 and 500 mg/L, respectively. The mean TDS values obtained for Kokodiagbene, Akpata Egbebe, and Escravos River were 10150.00±50.10, 6350.00±50.34, and 11350.00±45.66 mg/L, in that order. The average levels of dissolved oxygen (DO) in Kokodiagbene and Akpata Egbebe were found to be 14.20±0.10 and 17.85±0.05 mg/L, respectively, exceeding the limits set by law of 14 mg/L. Conversely, the mean DO in water samples contaminated by crude oil from the Escravos River was found to be 12.350±05 mg/L, which was below the limit. The mean COD values of Kokodiagbene and Akpata Egbebe were also 520.00±30.20 and 780.00±20.00 mg/L above the limit, respectively, however the COD value of the water sample from the Escravos River was 240.00±12.62 mg/L, which was below the regulatory authorities’ limit of ˂ 250 mg/L. Water samples from Akpata Egbebe and the Escravos River recorded mean TPH values of 8.00±0.10 and 6.55±0.91 mg/L below permissible limits, while water sample collected from Kokodiagbene was above 10.00 mg/L limits in surface water given by FEPA and Department of Petroleum Resources (DPR, 2011), with a mean concentration of 25.75±2.85 mg/L.
Table 1: Physicochemical parameters and TPH concentrations of water samples collected from communities of Jones Creek Oil Field
| Water Samples | |||||
| Parameters | A | B | C | WHO (mg/L) | FEPA/SON (mg/L) |
| pH | 6.91±0.01d | 6.94±0.01e | 6.88±0.01d | 6.5-9.0 | 6.5-8.0 |
| Turbidity (NTU) | 0.06±0.01b | 0.11±0.00c | 0.05±0.00a | 5 | 5 |
| EC (µs/cm) | 20150.00±50.62b | 12900.00±200.51a | 22700.00±12.78c | 1000 | 1000 |
| Total Hardness (mg/L) | 2132.00±100.25b | 952.00±10.62a | 2452.00±25.84c | 200 | 150 |
| TDS (mg/L) | 10150.00±50.10b | 6350.00±50.34a | 11350.00±45.66c | 1000 | 500 |
| DO (mg/L) | 14.20±0.10b | 17.85±0.05c | 12.350.05a | 14 | 14 |
| K+ (mg/L) | 8.97±0.23a | 8.40±0.08a | 8.99±0.24a | 12 | NS |
| Ca+ (mg/L) | 1.67±0.01b | 1.35±0.10a | 1.80±0.01c | 75 | NS |
| BOD5 (mg/L) | 1.95±0.05b | 6.35±0.05c | 1.45±0.12a | 10 | NS |
| COD (mg/L) | 520.00±30.20abc | 780.00±20.00c | 240.00±12.62a | ˂250 | ˂250 |
| Chlorides (mg/L) | 605.93±9.97b | 187.36±8.50a | 585.99±8.02b | 250 | 250 |
| Nitrates (mg/L) | 0.14±0.00a | 0.14±0.00a | 0.14±0.00a | ≤50.0 | 50 |
| Sulphates (mg/L) | 0.61±0.01b | 0.71±0.02c | 0.53±0.01a | 250 | 100 |
| Phosphates (mg/L) | 2.26±0.02b | 2.12±0.24b | 0.83±0.01a | 5 | NS |
| TPH (mg/L) | 25.75±2.85b | 8.00±0.10a | 6.55±0.91a | – | 10 (DPR) |
Values are expressed in mean ± standard error of mean of triplicate determination. Values with different superscript on the same column are significantly different at p<0.05.
KEY; A = River water from Kokodiagbene, B = River water from Akpata Egbebe, C = water sample collected along the Escravos River (Control), TDS = Total Dissolved Solids, BOD = Biochemical Oxygen Demand, COD = Chemical Oxygen Demand, DO = Dissolved Oxygen, Nephelometric Turbidity Unit (NTU), EC = Electrical Conductivity, TPH= Total Petroleum Hydrocarbons, NS = Not stated, μS/cm = micro-Siemens per centimeter, mg/L = Milligram per litre, HU = Hazen units, FEPA = Federal Environmental Protection Agency, std = Standard, WHO= World Health Organization, SON= Standard Organization of Nigeria, DPR = Department of Petroleum Resources.
GC/MS Analysis
Figures 2-4 depicts the chemical pollutants that were eluted from the water samples during the gas-chromatography study. Tables 2-4 provide an overview of the discovered chemicals and their percentage composition in the water samples. The water sample from Kokodiagbene (Figure 2 and Table 2) included twenty (20) hydrocarbons, according to the GC-MS analysis. The water sample from Akpata Egbebe (Figure 3 and Table 3) had seven (7) hydrocarbons, while the water sample from along the Escravos River revealed the presence of six (6) chemical compounds(Figure 3 and Table 4). These substances were in the C7–C44 range. Among these chemicals that were detected were benzene, and straight chain alkanes (nonane, pentadecane, and tridecane). The water sample included cyclic chemicals as well, including Carbonic acid, 1,2-Benzenedicarboxylic acid, Sulfurous acid, phenol, and benzene derivatives. Chemicals like dibutyl phthalate, and methoxyacetic acid were also found. Nevertheless, a few branch chain hydrocarbons predominated. Additionally, the chromatogram’s hop was consistent with a crude oil basis that contained many unresolved complex mixtures (UCM).
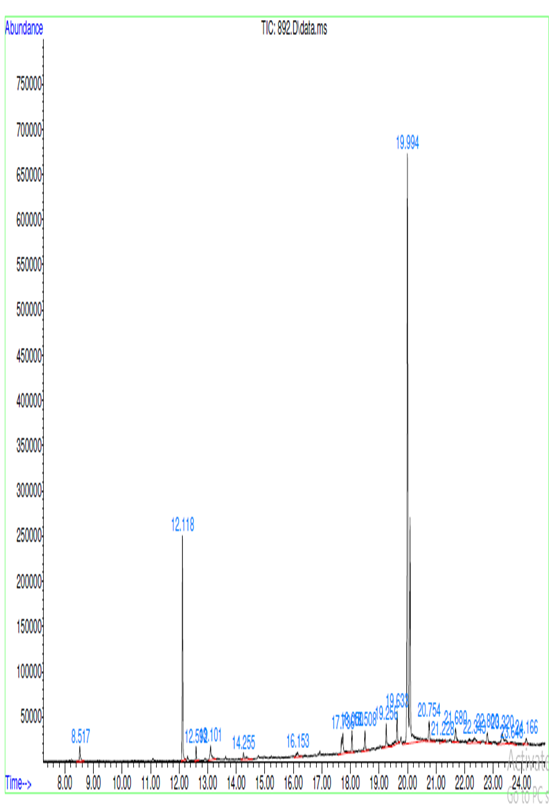
Figure 2: Chromatogram of the crude oil-contaminated water sample collected from Kokodiagbene community of Jones Creek Oil Field
Table 2: Hydrocarbons identified in crude oil-contaminated water sample collected from Kokodiagbene community of Jones Creek Oil Field
| PK | COMPOUND | FORMULA | RT (mins) | AREA (%) |
| 1 | 2-Butenedioic acid (Z)-, dibutyl ester,
2-Butenedioic acid (Z)-, dibutyl ester, 2-Butenedioic acid (Z)-, dibutyl ester, |
C12H20O4,
C12H20O4, C12H20O4 |
8.517 | 1.27 |
| 2 | 1,2-Benzenedicarboxylic acid, bis(2-methylpropyl) ester,
Phthalic acid, butyl isohexyl ester, Phthalic acid, isobutyl nonyl ester |
C16H22O4,
C18H26O4, C21H32O4 |
12.118 | 12.58 |
| 3 | 7,9-Di-tert-butyl-1-oxaspiro (4,5) deca-6,9-diene-2,8-dione,
7,9-Di-tert-butyl-1-oxaspiro (4,5) deca-6,9-diene-2,8-dione, Tricyclo [5.2.2.0(1,6)] undecan-3-ol, 2-methylene-6,8,8-trimethyl- |
C17H24O3,
C17H24O3, C15H24O |
12.592 | 0.77 |
| 4 | n-Hexadecanoic acid
n-Hexadecanoic acid n-Hexadecanoic acid |
C16H32O2,
C16H32O2, C16H32O2 |
13.101 | 1.84 |
| 5 | Pentafluoropropionic acid, dodecyl ester,
Heptafluorobutyric acid, n-tetradecyl ester, 3-Chloropropionic acid, heptadecyl ester |
C15H25F5O2,
C18H29F7O2, C10H19CLO2 |
14.255 | 1.21 |
| 6 | 2-Decanol, trifluoroacetate,
4-Methyl-dodec-3-en-1-ol, Dodecyl isobutyl ether |
C12H21F3O2,
C13H26O, C16H34O |
16.153 | 0.99 |
| 7 | Heptadecane,
Heptadecane, Tetracosane, 1-bromo- |
C17H36,
C17H36, C24H49Br |
17.736 | 3.20 |
| 8 | Bis(2-ethylhexyl) phthalate,
Bis(2-ethylhexyl) phthalate, Diisooctyl phthalate |
C24H38O4,
C24H38O4, C24H38O4 |
18.050 | 1.53 |
| 9 | Hexacosane,
Hexacosane, 2-Methylhexacosane |
C26H54,
C26H54, C27H56 |
18.508 | 1.80 |
| 10 | Heptacosane,
Eicosane, Tetratetracontane |
C27H56,
C20H24, C44H90 |
19.256 | 1.96 |
| 11 | 1,4-Benzenedicarboxylic acid, bis(2-ethylhexyl) ester,
Terephthalic acid, di(4-octyl) ester, 1,3-Benzenedicarboxylic acid, bis(2-ethylhexyl) ester |
C24H38O4,
C24H38O4, C24H38O4 |
19.633 | 2.82 |
| 12 | Decanedioic acid, bis (2-ethylhexyl) ester,
Decanedioic acid, bis (2-ethylhexyl) ester, Sebacic acid, di(3-methylbut-2-yl) ester |
C26H50O4,
C26H50O4, C20H38O4 |
19.994 | 57.99 |
| 13 | Eicosane,
Eicosane, Tritetracontane |
C20H42,
C20H24, C43H88 |
20.754 | 2.56 |
| 14 | Ethyl 2-(2-chloroacetamido)-3,3,3-trifluoro-2-(2-fluoroanilino) propionate,
1,1,1,3,5,5,5-Heptamethyltrisiloxane, Arsenous acid, tris(trimethylsilyl)ester |
C13H13ClF4N2O3,
C7H22O2Si3, C9H27AsO3Si3 |
21.228 | 0.67 |
| 15 | Eicosane,
Eicosane, Carbonic acid, decyl undecyl ester |
C20H42,
C20H42, C22H44O3 |
21.680 | 1.57 |
| 16 | N-(2-Acetylcyclopentylidene) cyclohexylamine,
Cyclohexanecarboxamide, N-furfuryl, Hexahydropyridine, 1-methyl-4-[4,5-dihydroxyphenyl]- |
C13H21NO,
C12H17NO2, C10H28O4Si3 |
22.343 | 1.98 |
| 17 | 1-Bromoeicosane,
1-Octadecanesulphonyl chloride, 13,17,21-Trimethylheptatriacontane |
C20H41Br,
C18H37CLO2S, C40H82 |
22.800 | 1.30 |
| 18 | Cholesterol,
Cholest-5-en-3-ol, (3. alpha.)-, 2-Myristynoyl-glycinamide |
C27H46O,
C27H46O, C16H28N2O2 |
23.320 | 2.62 |
| 19 | Heptasiloxane,1,1,3,3,5,5,7,7,9,9,11,11,13,13-tetradecamethyl-,
5H-dibenzo[a,d]cyclohepten-5-amine, Benzo[h]quinoline, 2,4-dimethyl- |
C14H44O6Si7,
C15H13N, C15H13N |
23.646 | 0.63 |
| 20 | Nonadecane,
Heneicosane, 3-methyl, Ethanol, 2-(hexadecyloxy)- |
C19H40,
C22H46, C18H38O2 |
24.166 | 0.72 |
Key: PK = Peak number, RT = Retention time
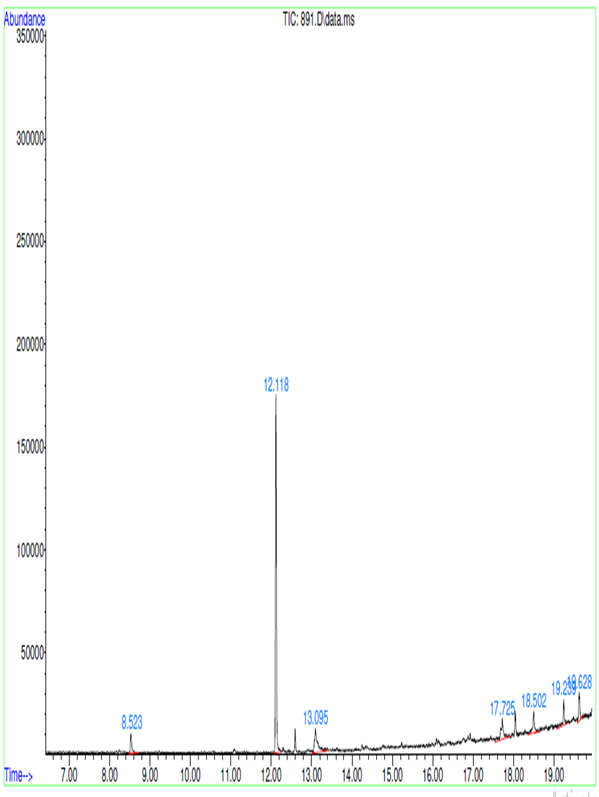
Figure 3: Chromatogram of the crude oil-contaminated water sample collected from Egbebe community of Jones Creek Oil Field
Table 3: Hydrocarbons Identified in Crude oil-contaminated water sample collected from Akpata Egbebe community of Jones Creek Oil Field
| PK | COMPOUND | FORMULA | RT (mins) | AREA (%) |
| 1 | 2-Butenedioic acid (Z)-, dibutyl ester,
2-Butenedioic acid (Z)-, dibutyl ester, 2-Butenedioic acid (Z)-, dibutyl ester |
C12H20O4,
C12H20O4, C12H20O4 |
8.523 | 4.50 |
| 2 | 1,2-Benzenedicarboxylic acid, bis(2-methylpropyl) ester,
Phthalic acid, butyl isohexyl ester, Phthalic acid, isobutyl nonyl ester |
C16H22O4,
C18H26O4, C21H32O4 |
12.118 | 55.31 |
| 3 | n-Hexadecanoic acid
n-Hexadecanoic acid Pentadecanoic acid |
C16H32O2,
C16H32O2, C15H30O2 |
13.095 | 12.47 |
| 4 | Eicosyl isopropyl ether
Octadecane, 3-ethyl-5-(2-ethylbutyl)- Carbonic acid, tetradecyl vinyl ester |
C23H48O,
C26H54, C17H32O3 |
17.725 | 9.26 |
| 5 | Sulfurous acid, butyl tetradecyl ester,
Tetratetracontane, 2-Methyltetracosane |
C18H38O3S,
C44H90, C25H52 |
18.502 | 6.66 |
| 6 | Eicosane,
Eicosane, 2-Methylhexacosane |
C20H42,
C20H42, C27H56 |
19.239 | 6.25 |
| 7 | 1,3-Benzenedicarboxylic acid, bis(2-ethylhexyl) ester,
1,4-Benzenedicarboxylic acid, bis(2-ethylhexyl) ester, Terephthalic acid, di(4-octyl) ester |
C24H38O4,
C24H38O4, C24H38O4 |
19.628 | 5.54 |
Key: PK = Peak number, RT = Retention time
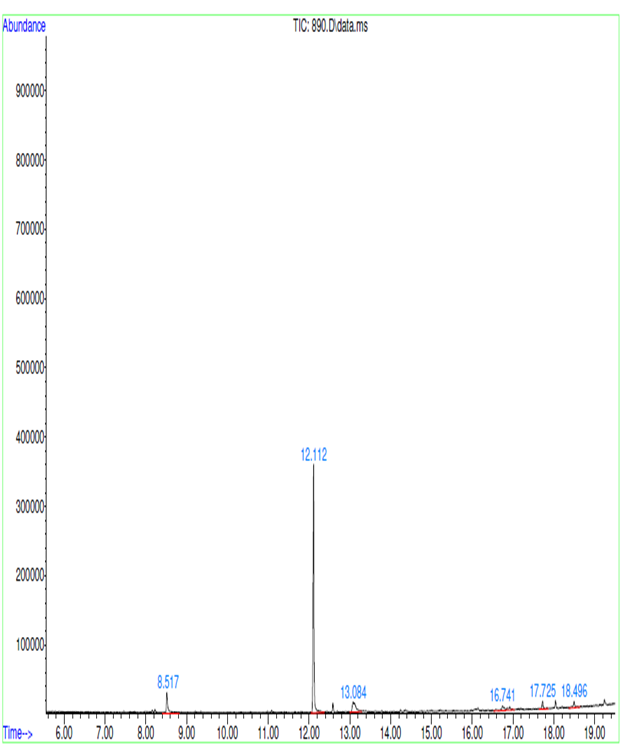
Figure 4: Chromatogram of the crude oil-contaminated water sample collected along the Escravos River of Jones Creek Oil Field
Table 4: Hydrocarbons Identified in Crude oil contaminated water sample collected along the Escravos River of Jones Creek Oil Field
| PK | COMPOUND | FORMULA | RT (mins) | AREA (%) |
| 1 | 2-Butenedioic acid (Z)-, dibutyl ester,
2-Butenedioic acid (Z)-, dibutyl ester, 2-Butenedioic acid, dibutyl ester |
C12H20O4,
C12H20O4, C12H20O4 |
8.517 | 8.77 |
| 2 | 1,2-Benzenedicarboxylic acid, bis(2-methylpropyl) ester,
Phthalic acid, butyl isohexyl ester, 1,2-Benzenedicarboxylic acid, bis(2-methylpropyl) ester |
C16H22O4,
C18H26O4, C16H22O4 |
12.112 | 67.76 |
| 3 | 2-Hydroxy-3,5,5-trimethyl-cyclohex-2-enone,
2-Decene, 3-methyl-, (Z)-, 1,9-Diazaspiro (4,4) nonane-2,8-dion |
C9H14O2,
C11H22, C7H10N2O2 |
13.084 | 10.06 |
| 4 | 9-Octadecenamide, (Z)-,
13-Docosenamide, (Z)-, Tetradecanamide |
C18H35NO,
C22H43NO, C14H29NO |
16.741 | 6.75 |
| 5 | Sulfurous acid, 2-propyl tetradecyl ester,
Octadecane, 1-chloro-, Carbonic acid, decyl tetradecyl ester |
C17H36O3S,
C18H37Cl, C25H50O3 |
17.724 | 3.07 |
| 6 | Carbonic acid, decyl undecyl ester,
2-Methylhexacosane, 2-Methyltetracosane |
C25H50O3,
C27H56, C25H52 |
18.496 | 3.58 |
Key: PK = Peak number, RT = Retention time
Heavy metal contents of the water samples
Table 5 shows the findings of the heavy metal concentration analyses conducted on the water samples. In every water sample examined, the amounts of zinc (Zn), copper (Cu), vanadium (V), nickel (Ni), manganese (Mn), and mercury (Hg) were below the detection thresholds. All three (3) water samples that were analyzed had lead (Pb) concentrations that were higher than the surface water limits established by SON (2007) and WHO (2012). The mean concentrations of Pb were 0.21±0.01, 0.11±0.01, and 0.37±0.00 mg/L for the water samples that were taken from Kokodiagbene, Akpata Egbebe, and the Escravos River, respectively. The recommended limit of 0.003 mg/L for cadmium was exceeded by 0.01±0.00 mg/L in the water samples from Akpata Egbebe, while the remaining samples had amounts below this limit. The Kokodiagbene water samples had concentrations of arsenic (As) and chromium (Cr) of 0.06±0.00 and 0.13±0.00 mg/L, respectively. These values were greater above the allowed limits of 0.01 and 0.05 mg/L for these elements in surface water. Nevertheless, water samples from the Escravos River and Akpata Egbebe showed lower than allowed levels of these heavy metals. The concentration of Iron (Fe) in water samples from the Escravos River and Kokodiagbene were 0.66±0.01 and 0.31±0.01 mg/L, above WHO permissible limits, while sample from Akpata Egbebe had level within the acceptable limits.
Table 5: Heavy Metal Contents of water samples collected from communities of Jones Creek Oil Field
| Water Samples | |||||
| Heavy metals (mg/L) | A | B | C | WHO | FEPA/SON Stds |
| Vanadium | 0.00±0.00 | 0.00±0.00 | 0.00±0.00 | NS | NS |
| Arsenic | 0.06±0.00 | 0.00±0.00 | 0.00±0.00 | 0.01 | 0.01 |
| Lead | 0.21±0.01 | 0.11±0.01 | 0.37±0.00 | 0.01 | 0.05 |
| Chromium | 0.13±0.00 | 0.00±0.00 | 0.00±0.00 | 0.05 | 0.05 |
| Copper | 0.24±0.01 | 0.03±0.00 | 0.02±0.00 | 1.0 | 1.0 |
| Manganese | 0.00±0.00 | 0.00±0.00 | 0.02±0.00 | 0.1 | 0.2 |
| Zinc | 0.16±0.02 | 0.30±0.00 | 0.07±0.01 | 3.00 | 3.00 |
| Iron | 0.31±0.01 | 0.16±0.02 | 0.66±0.01 | 0.30 | 0.30 |
| Nickel | 0.01±0.00 | 0.01±0.00 | 0.00±0.00 | 0.02 | 0.02 |
| Cadmium | 0.00±0.00 | 0.01±0.00 | 0.00±0.00 | 0.003 | 0.01 |
| Mercury | 0.00±0.00 | 0.00±0.00 | 0.00±0.00 | 0.001 | 0.001 |
Values are expressed in mean ± standard error of mean of triplicate determination. Values with different superscript on the same column are significantly different at p<0.05.
KEY; A = River water from Kokodiagbene, B = River water from Akpata Egbebe, C = water sample collected along the Escravos River (Control), FEPA = Federal Environmental Protection Agency, Std = Standard, WHO= World Health Organization, SON= Standard Organization of Nigeria, NS =Not stated, mg/L = Milligram per litre.
DISCUSSION
The average EC levels found in the water sample from the Jones Creek settlements were largely higher than the WHO (2012) and FEPA (2007) allowable limits of 500 and 1000 μs/cm, respectively. The ability of water to conduct electricity is measured by its electrical conductivity. It calculates the ionic content of a solution and the total amount of solid dissolved in water (Edori et al., 2020). There could have been a high concentration of soluble salts and heavy metals in the river due to the high conductivity values of the water samples. Iyeritei et al. (2022) obtained similar results from Lobia Creek in the Niger Delta.
The presence of cations in water, especially calcium and magnesium cations, is what causes water hardness (Edeki et al., 2023). Water hardness is not regulated by any health-based guidelines, however concentrations higher than 200 mg/L can cause scale buildup in distribution systems, excessive soap use, and scum development (Iwegbue et al., 2023). The mentioned hardness may be attributed to the presence of certain minerals and heavy metals within them. This supports the findings of Sam et al. (2023), Eyankware et al. (2020), and Afonne et al. (2020) and would cause equipment to accumulate minerals, scale form on boilers, and poor lather creation.
Total dissolved solid (TDS) is a measurement of inorganic salts, organic matter, and other dissolved materials in a typical aquatic environment. In general, the concentration of TDS is proportionate to the level of pollution (Isreal et al., 2019). (Edori, 2020). The quality of the infiltrating water as well as the geological materials the water flows through determine the concentration of TDS in river water (Iwegbue et al., 2023). The TDS values of every water sample used in this investigation are consistent with those reported by Abbey et al. (2021), who pointed out that high dissolved solids concentrations have the tendency to raise water density, decrease gas solubility, and interfere with aquatic species’ ability to regulate their osmoregulation. Water hardness is a function of total dissolved solids, which in natural water are primarily carbonates, calcium, magnesium, potassium, and sodium sulfates. The electrical conductivity of the water increases with increasing TDS levels.
Fish and other aquatic species depend on dissolved oxygen (DO) to survive, and it is a crucial component of biological processes as well as one of the most essential markers of high water quality (Sam et al., 2023). For example, drinking water with high DO levels may taste better than in locations with lower DO levels, but it can also harm industrial components, such as water pipe corrosion. The current study’s measured DO concentrations exceeded the relevant authorities’ standard requirement of 14 mg/L (WHO and SON). Nonetheless, in order for aquatic species to survive and thrive in any aquatic habitat, the level must be at least 5.0–6.0 mg/L. The DO levels found in this study differ from those found by Edori (2020), who found that the value range in Ede Onyima Creek, Okarki-Engenni, Rivers State, was 5.33 to 5.56 mg/L.
The increased COD value found in the research area is indicative of pollution brought on by oil spills and human impact. This kind of anthropogenic activity frequently introduces oxidizable organic and inorganic contaminants into aquatic environments. Comparable findings have been published by Jonah et al. (2020) from the upper Qua Iboe River, Akwa Ibom State, Nigeria, and Okoro and Diejomaoh (2022) on surface water surrounding Odeama Community in the Niger Delta region of Nigeria.
The water samples were acidic, as shown by the pH values. The increase in acidic precipitate brought on by garbage disposal and oil spills into the local water bodies may be the cause of the acidity (Edeki et al., 2023). The water samples’ nitrate concentration is under the WHO’s allowed limit of 50 mg/L (WHO, 2012). The low levels may be the result of almost no agricultural activity in the areas under study. Comparably, Sam et al. (2023) ‘s study on the assessment of water quality using a pollution model and a water quality index in a few localities in Gbaramatu Kingdom, Niger Delta, Nigeria, found low nitrate concentrations in the range of 0.37 to 0.92 mg/L. However, in a comparable setting, the observed values of the current work were lower than those of other authors (Odesiri-Eruteyan et al., 2017; Edori and Nna, 2018; Friday et al., 2020). Reduced oxygen levels in water, eutrophication, blue baby syndrome in children (caused by nitrite and iron reacting with red blood cells to form methemoglobin, which lowers oxygen levels), and miscarriages in expectant mothers are among the consequences of elevated nitrates in water (Isreal et al., 2019; Edori et al., 2020).
There were noticeable differences in TPH between the several communities in Jones Creek. This unequivocally shows that human activity was the cause of the pollution. Hydrocarbons in the marine environment are a result of anthropogenic processes such burning fossil fuels, oil refineries and plants, urban garbage, and industrial operations (Ihunwo et al., 2021).The illegal bunkering occurring in this region and commercial operations like speed boat fishing, whose engines may be leaking engine or lubricating oil into the river, could be the cause of the elevated TPH concentrations found in Jones Creek. The research area’s increased TPH concentration may possibly be explained by inadequate cleanup following an oil spill, as this creek receives sewage from nearby oil corporations. Because there were fewer commercial and human activity in the communities, Akpata Egbebe and the Escravos River had low TPH concentrations. The TPH values in this study were higher than those found by Edori et al. (2020) in the Edagberi River, which were as low as 5.351±0.145-8.0639±0.806 mg/L, and by Edori and Kpee (2019) in the Taylor Creek, which varied between 2.461±2.687-10.00974.145 mg/L in the stations examined. Additionally, Sari et al. (2018) in an oil field at Wonocolo obtained a value of 211,025.73μg/L above the values observed in this study.
When discovered in water bodies, total petroleum hydrocarbons have harmful impacts. These effects are caused by an oil layer that forms at the surface and coats the water, preventing adequate oxygen diffusion and mixing. This process of low oxygen leads to organism suffocation and asphyxia, which can be fatal. Through penetration or closing of the pores, oil can also obstruct the pore spaces in leaves, impeding photosynthesis and transpiration in plants (Sari et al., 2018; Kpee and Bekee, 2021).
All three (3) water samples that were examined had lead concentrations that were higher than the WHO’s and SON’s 2007 surface water threshold (WHO 2011). The high levels of Total Petroleum Hydrocarbon (TPH) resulting from illegal refinery waste products (illegal bunkering activities which can elevate the concentration of lead in aquatic systems) and the careless dumping of waste into rivers are responsible for the aggravated lead concentration in the study area (Okoro and Diejomaoh, 2022). Due to the potential health risks, this data indicates that surface water with Pb concentrations in this range should not be used for residential purposes. The high concentration of lead can also be linked to the deterioration of old jetties and embankment pipes, the use of lead as weights for fishing nets and household garbage, and paints used on boats and buildings. The findings complemented those of reports from Nigeria’s Niger Delta’s Bomadi Creek (Iwegbue et al., 2023). Lead does not readily dissolve in the environment, but it can combine with dust or soil particles to enter groundwater or drinking water through runoff from surface and subsurface water. High amounts are released as a result of anthropogenic activities like oil exploration, burning fossil fuels, and other industrial processes that create environmental spills (Muhammad et al., 2020). Eating food grown in high-lead soil, drinking tainted water, and breathing polluted air can all expose one to lead (Ikhumetse et al., 2019; Abbey et al., 2021).
In this investigation, the levels of cadmium (Cd) found in some sample communities were higher than the 0.003 mg/L regulation limit. Although the exploration and extraction of hydrocarbons is a major source of cadmium, other factors that contribute to water bodies’ cadmium levels include the disposal of mixed wastes that include batteries and electronic waste as well as paints, pigments, and phosphate fertilizers (Ofodile et al., 2023). The area’s oil exploration activities may be the cause of the high cadmium amounts seen in some of the water samples. In the Niger Delta of Nigeria, high levels of Cd have been recorded in Bomadi Creek (Iwegbue et al., 2023) and in a few communities in Gbaramatu Kingdom (Niger Delta, Nigeria) (Sam et al., 2023). These levels surpass the WHO regulatory limit. Water borne cadmium bioaccumulates and is hazardous to both humans and aquatic life. It affects the endocrine system and behavior of fish, which may have an effect on fish population growth and spawning (Ikhumetse et al., 2019; Olu et al., 2019).
Almost all environmental matrices contain arsenic (As), which is a ubiquitous element (Muhammad et al., 2020). The ecosystem and people are negatively impacted by high levels of arsenic in water. Research have revealed that numerous malignancies are linked to excessive consumption and accumulation of arsenic due to the metal’s indigestion through drinking water, despite arsenic’s negligible impact on the human body’s metabolic system (Membere and Abdulwasiu, 2020).
High chromium concentrations in Kokodiagbene is a sign of human-caused contamination. The high levels found could be the result of oil spills in marshy and crude oil-contaminated areas, as well as corrosion from chromium-plated boats left in the water. In the Warri Southwest Local Government Area of Delta State, Nigeria, Mohammad et al. (2020) reported similar results of 0.283 ± 0.034 mg/L along the Escravos River. They stated that the high concentrations of heavy metals could be attributed to the sample source because the samples were taken directly from sources contaminated with crude oil along the Escravos river bank.
The findings additionally demonstrated that the surface water included the C30 quantity. Edori et al. (2020) noted a similar observation and suggested that the compound’s hydrophilic nature might be the cause of its occurrence. Additionally, Edori et al. (2020) speculate that the presence of C10, C11, C22, C28, and C30 in the water may be related to flow disturbances and the river itself. Similar to the results described by Sharma et al. (2020), cyclic chemicals such as derivatives of naphthalene, phenanthrene, phenol, and annulene were also found in the water sample. As stated by Alnuaimi et al. (2020), these substances are extremely poisonous, mutagenic, and carcinogenic to people and other living things.
CONCLUSION
The physicochemical parameters of the surface water from Jones Creek revealed that some parameters, like pH, turbidity, nitrates, sulphates, calcium, potassium, BOD5, and phosphates, were within acceptable limits, but conductivity, total hardness, chlorides, TDS, COD, and DO were higher than the recommended limit for surface water by WHO and FEPA. The river water is harmful for residential use and eating since it contains heavy metals like Pb, Cd, As, and Cr in excess of what is permitted. Using GC/MS, the entire petroleum hydrocarbon composition of the surface water from Jones Creek was ascertained and reported for the first time. Our research has shown that the river has been contaminated by crude oil. The area’s operations related to oil extraction and exploitation resulted in the total petroleum hydrocarbons that contaminated the river.
RECOMMENDATIONS;
- The river therefore requires appropriate supervisory procedures to be performed in order to satisfy the requisite fitness for both human, industrial, and aquatic activities because some of the parameters are not up to standard for human use. In addition, a public awareness campaign must to be launched to inform the local population about the health risks associated with waste that is directly dumped into rivers.
- The effectiveness of mitigation and remediation initiatives depends on ensuring the active participation and empowerment of local people in decision-making processes pertaining to oil production and waste management. The implementation of community-based monitoring and response systems, capacity building, and participatory planning can all help achieve this.
- Enhanced cooperation and coordination between the Department of Petroleum Resources (DPR), National Environmental Standards and Regulations Enforcement Agency (NESREA), National Oil Spill Detection and Response Agency (NOSDRA), the Nigerian Navy, and other regulatory bodies should be reinforced. This can improve the efficacy of efforts to detect, respond to, and clean up oil spills. Joint training initiatives, information exchange, and the creation of integrated monitoring and response systems can all help achieve this.
- In order to prevent harmful health issues, oil fingerprinting should be used to identify the sources of pollution and provide affordable remedial procedures.
REFERENCES
- Abbey, D.M., Abbey, M.E., Ogunyemi, T.C. & Abbey, M.E. (2021). Pollution evaluation based on physicochemical and heavy metal levels of Miniokoro Stream, Port Harcourt, Nigeria. Asian Journal of Chemical Sciences, 9(2), 27-37.
- Afonne, O.J., Chukwuka, J.U. & Ifediba, E.C. (2020). Evaluation of drinking water quality using heavy metal pollution indexing models in an agrarian, non-industrialised area of South-East Nigeria. Journal of Environmental Science and Health Part A, 55(12), 1406-1414.
- Alnuaimi, M.T., Taher, T.A., Aljanabi, Z.Z. & Adel, M.M. (2020). High-resolution GC/MS study of biodegradation of crude oil by Bacillus megaterium. Research on Crops, 21 (3), 650-657.
- American Public Health Association, APHA (2017). Standard methods for examination of water and waste water, 23rd edition. American Public Health Association, Washington, DC.
- Bacosa, H.P., Erdner, D.L. & Liu, Z. (2015). Differentiating the roles of photooxidation and biodegradation in the weathering of light Louisiana sweet crude oil in surface water from the deep water horizon site. Marine Pollution Bulletin, 95(1), 265-272.
- Bilewu, O.F., Ayanda, I.O. & Ajayi, T.O. (2022). Assessment of physicochemical parameters in selected water bodies in Oyo and Lagos States. IOP Conference Series: Earth and Environmental Science, 1054, 012045-012053.
- Department of Petroleum Resources (DPR), (2011). Environmental guidelines and standards for the petroleum industry in Nigeria (EGASPIN). Revised Edition. Universal Press, Lagos, Nigeria; 276-297.
- Edeki, P.E., Isaha, E.C. & Mokogwua, N. (2023). Assessment of physicochemical and bacteriological quality of drinking water in Sapele Local Government Area of Delta State, South-South, Nigeria. Journal of Water and Health, 21(2), 286-298.
- Edori, O.S & Nna, P.J. (2018). Determination of physicochemical parameters of effluents at discharge points into the New Calabar River along Rumuolumeni axis, Niger Delta, Nigeria. Journal of Environmental and Analytical Toxicology, 8(3), 132-157.
- Edori, E.S. & Kpee, F. (2019). Total Petroleum Hydrocarbon concentration in Surface water from Taylor Creek, Rivers State, Nigeria. Chemistry Research Journal, 4(5), 1-8.
- Edori, O.S. (2020). Physical and chemical characteristics of water from Ede Onyima Creek, Okarki-Engenni, Rivers State, Nigeria. Chemistry Research Journal, (3), 144-154.
- Edori, E.S., Kpee, F. & Marcus, A.C. (2020). Total petroleum hydrocarbon fractions (Components) in surface water and sediments of Edagberi River, Niger Delta, Nigeria. International Journal of Research and Innovation in Applied Science (IJRIAS), 5(10), 1-8.
- Edori, E.S., Edori, O.S. & Bekee, D. (2021). Total petroleum hydrocarbons contamination of the surface water and sediments of orashi river, Engenni, Ahoada West, Rivers State, Nigeria. Asian Review of Environmental and Earth Sciences, 8(1), 68-76.
- El-Borai, A.M., Eltayeb, K.M., Mostafa, A.R. & El-Assar, S.A. (2016). Biodegradation of industrial oil-polluted wastewater in Egypt by bacterial consortium immobilized in different types of carriers. Pollution Journal of Environmental Studies, 25(5), 1901-1909.
- Eyankware, M.O., Aleke, C.G., Selemo, A.O.I. & Nnabo, P.N. (2020). Hydrogeochemical studies and suitability assessment of groundwater quality for irrigation at Warri and environs, Niger Delta basin, Nigeria. Groundwater for Sustainable Development, 10(2020), 100293.
- Eze, V.C., Onwuakor C.E. & Orok F.E. (2014). Microbiological and physicochemical characteristics of soil contaminated with used petroleum products in Umuahia, Abia State, Nigeria. Journal of Applied & Environmental Microbiology, 2(6), 281-286.
- Federal Environmental Protection Agency (FEPA), (2003). Guidelines and standards for environmental pollution control in Nigeria, 420.
- Friday, K., Edori, O.S. & Nwokanma, V.C. (2020). Assessment of physicochemical parameters in Nta-Wogba stream in Port Harcourt, Rivers State, Nigeria. Journal of Scientific and Engineering Research, 7(8), 124-132.
- Gupte, A. & Sonawdekar, S. (2015). Study of oil degrading bacteria isolated from oil contaminated sites. International Journal for Research in Applied Science & Engineering Technology, 3(2), 345-349.
- Ihunwo, O.C., Onyema, M.O., Wekpe, V.O., Okocha, C., Shahabinia, A.R., Emmanuel, L., Okwe, V.N., Lawson, C.B., Mmoma, P.C., Dibofori- Orji, A.N. & Bonnail, E. (2021). Ecological and human health risk assessment of total petroleum hydrocarbons in surface water and sediment from Woji Creek in the Niger Delta estuary of Rivers State, Nigeria. Heliyon. 7, 1-14.
- Ikhumetse, A.A., Abioye, O.P., & Aransiola, S.A. (2019). Biosorption potential of bacteria on lead and chromium in groundwater obtained from mining community. Acta Scientific Microbiology 2(6), 123-137.
- Ikhumetse, A.A., Abioye, O.P., Ijah, U.J.J. & Bankole, M.T. (2022). A critical review of oil spills in the Niger Delta aquatic environment: causes, impacts, and bioremediation assessment. Environmental Monitoring and Assessment, 22; 194(11):816.
- Israel, A.I., Etim, I. & Etim, O.V. (2019). Effects of gas flaring on surface water in Mkpanak community of Akwa Ibom State, Nigeria. International Journal of Engineering Research & Technology (IJERT), 8(9), 566-573.
- Iwegbue, C.M.A., Faran, T.K., Iniaghe, P.O., Ikpefan, J.O., Tesi, G.O., Nwajei, G.E. & Martincigh, B.S. (2023). Water quality of Bomadi Creek in the Niger Delta of Nigeria: assessment of some physicochemical properties, metal concentrations, and water quality index. Applied Water Science, 13(36), 1-15.
- Iyeritei, F., Obire, O. & Douglas, S.I. (2022). An evaluation of the physicochemical quality of Lobia Creek in the Niger Delta. International Journal of Current Microbiology and Applied Sciences, 11(06), 224-237.
- Jonah, U.E., Iwok, E.S. & Hanson, H.E. (2020). Impact assessment of coastal activities on water quality of upper segment of Qua Iboe River, Akwa Ibom State, South-South, Nigeria. Journal of Applied Science Environment Management, 24(7), 1217-1222.
- Kpee, F. & Bekee, D. (2021). Determination of total petroleum hydrocarbons levels in the water and sediments of Kolo Creek, Niger Delta Nigeria. Chemistry Research Journal, 6(1), 77-88.
- Maxwell, O.I., Onyebuchukwu, M.G., Chinonso, O.E., Nnaemeka, I.C. and Afamefuna, E.K. (2023) Kinetics of bioremediation of oil contaminated-water dispersed by environment-friendly bacteria (Pseudomonas aeruginosa) and fungi (Aspergillus niger). Advances in Chemical Engineering and Science, 13, 19-35.
- Membere, E. & Abdulwasiu, M. (2020). Heavy metals concentration in water, sediment, and Fish around Escravos River, Nigeria. World Journal of Research and Review (WJRR), 10(2), 28-37.
- Muhammad, S.A., Magaji, M.B. & Idris, M.A. (2020). Assessment of physicochemical parameters in crude oil contaminated water samples of three communities of Ikpokpo, Atanba, and Okpele-Ama of Gbaramatu Kingdom, along the Escravos River in Warri South West Local Government Area of Delta State, Nigeria. International Journal of Environment and Pollution Research, 8(1), 57-76.
- Odesiri-Eruteyan, E., Obukohwo, F., Uhribo, V. & Asibor, G. (2017). Assessment of the impacts of refinery effluent on the physico-chemical properties of Ubeji Creek, Delta State, Nigeria. Journal of Environmental Analytical Toxicology, 7(428), 1-6.
- Offodile, P.O., Nwankwoala, H.O., Onwualu-John, J.N. & Osayande A.D. (2023). Water quality assessment and pollution indices in Port Harcourt, Southern Nigeria. World Journal of Engineering Research and Technology, 9(1), 72-83.
- Ogbuneke, C.C. & Ezeibeanu, A.P. (2020). Comparative assessment of trace and heavy metals in available drinking water from different sources in the centre of Lagos and off town (Ikorodu LGA) of Lagos State, Nigeria. Advanced Journal of Chemistry-Section A, 3(1), 94-104.
- Okoro, D. & Diejomaoh, L.C. (2022). Profiling the surface water around Odeama Community of the Niger Delta area of Nigeria. Journal of Environmental Chemistry and Ecotoxicology, 14(1), 9-25.
- Olu, U., Ugbomeh, A.P., Bob-Manuel, K.N.O. & Ekweozor, I.K.E. (2019). Levels of selected heavy metals in water and sediment of the Soku oil field area of the Niger Delta, Nigeria. Journal of Aquatic Pollution and Toxicology, 3(1:25), 1-9.
- Raed, S.A. & Shimaa, R.H. (2014). Bacterial biodegradation of crude oil using local isolates. International Journal of Bacteriology, 2014, 1-8.
- Sam, K., Onyena, A.P., Eriegha, O.J. & Eze, F. (2023). Water quality evaluation using water quality index and pollution model in selected communities in Gbaramatu Kingdom, Niger Delta, Nigeria. African Journal of Environmental Science and Technology, 17(6), 118-134.
- Sarfo, M.K., Gyasi, S.F., Kabo-Bah, A.T., Adu, B., Mohktar, Q., Appiah, A.S. & Serfor-Armah, Y. (2023). Isolation and characterization of crude-oil-dependent bacteria from the coast of Ghana using oxford nanopore sequencing. Heliyon, 9, 1-13.
- Sari, G.L., Trihadiningrum, Y. & Ni’matuzahroh, T. (2018). Petroleum hydrocarbon pollution in soil and surface water by public oil fields in Wonocolo Sub-district, Indonesia. Journal of Ecological Engineering, 19(2), 184-193.
- Sayed, K., Baloo, L. & Sharma, N.K. (2021). Bioremediation of total petroleum hydrocarbons (TPH) by bioaugmentation and bostimulation in water with floating oil spill containment booms as bioreactor basin. International Journal of Environmental Research and Public Health, 18, 2226-2252.
- Sharma, K., Kalita, S., Sarma, N.S. & Devi, A. (2020). Treatment of crude oil contaminated wastewater via an electrochemical reaction. RSC Advances, 10, 1925–1936.
- Standards Organization of Nigeria (SON) (2007). Nigerian industrial standard: Nigerian standard for drinking water quality, Abuja.
- Ugbe, F.C. (2012). Environmental groundwater monitoring of Jones Creek Field, Niger Delta, Nigeria. Research Journal of Environmental and Earth Sciences, 4(5), 570-575.
- Umeojiakor, C.T., Ojiabo, K.T., Umeojiakor, A.O., Anyikwa S.O. & Nwanwe C.C. (2019). Effectiveness of biostimulants amendment with indigenous microbes on bioremediation of crude oil contaminated soil in Niger Delta region of Nigeria. International Journal of Engineering Research & Technology, 8(11), 751-755.
- World Health Organization, & WHO. (2011). Guidelines for drinking-water quality (4th ed.). Geneva.
- World Health Organization, WHO (2012). Guidelines for Standard Operating Procedures for Microbiology: In Bacteriological Examination of Water. World Health Organization Regional Office for South-East Asia. 115-126.