Exploring the Relationship Between SNAP Spending, Per-Capita Food Expenses, and Poverty Rates in The United States: A State-level Analysis
- Esther Rukewve Samuel
- Ayowole Samuel Ajiboye
- 213-220
- Jun 7, 2024
- Economics
Exploring the Relationship Between SNAP Spending, Per-Capita Food Expenses, and Poverty Rates in The United States: A State-level Analysis
Esther Rukewve Samuel1*, Ayowole Samuel Ajiboye2
1Department of Mathematics, Applied Mathematics and Statistics, Case Western Reserve
University
2Department of Social Work, Mandel School of Applied Social Sciences, Case Western Reserve University
*Corresponding Author
DOI: https://doi.org/10.51584/IJRIAS.2024.905019
Received: 27 April 24; Revised: 06 May 2024; Accepted: 10 May 2024; Published: 07 June 2024
ABSTRACT
This paper examines the complex interplay between Supplemental Nutrition Assistance Program (SNAP) spending, per-capita food expenses, poverty rates, and participation trends across U.S. states from 2009 to 2022. Utilizing state-level data obtained from the USDA, Economic Research Service; using data from the State food expenditure series, and the Federal Reserve Bank of St. Louis and others, which were analyzed using R programming. We observed a positive linear regression between SNAP spending and per-capita food expenses over the 14 years, suggesting that changes in SNAP funding consistently influence food expenditure patterns. However, outliers such as New Hampshire, Idaho, and Kentucky exhibit notable correlations between SNAP spending and poverty rates. Moreover, analysis of SNAP participation trends reveals a peak in 2013 followed by a decline until 2019, with a subsequent resurgence from 2020 to 2021 and a slight decrease in 2022. Notably, the top 10 U.S. states demonstrate a general upward trend in per-capita SNAP benefits from 2019 to 2022, with Florida being the sole outlier experiencing a decline in 2022. These findings prompt a deeper exploration into the efficacy of the SNAP program in addressing food insecurity and poverty across diverse state contexts, suggesting potential areas for further research and policy intervention.
Keywords: Supplemental Nutrition Assistance Program (SNAP), Per-capita food expenses, Poverty rates, Participation trends, Food insecurity, Policy intervention
INTRODUCTION
Food insecurity is a societal challenge that requires decisive action from policymakers. As defined by the United States Department of Agriculture (USDA, 2023), food insecurity refers to inconsistent access to an adequate food supply for maintaining an active and healthy lifestyle. Food insecurity is a widespread issue that creates suffering for individuals, families, and communities across the United States. The USDA identified that “12.8 percent of U.S. households were food insecure at some time during 2022.” That translates to roughly 17 million households struggling to acquire enough food to meet the needs of all their members. There are a variety of factors that influence food insecurity such as low income, unemployment, and high living costs. Additionally, financial instability already creates a challenge for affording food, but living in a food desert exacerbates the issue further. Some urban areas, rural areas, and low-income neighborhoods do not have supermarkets nearby.
One of the foremost social initiatives addressing food insecurity is the Supplemental Nutrition Assistance Program, known as SNAP. The primary objective of SNAP is to enhance the food security of its participants and facilitate their access to nutritious diets. This is achieved by providing monthly funds to individuals and families, enabling them to purchase groceries. Eligibility for SNAP is contingent upon household income, with the allocated amount determined based on family size and income level. These funds are disbursed onto an Electronic Benefits Card (EBT), functioning akin to a debit card, and can be utilized at various outlets including grocery stores, convenience stores, online delivery services, and farmers’ markets. SNAP has played a pivotal role in significantly mitigating hunger in the United States, benefiting nearly 40 million Americans each month (Keith-Jennings et al., 2019). The program serves as a crucial support system for vulnerable populations affected by food insecurity, with approximately 90% of recipients belonging to families with children, elderly individuals, or those with disabilities (Keith-Jennings et al., 2019). SNAP aims to bolster food security, enhance health and nutrition, alleviate poverty, and foster social equity.
The demand for SNAP has experienced substantial growth since its inception as Food Stamps. Back in 1969, the average household participation stood at 2,878. Since then, participation rates have surged, reaching an average of 41.9 million in 2022 (United States Department of Agriculture, 2023). Alongside this significant increase in participation, there has been a dramatic rise in federal spending on SNAP. Total SNAP benefits escalated from $228.80 million in 1969 to $118,224.20 million in 2022 (Desilver, 2023). These funds directly contributed to supporting families and households, excluding additional expenses such as administrative fees.
While considerable research has been conducted on the relationship between Supplemental Nutrition Assistance Program (SNAP) spending and various socioeconomic factors, including food expenses and poverty rates, there remains a need for a more nuanced understanding of how these variables interact at the state level. Specifically, the paper aims to explore the complex dynamics between SNAP spending, per-capita food expenses, and poverty rates across U.S. states from 2009 to 2022.
Objectives
- To examine the relationship between per-capita SNAP spending and per-capita food expenses across U.S. states from 2009 to 2022.
- To investigate the correlation between SNAP spending and poverty rates at the state level over the same period.
- To assess the trends in SNAP participation across U.S. states from 2009 to 2022 and analyze how they relate to changes in SNAP allocation and poverty rates.
- To explore the effectiveness of SNAP in addressing food insecurity and poverty within diverse state contexts based on observed correlations and trends.
Significance of study
The research sheds light on the significant role SNAP plays in addressing food insecurity and poverty. By analyzing data over a 14-year period, it demonstrates how variations in SNAP spending correlate with changes in poverty rates, indicating the program’s effectiveness in influencing socioeconomic dynamics. The study also provides insights into the complex dynamics at the state level. By examining variations across different states, including outliers like New Hampshire, Idaho, and Kentucky, it underscores the need for tailored approaches to address unique socioeconomic factors and policy implementations within each state.
Furthermore, the findings have implications for policymakers, highlighting the importance of continued support and investment in SNAP. Recognizing the relationship between SNAP allocation and poverty rates underscores the need for targeted policy interventions and resource allocation strategies to enhance the program’s efficacy in combating food insecurity and poverty nationwide.
Overall, this study contributes valuable insights into the effectiveness of SNAP in addressing food insecurity and poverty in the United States, providing a foundation for evidence-based policymaking and interventions to promote social equity and well-being.
MATERIALS AND METHOD
For this study, Data were obtained from different sources and these include; food expenditure data from the USDA, Economic Research Service; using data from the state-level food expenditure series, US state population data (Federal Reserve Economic Data) from the Federal Reserve Bank of St. Louis, poverty data from the U.S Census Bureau, current population survey, 1960 – 2023, and SNAP data from Kaggle, US public food assistance 2 – SNAP. These were all analyzed using R programming.
ANALYSIS OF KEY FINDINGS
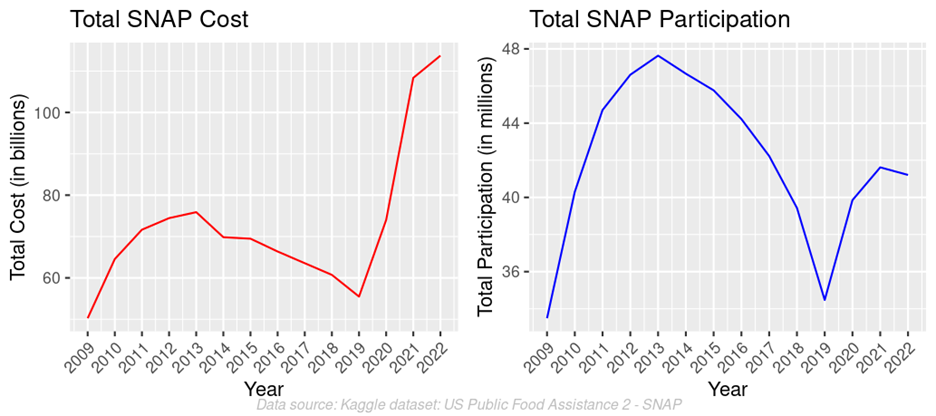
The two graphs below show the variations in SNAP spending and participation between 2009 and 2022 reflecting changes in economic conditions and policy changes within the 14-year study period.
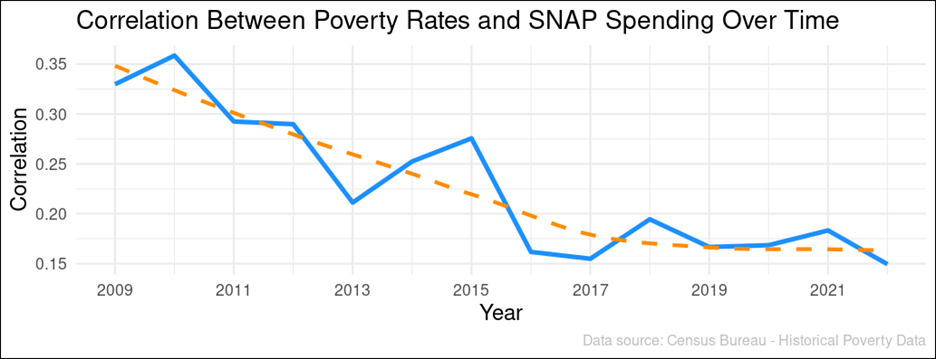
The figure below shows no significant correlation between poverty rates and SNAP spending within the 14-year study for most of the States except for the outliers such as New Hampshire, Idaho, and Kentucky which exhibited notable correlations between SNAP spending and poverty rates. This is best explained by the conventional measurement of poverty in the United States which typically excludes non-cash benefits such as SNAP from the calculation of family income, it’s important however to recognize that households with extremely low incomes often rely more heavily on SNAP benefits to provide them with additional assistance to afford sufficient food due to their severe financial constraints. As noted by (Hartline-Grafton, 2019), more than 9 percent of participating households moved above the federal poverty line when SNAP benefits were included in their gross income, and 10 percent of the lowest-income SNAP households moved out of deep poverty.
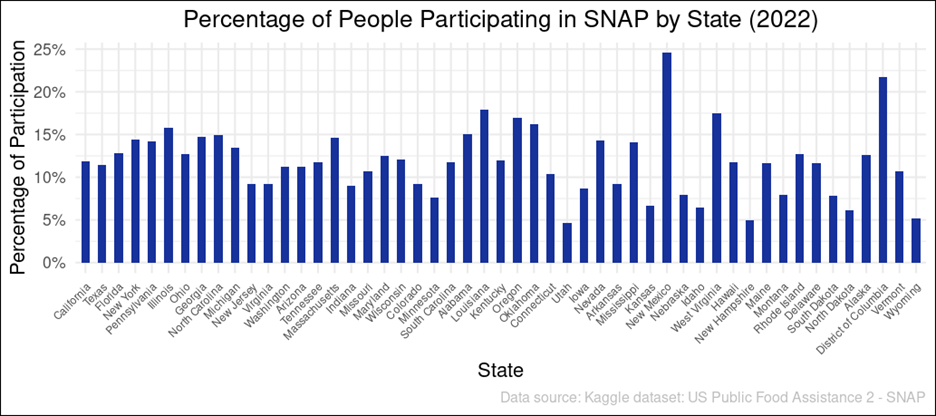
In the below diagram, the States were arranged from highest to lowest in terms of population. The top five states with the highest SNAP participation rates do not belong to the top ten largest states in the US. New Mexico leads with approximately 24.5% participation, while Utah has the lowest participation rate in the US at 4.6%. It can be inferred that population may not be a major determinant of participation in SNAP but other factors such as employment, income and other factors can play a key role. For example, the gross monthly income threshold for eligibility must meet or exceed 130% of the poverty level, while the net monthly income must not surpass 100% of the poverty level (Policy Basics, 2008). Additionally, household assets need to fall below $2500, unless there is a household member aged 60 or above, or with a disability. In such cases, individuals must possess assets totaling less than $3750 (Policy Basics, 2008). To maintain benefits beyond three months, adults aged 18-49 without disabilities are required to work a minimum of 20 hours per week or participate in a job training program (Policy Basics, 2008). Work requirements are determined by state public assistance agencies, and individuals must pass relevant tests pertaining to their employment status to remain eligible for benefits (Aussenberg & Falk, 2023).
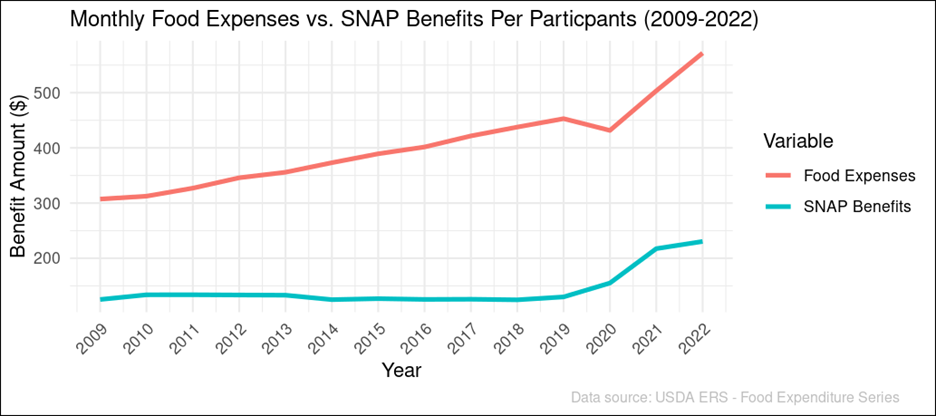
The figure below shows a relationship between monthly food expenses and SNAP benefits. Overall, SNAP benefits do not significantly reduce food expenses across the States because there is usually a higher rise in the monthly food cost caused by inflation and other economic factors such as demand and supply without a corresponding increase in SNAP benefits. In 2009, SNAP benefits would suffice for approximately 41% of the total cost of a monthly food bill, this reduces over time to 28% in 2019 and increases to 40% in 2022.
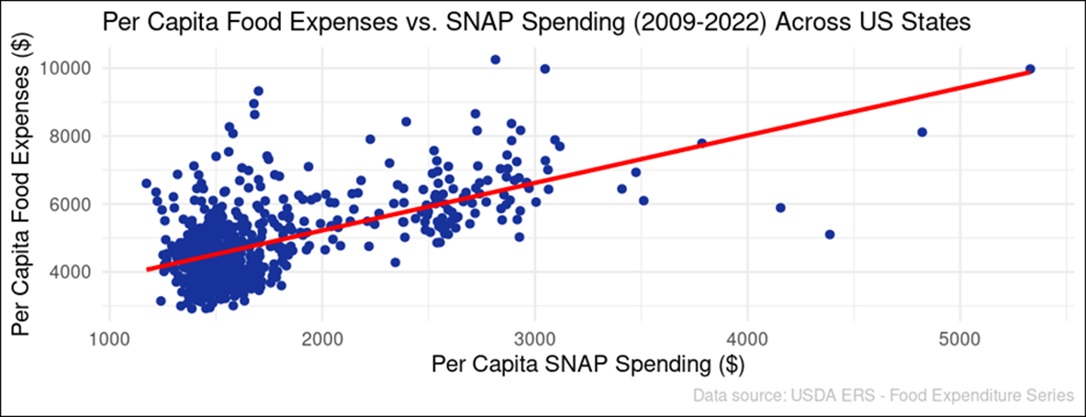
The linear regression graph indicates a positive trend, with per capita food expenses (dependent variable) increasing as per capita SNAP spending (independent variable) rises from 2009 to 2022. This observation suggests a direct correlation between these two variables. In other words, as SNAP spending increases, per capita food expenses also tend to increase. These findings suggest that variations in SNAP funding significantly impact food expenditure patterns on a per capita basis over the specified time frame.
Hypothesis Statement
H0: There is no significant relationship between SNAP Allocation and the poverty rate.
H1: There is a significant relationship between SNAP Allocation and poverty rate.
Contingency Table: SNAP Allocation and Poverty Rate across States in the US.
| Poverty Rate | |||||
| Low | Medium | High | Total | ||
| SNAP Allocation | Low | 68 | 242 | 70 | 380 |
| Medium | 17 | 103 | 62 | 182 | |
| High | 11 | 99 | 42 | 152 | |
| Total | 96 | 444 | 174 | 714 | |
Chi-Square Table: Is there a significant relationship between SNAP Allocation and Poverty rate?
| Test statistic | Df | Asymp. Sign. (Two-Sided) | |
| Pearson Chi-square | 26.701 | 4 | 0.000028 |
Since our P value (0.000028) is less than the Alpha value (0.05), therefore we have sufficient reason to reject the null hypothesis (H0).
Hypothesis Statement
H0: There is no significant relationship between per-capital SNAP spending and per capita food expenses.
H1: There is a significant relationship between per-capital SNAP spending and per-capita food expenses.
Contingency Table: Per-capital SNAP spending and Food expenses across States in the US.
| Food Expenses | |||||
| Low | Medium | High | Total | ||
| SNAP Spending | Low | 45 | 94 | 21 | 160 |
| Medium | 98 | 128 | 27 | 253 | |
| High | 57 | 92 | 152 | 301 | |
| Total | 200 | 314 | 200 | 714 | |
The P value is 0.00000000000000022, which is less than the alpha value (0.05). Therefore, we have sufficient reason to reject the null hypothesis (H0).
DISCUSSION AND RESULT
The findings of this study reveal a significant relationship between SNAP allocation and poverty rates across different states in the United States. Through rigorous analysis utilizing state-level data from 2009 to 2022, it becomes evident that variations in SNAP spending correlate with changes in poverty rates, supporting the alternative hypothesis (H1). This suggests that SNAP allocation indeed plays a role in influencing poverty dynamics within states.
The contingency table analysis further strengthens this conclusion, demonstrating a statistically significant association between SNAP allocation levels and poverty rates. The calculated Pearson Chi-square value of 26.701 with a corresponding p-value of 0.000028 indicates that the relationship observed is unlikely to have occurred by chance. Therefore, we reject the null hypothesis (H0) and accept that there is a significant relationship between SNAP allocation and poverty rates.
These findings underscore the crucial role of SNAP in addressing poverty and food insecurity across diverse state contexts. By providing financial assistance to eligible individuals and families, SNAP contributes to alleviating the economic burden experienced by those living in poverty. The positive linear regression observed between SNAP spending and per-capita food expenses further emphasizes the program’s impact on improving access to nutritious diets among low-income households.
Also, there is a significant relationship between per-capita SNAP spending and per-capita food expenses with a p-value of 0.00000000000000022. This finding underscores the substantial impact of SNAP spending on per-capita food expenses over the studied period. It suggests that changes in SNAP funding have a notable influence on the food expenditure patterns of individuals within states. This aligns with the long-term goal of SNAP to enhance food security and facilitate access to nutritious diets among eligible
individuals and families.
However, it is essential to note the presence of outliers such as New Hampshire, Idaho, and Kentucky, which exhibit notable correlations between SNAP spending and poverty rates. Further investigation into the unique socioeconomic factors and policy implementations within these states could provide valuable insights for optimizing SNAP effectiveness.
Moreover, the analysis of SNAP participation trends reveals fluctuations over the study period, with notable peaks and declines. Understanding the factors driving these trends is crucial for assessing the program’s outreach and identifying potential areas for improvement in participation rates.
Overall, this study contributes to the existing literature by providing a comprehensive examination of the relationship between SNAP spending, per-capita food expenses, and poverty rates at the state level. The observed correlations highlight the importance of targeted policy interventions and resource allocation strategies to enhance the efficacy of SNAP in combating food insecurity and poverty nationwide.
LIMITATIONS OF THE STUDY
- SNAP expenditure for each state between 2009 and 2022 encompasses administrative costs of the SNAP program, estimated to comprise approximately 8% of the total expenditure, as indicated by the Center on Budget and Policy Priorities.
- The poverty rate is reported with a margin of error of (±34), allowing for the calculation of upper and lower bounds of the 90% confidence interval by adding or subtracting this margin from the estimate.
- Per capita food expenditure estimates exclusively account for sales and do not include food provided, donated, homegrown, or served within educational institutions.
- The reported monthly state participation in SNAP for fiscal years 2015 to 2022 excludes participation counts for disaster supplements, replacements, and other exceptional circumstances.
CONCLUSION
Based on the analysis conducted, we concluded that there is indeed a significant relationship between SNAP allocation and poverty rates across U.S. states from 2009 to 2022. The rejection of the null hypothesis (H0) indicates that variations in SNAP spending are associated with changes in poverty dynamics, underscoring the program’s impact on addressing socioeconomic disparities.
Also, there is a significant relationship between per-capita SNAP spending and per-capita food expenses. This shows just how much SNAP funding can affect how much individuals spend on food per person during the time under review. It indicates that when SNAP funding changes, it can impact how people in each state budget for food.
These findings emphasize the importance of continued support and investment in SNAP as a vital tool in the fight against food insecurity and poverty in the United States. By addressing the complex interplay between SNAP spending, food expenses, and poverty rates, policymakers can work towards building a more equitable society where all individuals have access to nutritious food and economic security.
In conclusion, this paper contributes valuable insights into the effectiveness of SNAP in addressing food insecurity and poverty in the United States. By understanding the nuances of SNAP participation and its impact on food expenditure patterns and poverty dynamics, policymakers can develop evidence-based strategies to improve the well-being of vulnerable populations and promote social equity.
RECOMMENDATIONS
- Targeted interventions are needed to address disparities observed among states and population groups. Strategies to reduce barriers to access, such as transportation limitations and food deserts, could help ensure equitable distribution of SNAP benefits and support.
- Providing access to employment and training opportunities for SNAP recipients can help improve their economic stability and reduce reliance on public assistance programs in the long term through a collaborative effort between government agencies, employers, and community organizations to facilitate skill development and job placement for SNAP participants.
- There is a need for ongoing monitoring and evaluation of SNAP participation trends, food expenditure patterns, and poverty rates across the states. These are essential for assessing program effectiveness and identifying areas for improvement. Data-driven decision-making can also inform policy adjustments and resource allocations to optimize outcomes.
- Further research into the underlying factors influencing SNAP participation, food expenditure patterns, and poverty dynamics can provide valuable insights for program refinement and innovation. Collaboration between researchers, policymakers, and practitioners is also essential to generate evidence-based solutions to address food insecurity and poverty effectively.
REFERENCES
- Aussenberg, R. A., & Falk, G. (2023). Supplemental Nutrition Assistance Program (SNAP): A Primer on Eligibility and Benefits. Congressional Research Service: Report, 1–25. https://search.ebscohost.com/login.aspx?direct=true&AuthType=shib&db=tsh&AN=173030538&site=eds-live&custid=s8481523
- Desilver, Drew. (2023, July 19). What the data says about food stamps in the U.S. Pew
- Research. https://www.pewresearch.org/short-reads/2023/07/19/what-the-data-says-about-food-stamps-in-the-u-s/
- Hartline-Grafton, Heather. (n.d). New USDA Report Provides Picture of Who Participates in SNAP. frac.org. https://frac.org/blog/new-usda-report-provides-picture-of-who-participates-in-snap
- Keith-Jennings, B., Llobrera, J., & Dean, S. (2019). Links of the Supplemental Nutrition Assistance Program With Food Insecurity, Poverty, and Health: Evidence and Potential. American Journal of Public Health, 109(12), 1636–1640. https://doi.org/10.2105/AJPH.2019.305325
- Policy Basics: The Supplemental Nutrition Assistance Program (SNAP) | Center on Budget and Policy Priorities. (2008, December 17). https://www.cbpp.org/research/policy-basics-the-supplemental-nutrition-assistance-program-snap
- United States Department of Agriculture. (2023). Supplemental Nutrition Assistance
- Program (SNAP). Food and Nutrition Service. https://www.fns.usda.gov/pd/supplemental-nutrition-assistance-program-snap