Computation of Specific Absorption Rate (SAR) Distribution by the Human Eye Due to Mobile Base Station Antennas & Dependency of SAR on Electrical Properties
- M. A. A. Karunarathna
- 338-346
- Aug 9, 2024
- Electronics & Communication
Computation of Specific Absorption Rate (SAR) Distribution by the Human Eye Due to Mobile Base Station Antennas & Dependency of SAR on Electrical Properties
M. A. A. Karunarathna
Department of Electronics, Wayamba University of Sri Lanka
DOI: https://doi.org/10.51584/IJRIAS.2024.907031
Received: 13 July 2024; Revised: 23 July 2024; Accepted: 27 July 2024; Published: 09 August 2024
ABSTRACT
In Sri Lanka, more base stations are being installed in every part of the country. This may cause a potential danger to public health. The amount of electromagnetic energy absorbed by the body is given by the Specific Absorption Rate (SAR) in W/kg. International regulations specify the maximum acceptable SAR value and field density for public safety.
Electric field strengths due to base station antennas are measured in different parts of the country at sites which represent a normally high population during daytime and three frequency bands of 900 MHz, 1800 MHz and 2 GHz are considered. Field strength is measured at 30 locations in main cities in the country. The present exposure levels are found to be below the maximum limits set by the FCC (Federal Communication Commission) guidelines. From among the measured sites, highest is reported at Vavuniya mostly due to the 2 GHz band. Among those five network providers, one particular service provider dominates in all three frequency bands.
The SAR values are calculated by using Finite Difference Time Domain (FDTD) method. The maximum SAR for the eye under worst-case conditions is 0.1491 W/kg was observed from Galle and the highest contribution is due to 2 GHz band.
The human eye at 2500 MHz was considered to observe how the electrical properties of the tissues affect the electromagnetic energy absorption in an organ. When relative permittivity is perturbed in small percentages with conductivity remaining unchanged; the value of the maximum SAR also changes by small values. However both these cases, when the electrical properties are changed, the location of maximum SAR remains unchanged. It is exactly at the center of the eye.
Keywords – Radio Frequency (RF) Radiation, Exposure Quotient, Maximum Permissible Exposure, Electric Field Intensity, Specific Absorption Rate.
INTRODUCTION
The rapid deployment of wireless communication systems such as cellular phones has caused an increased concern for the potential dangers to public health as a result of exposure to electromagnetic waves. Telecommunication towers or base stations (BS) are continuously being erected. An incredible amount of publicity generated in the mass media about ease of access to cellular phones has also caused great concern among people.
The rate at which electromagnetic energy is absorbed by the tissues of the human body is usually quantified by the specific absorption rate or the SAR value. It is a quantity that depends on the tissue mass and the strength of the electromagnetic waves incident on the body as given in equation (1),
![]() (1)
(1)
where E is the root mean square of intensity of electric field at considered point, s and r are the conductivity and mass density of tissue of the human body organ under examination respectively. To avoid adverse health effects, several reputed organizations have adopted exposure guidelines for the general public as well as for RF workers in the course of their regular duties. According to FCC guidelines [1], the safety level of SAR for the general public is 1.6 W/Kg in 1 g of tissue. Several methods have been described in the literature [2] for numerical calculations of rates of electromagnetic energy absorption. The Finite Difference Time Domain or FDTD is the most often used numerical technique to solve the electromagnetic dosimetry problems [3-5]. This paper reports the SAR values calculated for the human eye, using the measured values of the electric field strength in different cities in Sri Lanka and they are compared with the FCC guidelines. The eye is taken for the calculations because it is one of the most sensitive organs in the human body.
Standards also specify the exposure level in terms of the electric field strength, E (V/m), and the power density, S (W/m2). ‘Exposure Quotient’ [6] is a useful dimensionless quantity that expresses the exposure due to electric fields of multiple radio signals at any location as given in equation (2).
![]() (2)
(2)
where Si is the power density and MPE is the maximum permissible exposure of power density at the ith frequency. For safety, the ‘exposure quotient’ must be less than or equal to one.
By using these two factors i.e., “Exposure Quotient” and “SAR”, a particular location can be checked whether it is free of RF hazards or not. By doing this in this study, several spot measurements were taken from 30 major towns in the country with respect to the mobile base station antennas operating three main frequency bands.
1.1 Field Distribution Inside the Body
The electric field intensity at different points that make up the organ under investigation is obtained using the FDTD method. In this method, Maxwell’s equations in the differential form are solved when an incident uniform plane electromagnetic wave propagates through the body as shown in Fig.1. This is carried out in a time-stepped manner until convergence is reached [7-10].
The Maxwell’s time-dependent curl equations are,
![]() (3)
(3)
![]() (4)
(4)
Here E – Electric field strength, H – Magnetic field strength, µ – Permeability of the medium, e – Permittivity of the medium, σ – Conductivity of the medium.
The body under investigation is divided into a large number of small cubic cells of size dx, dy, and dz and the investigation is carried out at ‘dt’ time intervals until steady state is reached.
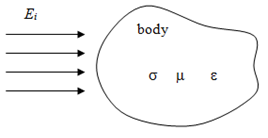
Fig.1. Uniform plane wave incident on the body
The components of E and H fields are positioned at half step intervals around a unit cell. The vector equations (3) & (4) represent a system of six scalar equations, which can be expressed in the rectangular coordinate system (x, y, z) as;
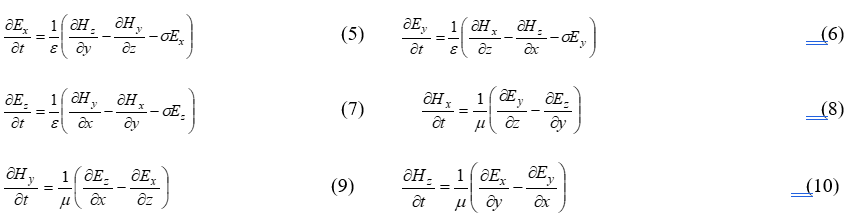
The propagation of an incident RF wave, Ei, through the body having electrical properties, s, m and e is governed by equations (5) to (10). The equations are solved using FDTD method by converting the six partial differential equations into six difference equations from which all 6 field components, Ex, Ey, Ez, Hx, Hy, Hz can be obtained. Following Yee’s notation, we assume that the grid points of the body are defined using (i, j, k) with coordinates given as,![]() , where
, where ![]() is the size of the unit cubic cell . For good accuracy in FDTD simulations, the cell dimensions should be less than one tenth of the wavelength in the medium (λm) when it has the highest permittivity.
is the size of the unit cubic cell . For good accuracy in FDTD simulations, the cell dimensions should be less than one tenth of the wavelength in the medium (λm) when it has the highest permittivity.
i.e:
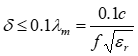 (11)
(11)
For stability, the time step is given by,
![]() (12)
(12)
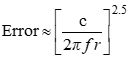
In the FDTD method, the radiation condition is not implicit and therefore as the RF wave propagates inside the body, the scattered waves must be truncated at the edge of the field which has been simulated. The truncation used is in accordance with Bayliss and Turkel [10] and it results in an error as given by equation (13).
 (13)
(13)
where f is the frequency of the incident signal, r is the distance from the center of the scattering site to the edge of the simulating field and c is the velocity of light in free space.
According to the literature [11-12]., in the human eye model, from 100 to 900 MHz the highest SAR value is reported at the front layers of the eye. At 900 MHz some highest SAR spots appear around the center of the eye and the highest can be found at 2500 MHz and is exactly at the center. Therefore the other effort was to examine how the electromagnetic energy absorption depends on the electrical properties of the organ.
METHODOLOGY
2.1 Field Measurements
The measurements of field intensity were made at different locations, which represent highly populated flat urban environment, such as Colombo, Gampaha, Jaffna and Kurunegala. Further, along the coastal belt from Jaffna to Trincomalee which are urban. Kandy, Matale, Nuwara-Eliya, Badulla and Bandara wela are hilly areas at high elevation and measurements were taken from other areas of the country as well. The measurement set up consists of standard Yagi-antenna (Telewave product – USA) of different frequency ranges and a spectrum analyzer (Anritsu MS 2712 E – 100 kHz to 4 GHz). Three different antennas were used to measure the signals in 900 MHz, 1800 MHz and 2 GHz bands.
All measurements were taken during the daytime when most of the mobile phones are normally in use. For measuring the field strength in each city, a particular location was selected by considering the most populated areas such as public bus stands, railway stations, playgrounds, etc.
For a particular network provider, operating in a certain bandwidth, the maximum voltages received were obtained with respective to the different channels operated in that frequency slot from the spectrum analyzer. This was done by rotating the antenna in 3600 in 8 steps as 450 divisions. The approximate time spent for a one step was two minutes. Then finally it gave the maximum voltages (Vm) received for the corresponding channels belonging to the network provider. Likewise for one frequency band, all signals received belong to different network providers within the allocated frequency slots were scanned at a particular location. This was repeated for other two frequency bands as well.
The measured value of Vm was converted to field intensity E (dBµV/m) using Eq. (14). Then it was converted into the numerical value.
![]() (14)
(14)
Where, K (dB/m) is the antenna factor which is the ratio of electric field strength at the antenna to the voltage produced at the antenna connector. The value of K is given by the antenna manufacturer. Here L (dB) is the total system loss. The measured signal field strength is only from one direction and it is in the direction of maximum field strength received for that signal. For the worst case (maximum possible) situation we suppose that this field comes from three orthogonal directions. This will be added as an additional safety factor for the exposure level. Hence,
![]() ;
;
Therefore,
![]() (15)
(15)
The power density in worst-case situation can be written as;
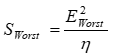 (16)
(16)
Where ɳ is the intrinsic impedance of which equals to 377 Ω. The Electric field strength and the Power density were calculated using Eq. (14) to (16). Then the respective “Exposure Quotient” can be calculated using equation (2).
2.2 SAR Calculation
As the human eye is one of the most sensitive organs in human body, SAR values are evaluated for each site with respect to the human eye. The process of this work is summarized as shown in Fig. 2.
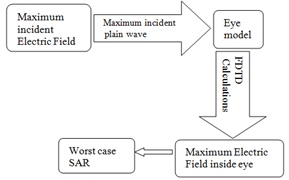
Fig. 2. Block diagram of the SAR calculation Process
For a particular site, there are a large number of signals with respect to the three frequency bands. In one frequency band, the maximum received signal was taken as the sinusoidal incident plane wave and it was allowed to interact with the eye model. According to FDTD method, the equations for E and H are solved as described using the Matlab programming.
Then the SAR can be calculated at each point by,
![]() (17)
(17)
Then the highest value of these maximum amplitudes from all the cells is selected to calculate the worst case SAR1g value.
![]() (18)
(18)
If the number of received signals from a particular frequency band is N and the maximum field strength from these signals is Eimax, the maximum SAR1g can be calculated letting Eimax to interact with the eye model. Then the total maximum SAR1g of that location due to that particular frequency band is SAR1g´N. Likewise the total maximum SAR1g values due to the signals from other two frequency bands are calculated.
If the maximum SAR1g values and number of available signals for those three bands are SAR1g1, SAR1g2 and SAR1g3 and N1, N2 and N3 respectively; the maximum possible SAR1g due to all considered networks of a location would be,
Worst-case SAR1g of the site = (SAR1g1´N1) + (SAR1g2N2) + (SAR1g3N3) (19)
Then this total worst-case SAR1g is compared with the standards for general public i.e., 1.6 W/kg for compliance testing of that site. The process is repeated for each of the RF measured sites.
2.3 Dependency of SAR on Electrical Properties
Similarly the effect of the electrical properties on the SAR is examined by making perturbations to the values of e and s of the different body tissues.
Here er and s are given perturbations of 5% and 10% to observe the sensitivity of the SAR on electrical properties of the tissues.
RESULTS & DISCUSSION
3.1 Field Measurements
The results are illustrated in Fig. 3. Among the cities considered, the highest exposure level was at Vavuniya and measurements were taken at a place close to the public bus stand. This may be due to the fact that the two network providers established their base station antennas more recently and transmitted high power levels to have a maximum coverage area. The highest contribution to RF absorption by the human body at this site was due to 2 GHz band. However the exposure level was approximately one third of the accepted limits and therefore it was not much less than the specified limits.
The minimum exposure level was reported in Puttalam and it was 1220 times lower than the prescribed permissible level. From the sites considered 19 out of 30, the major exposure contribution is due to the 2 GHz. This may be due to the fact that almost all the network providers were upgraded their systems to higher frequency bands because of the additional features given. The other significant point is that in the most populated areas such as Colombo Fort and Jaffna, the exposure level is more than 100 times below the limits. That is due to the installation of micro cellular base station antennas by replacing macro cellular base station antennas. By this they can reduce the coverage area thereby reducing the transmitting power.
At the hilly areas such as Badulla, Bandara wela, Nuwara Eliya and Hatton, most of the base station antennas are mounted on top of the hills and comparatively higher power levels are transmitted to cover the town limits.
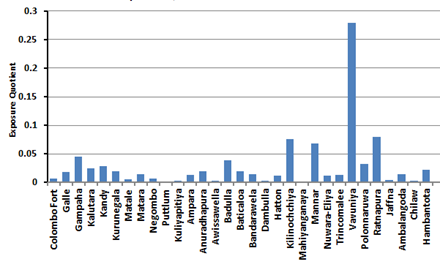
Fig. 3: Exposure Quotients of main cities in Sri Lanka.
Fig. 4 shows the total number of cities that each of these network providers dominates in maximum average strengths with respect to each frequency range. Fig. 4 clearly shows that among the network providers (NP), NP 5 leads in all frequency ranges at those cities considered in maximum average strengths. NP 3 dominates in only two cities in two frequency ranges and normally it provides comparatively lower strengths. In most of the cities, one network provider shows the maximum strength but not the maximum average strength. For instance, in 900 MHz band, maximum strength showed at Gampaha by NP 4 but the average maximum showed at Kandy by NP 1.
3.2 SAR Calculation
The maximum SAR values for each of the city with respect to the received signals are illustrated in Fig. 5.
As seen in the results, the total SAR1g values in each city are well below the safe limits. The highest SAR value of 0.1491 W/kg was observed from Galle; measurements were made at a place which is close to the main bus stand. The highest contribution to RF absorption by the human eye at this site is due to 2 GHz band. However the exposure level is approximately eleven times lower than the permissible levels.
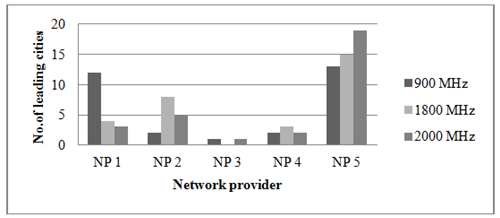
Fig. 4: Total number of leading cities in each network provider with respect to each frequency band.
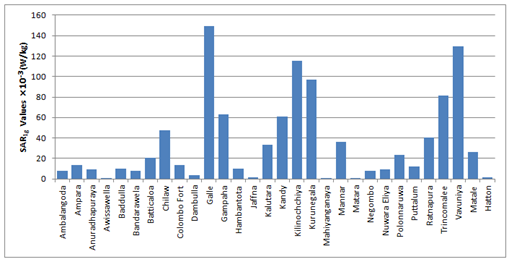
Fig. 5: SAR1g Values of main cities in Sri Lanka.
3.3 Dependency of SAR on Electrical Properties
SAR values are recalculated to observe how the electrical properties of the tissues affect the electromagnetic energy absorption in an organ. For this purpose the human eye at 2500 MHz was taken into consideration as it gives the maximum energy absorption out of all body organs considered in this analysis. For the human eye at 2500 MHz, relative permittivity er = 52.558, conductivity, s = 2.0702 S/m [09]. Assuming and incident field of 1 V/m, the estimated SAR is 0.3080 W/kg.
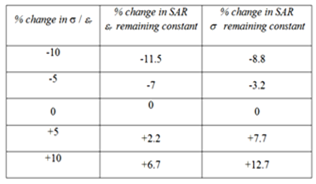
er and s are given perturbations of 5% and 10% to observe the sensitivity of the SAR on electrical properties of the tissues. Observations are given in Table 1.
Table 1. Sensitivity changes for variations of permittivity & conductivity
The sensitivity curve of SAR for perturbations of electrical constants is shown in Fig. 6.
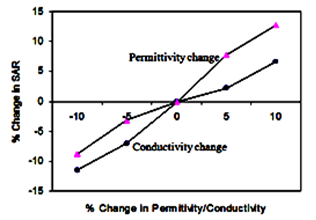
Fig. 6. SAR Sensitivity for perturbations of permittivity & conductivity
When is perturbed in small percentages with remaining unchanged; the value of the maximum SAR also changes by small values. The same trend is observed when is perturbed with remaining unchanged. These results are due to the complex dependency of and on SAR. However, both these cases, when the electrical properties are changed, the location of maximum SAR remains unchanged. It is exactly at the center of the eye as shown in Fig. 7. The vertical axis of this figure gives the distance from the front surface of the eye in cell numbers and the data points show the locations of maximum SAR with respect to the electrical properties.
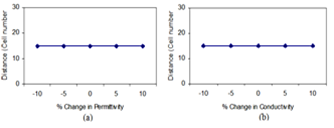
Fig. 7. Locations of maximum SAR corresponding to the percentage change in: (a) permittivity e with s remain unchanged, (b) conductivity s with e remain unchanged.
CONCLUSION
According to the results of RF exposure levels and SAR values, we are safe from RF radiation. But when we are exposed to lower strength of RF radiation for a long period of time it may cause some health effects. For example, repeated exposure to microwave radiation could alter the blood brain barrier (BBB) permeability even at extremely low SAR values such as 0.016 W/kg, which is 100 times lower than the permissible level. Opening of the BBB alows some foreign materials to pass from the blood to the brain.
According to the research outcomes, this kind of exposure assessment should continuously be done at least once in two years since mobile base station antennas are being built at a rapid rate. It is advisable to build micro cellular base station antennas by replacing macro cellular base station antennas to have a good coverage without interferences and to minimize the exposure levels.
ACKNOWLEDGEMENT
The author is grateful to the Wayamba University of Sri Lanka for providing the facilities to carry out this research work.
REFERENCES
- FCC Std., Guidelines for Evaluating the Environmental Effects of Radio Frequency Radiation, FCC 96-326, Washington, DC,1996.
- R.J. Spiegel, A review of numerical models for predicting the energy deposition and resultant thermal response of humans exposed electromagnetic fields, IEEE Trans. Microwave Theory Tech., 23, (1975), p.623-660
- Dennis M. Sullivan, OM P. Gandhi and Allen Taflove, Use of the Finite-Difference Time-Domain Method for Calculating EM Absorption in Man Models, IEEE Trans. on Biomedical Engineering, 35, (1988) 3.
- Dennis M. Sullivan, David T. Borup and OM P. Gandhi, Use of Finite-Difference Time-Domain Method in Calculating EM Absorption in Human Tissues, IEEE Trans. on Biomedical Engineering, 34, (1987)2.
- Hsing-Yi Chen, Hou-Hwa Wang, Current and SAR Induced in a Human Head Model by the Electromagnetic Fields Irradiated from a Cellular Phone, IEEE Trans. on Microwave Theory Tech., 42, (1994) 12.
- S.M. Mann, T.G. Cooper, S.G. Allen, R.P. Blackwell and A.J. Lowe, “Exposure to Radio Waves near mobile Phone Base Stations”, NRPB-R321, June 2000.
- K.S. Yee, Numerical solution of initial boundary value problems involving Maxwell’s equations in isotropic media, IEEE Trans. Antenna Propagat., 17, (1966), p.585-589.
- K. Umashankar and A. Taflove, A novel method to analyze electromagnetic scattering of complex objects, IEEE Trans. Electromagn. Compat., 24, (1982), p.397-405.
- A. Taflove and K. Umashankar, Radar cross section of general three-dimensional scatterers,” IEEE Trans. Electromagn. Compat., 25, (1983), p.433-439.
- Bayliss and E. Turkel, Radiation boundary conditions for wave like equations, Commun. Pure Appl. Math., 33, (1980), p.707-725.
- M.A.A. Karunarathna, CAN Fernando and P. Samarasekara,” RF Radiation Distribution & Corresponding Exposure Levels Due to Mobile Base Stations in Sri Lanka”, International Journal of Advanced in Science, Engineering and Technology (IJARSET), Vol.6, Issue 1, January 2019, pp. 7909 – 7916.
- M.A.A. Karunarathna and I. J. Dayawansa, Energy absorption by the human body from RF and microwave emissions in Sri Lanka, Sri Lankan Journal of Physics, 7, (March 2006) 35-47.