Modeling Cross Sectional Data Using Fuzzy Regression Analysis: A Case Study of Value Price of Residential Properties in Ames
- Celestina Moturi
- Victor Musau
- Robert Muriungi
- 196-204
- Sep 23, 2023
- Mathematics
Modeling Cross Sectional Data Using Fuzzy Regression Analysis: A Case Study of Value Price of Residential Properties in Ames
Celestina Moturi1*, Victor Musau1 and Robert Muriungi2
1Department of Pure and Applied Sciences, Kirinyaga University, P.O Box 143-10300, Kerugoya, Kenya
2Meru University of Science and Technology, Kenya
*Corresponding Author
DOI: https://doi.org/10.51584/IJRIAS.2023.8816
Received: 04 August 2023; Revised: 16 August 2023; Accepted: 23 August 2023; Published: 23 September 2023
ABSTRACT
Fuzzy regression analysis (FRA), also known as non-statistical regression analysis, is an approach used to establish relationship between an input and output variables that are fuzzy. Fuzzy regression analysis serves as an alternative method to classical regression analysis (CRA). The models used to model cross sectional data are statistical regression models which are based on linearity, normality and homoscedasticity assumptions. However these assumptions may not hold true leading to non normality, heteroscedasticity and non normality in the data. Thus, fuzzy regression analysis gives a solution to challenges that may arise when using statistical regression models. Because of the uncertainties that may arise in a given data, the model was based on cross sectional data for the price of residential properties sold in Ames Iowa. Since the price of residential properties fluctuates, the model was developed in three forms. Three fuzzy regression methods; possibilistic linear regression with least squares (PLRLS), possibilistic linear regression (PLR) and fuzzy least absolute residuals (FLAR) methods were used to fit the fuzzy linear regression model (FLRM). In this study lot area, total basement area square feet and garage area were selected as explanatory variables. The results show that by applying different fuzzy regression methods to model the data, fuzzy least squares methods yielded significant results for modelling the value of the residential properties.
Keywords: Fuzzy regression, fuzzy numbers, symmetric and non-symmetric triangular fuzzy numbers and fuzzy regression methods
INTRODUCTION
In real life and life science situations, regression analysis has been used to model the relationship among variables [1]. A researcher is required to make a choice of the required regression method or model to use to perform any regression analysis. According to [2], a regression model can be used to approximate the true relationship between the response and the explanatory variables. The error term is assumed to be due to measurement of errors that are normally distributed with the constant variance. Statistical regression model has some strict restrictions regarding the nature of data [3]–[5]. However, since the real world situations is actually full of ambiguities, the fuzzy regression model introduced by [6] has been used to express the functional relationship between an independent variable and a dependent variable in a fuzzy environment. This shows that the fuzzy regression is an extension of statistical regression analysis in a fuzzy environment. In fuzzy regression, deviations are sometimes due to the indefiniteness of the structure of the system or imprecise observations not due to random errors [7]. Fuzzy regression analysis methods that have been used mostly; they include possibility regression analysis, which is based on possibility concepts and fuzzy least squares methods introduced by [8] for minimizing errors for the estimated outputs. Consequently, many results in fuzzy regression analysis of the given datasets are derived given that, the fuzzy regression model used is known depending on the nature of the data [9]. Unfortunately, a model that is optimum for parameter estimation maybe inappropriate for analysis. Model adequacy has been a serious problem, thus, many authors have developed different criteria, which is applicable to various datasets. Meanwhile, fuzzy regression analysis has been used in many applications. A study by [10] applied fuzzy regression analysis to model car ownership in Turkey in terms of the inter correlation among variables. The study findings showed that classical regression approaches cannot be applied where there is inter correlation between variables. Further studies by [11] used fuzzy regression analysis to estimate the value of real estate using fuzzy logic method. A study by [12] modeled house prices in developed countries using policy and non-policy factors to provide a framework for government agencies to facilitate decision making. In spite the use of fuzzy regression analysis, the main discussion has surrounded the problem of uncertainties among variables. With increasing human population, there is increased demand for residential properties prompting massive investment in this sector of the economy. Therefore, there is a need for research to develop a model that can help residential property investors to predict residential property amidst uncertainities. This present research develops fuzzy regression model using different fuzzy regression methods which can be used to deal with uncertainties among the sale price of the residential property.
METHODOLOGY
2.1. Data Used
Secondary data obtained from Ames, Iowa Assessors office was used in this study. The data set contained information from the Ames assessor’s office used in computing assessed values for individual residential properties sold in Ames. The value of the residential properties was measured and determined by lot Area, total basement square feet and garage area.
2.2. Fuzzy Regression
Fuzzy regression provides an alternative to statistical regression analysis. It is used to evaluate the functional relationship between the dependent and independent variables in a fuzzy environment. The response and the explanatory variables are required to follow a normal distribution in statistical regression analysis. However, there are cases where these variables may not follow this distribution whereby regression assumptions may not hold true and imprecision between variables could exist. Also the aptness of model may be poor and when human judgement is involved fuzzy regression may be applied. However using fuzzy regression does not allow all data points to influence the estimated parameters which may result to use of excess constraint. Estimating the regression coefficients and making subsequent prediction becomes a challenge to the classical regression analysis [6], hence the use of fuzzy linear regression analysis.
2.2.1 Fuzzy Numbers
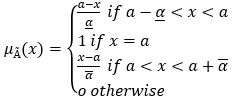
In fuzzy domain crisp numbers are represented as fuzzy numbers. A fuzzy real or actual number à is defined as a fuzzy set of actual numbers R. Every actual value number x ∈ R is a member of the fuzzy set à with 0 to 1 membership degree defined by a membership function μÃ(x):x→[0,1] . A membership degree of zero implies that the value of x in the real number is excluded in the fuzzy number à while a membership degree of one denotes that the value of in the real number is incorporated in Ã. A group of all observations in real value observations, such that their membership function is greater than zero is referred as the support of the fuzzy number Ã[13]. Fuzzy numbers are described from different membership functions. Fuzzy numbers with triangular membership functions were used in this study. A triangular fuzzy number à was defined by a membership function which is triangular μà (x) that dictates a joint set of attainable values of the fuzzy number à , a set of x with μà (x) > 0 where μà (x) > 1 for the most possible x.
 (1)
(1)
2.2.2 Conversion of Real Value Observations to Fuzzy Numbers
A fuzzy number is represented with three points for example a set of three numbers (a1,a2,a3), where a1 represents the left spread, a2 represents the central value which is the most probable value and a3 represents the right spread. Spreads represent the closeness to the real value observation that is the maximal deviation from the average of score or observation, which is the central value of the fuzzy number. The fuzzy methods that are used in this study require that the real value observation of the response variable to be modified into a fuzzy number, that is the observation of the response variable (Y) should be expressed as ![]() . Conversion of real value observation to fuzzy numbers is referred to as fuzzification [14].
. Conversion of real value observation to fuzzy numbers is referred to as fuzzification [14].
2.2.3 Fuzzification Methods
The basic methods that can infer triangular fuzzy numbers (TFN) from real value observations include the following [14];
- Zero and Mean Method
This method calculates the symmetric triangular fuzzy numbers of the actual value given. The mean method obtains a fuzzy number whose central value of a TFN is the mean of given and the left and right spreads are standard deviations and the zero method inserts zeros to both spreads.
- Error and Median Method
Provides either symmetric triangular fuzzy numbers or non-symmetric triangular fuzzy numbers, depending on the available data. The median method gives the central values as a median and left and right spreads are calculated as distance of the first and third quartile from the median and the error method employs a user defined numeric value of vector for the spreads.
- Simulation Method
Fuzzy numbers can be simulated if the fuzzification methods may fail to give prompt results.
2.2.4 Fuzzy Linear Regression Model
Fuzzy linear regression model gives a fuzzy functional relationship between the output and input variables. Fuzzy linear regression model has no error term since uncertainty is included in the model by means of fuzzy coefficients. The fuzzy linear regression model has the following form [15]:
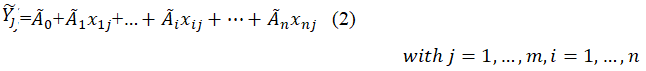
where is the quantity of independent variables xij, m is the quantity of data, and ![]() is the fuzzy predicted value of the output variable considering the jth data.
is the fuzzy predicted value of the output variable considering the jth data.
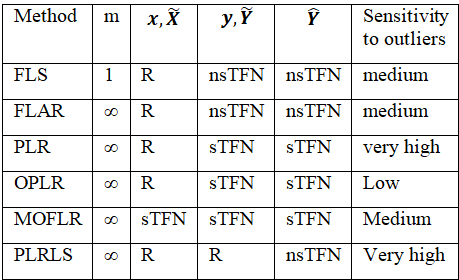
Different fuzzy linear models are formulated using different fuzzy regression methods depending on the observations that variables used take, sensitivity to outliers and the number of explanatory variables as shown in Table 1. For example:
- When the explanatory variables are actual value observations and response variable takes a non-symmetric form. The Fuzzy least squares (FLS) and Fuzzy least absolute error (FLAR) methods are used.
- When explanatory variables takes actual value observations and response variable takes symmetric fuzzy observations the possibilistic linear regression (PLR) method is used, it also support multiple regression.
- Multi objective fuzzy linear regression method abbreviated as (MOFLR) is used when both observations of an explanatory variable and a response variable are symmetric fuzzy observations.
- Possibilistic linear regression with least squares (PLRLS) model is used when the independent and dependent variable are actual value observations but the estimated response variable is non-symmetric observation [13].
Table I: Characteristics of Fuzzy Linear Regression Procedure [13]
2.2.5 Estimation of the Fuzzy Linear Regression Model Parameters
The minimum fuzziness and the least squares criteria have been used to estimate the parameters of the fuzzy linear regression models. Minimum fuzziness criterion is used when the spread of the fuzzy numbers is required to be minimum, while the least squares criterion as used in statistical regression analysis have to be replaced by fuzzy distance measures [16].
To derive the result of center values and spreads of the triangular fuzzy number that represent the coefficient of the fuzzy linear regression a computer software is used. To fully exploit fuzzy linear regression, the parameters of the fuzzy regression model should be data driven.
2.2.6 Evaluation of the Fuzzy Linear Regression Model
The fuzzy regression model is evaluated based on squared distances or differences of membership functions between the fuzzy output observations ![]() and model prediction
and model prediction ![]() . The goodness of fit measure G is the average squared distance between the fuzzy response
. The goodness of fit measure G is the average squared distance between the fuzzy response ![]() and the model prediction
and the model prediction ![]() . The measure G is derived from squared distance between triangular fuzzy numbers and it is defined as:
. The measure G is derived from squared distance between triangular fuzzy numbers and it is defined as:
![]() (3)
(3)
Low G values imply that the model sharply corresponds to the observations.
The total error of the fit ∑E assesses membership functions of the output and model predictions.
The total error of fit is computed as
![]() (4)
(4)
Where Ei is a contrast of membership functions between the ith observation ![]() and the ith model prediction
and the ith model prediction ![]() with respect to the membership function of
with respect to the membership function of ![]() .
.
Lower values of ∑E mean a better fit of the model.
MODELS OF THE PRICE OF THE RESIDENTIAL PROPERTIES.
3.1 Model Variables
In the model structure, lot area, garage area and total basement square feet are examined as explanatory variables obtained from the Ames assessors office. In order to determine the linear relationship among these variables, the Pearson correlation coefficient was calculated as shown in Table 2, Lot area increased despite the increase of total basement square feet and garage area.
Table II: Correlation Coefficient of Value of Residential Properties Model Variables
| Lot. Area | Total basement.sf | Garage area | |
| Lot area | 1.000 | 0.2784 | 0.2574 |
| Total basement sf | 0.2784 | 1.000 | 0.4055 |
| Garage area | 0.2574 | 0.4055 | 1.000 |
3.2 Structure of the Model
Linearity assumption is the common starting point in fuzzy regression analysis. Non-linearity assumption may be an appropriate relationship between the response and the explanatory variables. This can be detected by analysis via scatter plots as presented in Figure 1 to Figure 3.
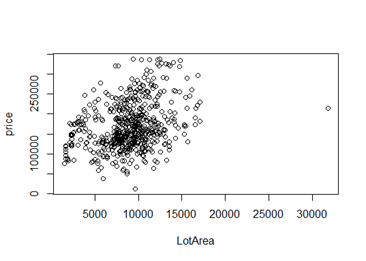
Figure 1: Scatter Plot of Lot Area
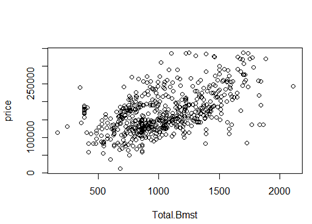
Figure 2: Scatter Plot of Total Basement square feet
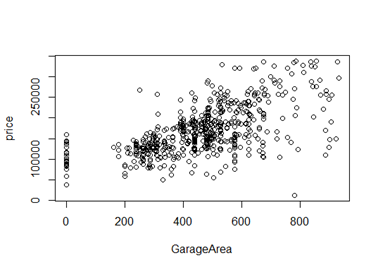
Figure 3: Scatter Plot of Garage Area
Model structure is developed using four steps as follows:
3.2.1 Determination of the Fuzzy Regression Method for the FLR Model Type
Actual values of the observations indicates a crisp relationship between the variables. In order to determine the form of a relationship between price of the residential properties and the independent variables, three methods were examined.
- Possibilistic linear regression with least squares method;

- Possibilistic linear regression method;

- Fuzzy least absolute residuals method;

3.2.2 Perform Fuzzy Regression Model with PLRLS Method
The real value observations from the given data indicate that the best method is the form of the PLRLS. The fuzzy regression model is performed using the method as follows:
![]() (5)
(5)
The total error of fit is used as the performance indicator of the model and in this case is 7.172e+13. The coefficients of the Model are given as shown in Table 3
Table III: Coefficient of Fuzzy Regression Model using PLRLS Method
3.2.3 Perform Fuzzy Regression Model with Possibilistic Linear regression method
In order to use this method, the response variable in the model is fuzzy. Where it is in the form of a symmetric triangular fuzzy number. In this case the model is in this form;
![]() (6)
(6)
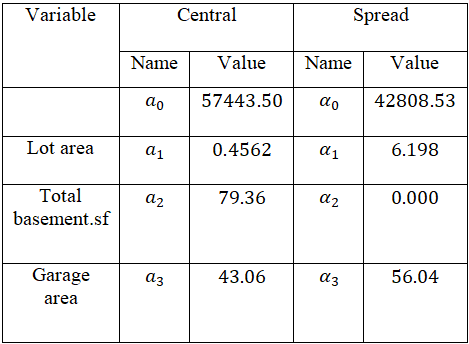
The calculated model coefficients are presented in Table4. The total error of fit is calculated as 6964.94 which is minimum, compared to the previous model.
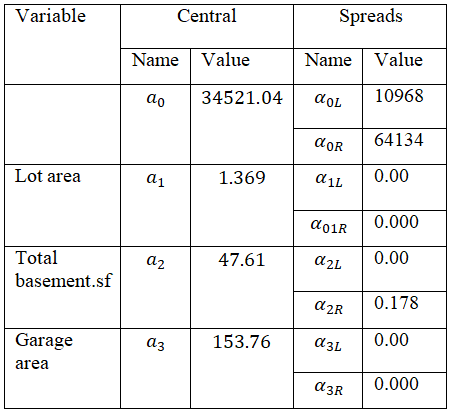
Table IV: Central and Spreads Coefficients of Fuzzy Regression Model Using PLR Method
3.2.4 Performing Fuzzy Linear Regression Model with Fuzzy Least Absolute Error Method.
The FLAR method, which is a statistical method of fuzzy regression, is also examined. The model structure evolved by using this method can be written as
![]() (6)
(6)
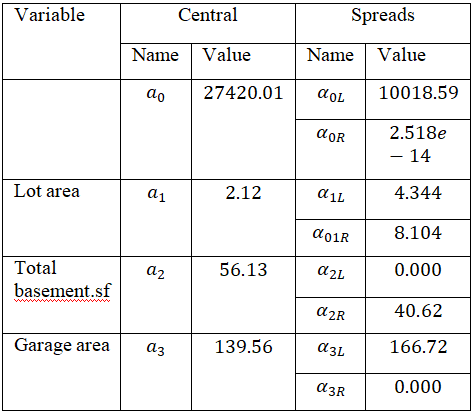
The coefficients of the fuzzy regression model are presented in Table 5. The total error of fit of this fuzzy regression model was determined to be 1016.92 being the lowest compared to the PLR and PLRLS methods.
Table V: Central and Spread Coefficients of Fuzzy Regression Model using FLAR Method
It is clear from the results that using different fuzzy regression methods to model the price of the residential properties gives different total error of fit considerably.
Moreover, from the observations it shows the need of using the FLAR method in model structure.
Though, the advantage of fuzzy regression model is its simplicity in programming computation, this procedure has been criticized as providing extremely wide ranges in estimation which is not useful in application. By applying different fuzzy regression methods, it can be seen that the range between the upper and lower bounds reduces. This is presented in Figure (4, 5, 6) where the upper and lower bounds are plotted for each regression method.
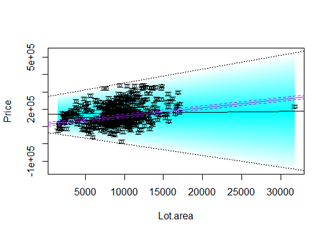
Fig. 4 Fuzzy linear regression model fitted using the PLR method with Lot area as an explanatory variable.
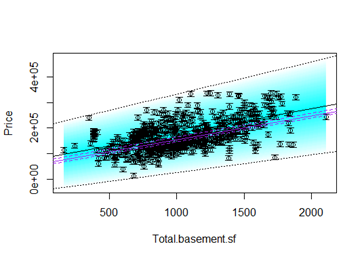
Fig. 5 Fuzzy linear regression model fitted using the PLR method with total basement square feet as the explanatory variable
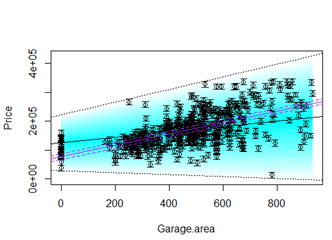
Fig. 6 Fuzzy linear regression model fitted using the PLR method with Garage area as the explanatory variable
The purple lines show the central tendency (solid lines) and lower and upper boundaries of the support (dashed lines) for model fitted with the FLAR method. Real value numbers known as the possible values are symbolized by circles while whiskers show range (support) of possible values for the observations
DISCUSSIONS
Modeling cross sectional data involved the use of possibilistic linear regression with least squares, possibilistic linear regression and fuzzy least absolute residuals methods. Fuzzy least absolute with residuals method, constructed a model fit for modelling the value of residential properties because it indicated a minimal total error of fit. As observed above the choice of non-symmetric fuzzy coefficients provided the best fitting. The garage area variable had the greatest influence on determining the value of the residential properties. A similar observation has been reported for a case study on affordable levels of house prices in Shanghai using fuzzy linear regression analysis [17]. Fuzzy regression models were reliable for predicting value of residential properties and reliable in case linear regression assumptions may not hold true. Similarly, test results have shown that fuzzy linear regression give better prediction of peak rate and flood risk assessment compared to non-fuzzy error-in-variables model [18]. Results of this study could contribute to making decisions by buyers before buying the residential properties considering the variables applied. More research would be needed to study other factors that may be considered when determining the value of residential properties.
CONCLUSION
In this study, a fuzzy regression model has been developed to determine the sale price of the residential properties. The fuzzy model was based on the possibilistic regression analysis derived from possibility concepts developed by Tanaka. The fuzzy regression approach was preferred to classical regression because of non-linearity and heteroscedasticity among variables. The model structure was developed using two approaches, such as predetermination of fuzzy methods to use to model the variables and performing fuzzy regression models using alternative fuzzy regression methods. The fuzzy regression model in this study used lot area, total basement area in square feet and garage area as explanatory variables. The most significant advantage of the fuzzy regression model developed here is the accuracy of the model outputs, which is determined according to the total error of fit despite the non-linearity and heteroscedasticity among the variables. The total error of fit changed among the fuzzy regression methods. Since the prices of residential properties fluctuate, using fuzzy method provides not only a crisp output referred to as a central value but also an output range, named the lower and upper bound (left and right spreads), is more practical than other methods. Thus, the FLAR method is more practical than other methods. However, this output range must not be wide to prevent a solution from being attained.
REFERENCES
- K. Uyanık and N. Güler, “A study on multiple linear regression analysis,” Procedia-Social Behav. Sci., vol. 106, pp. 234–240, 2013.
- Bhavyashree, M. Mishra, and G. C. Girisha, “Fuzzy regression and multiple linear regression models for predicting mulberry leaf yield : A comparative study,” Int. J. Agric. Stat. Sci., vol. 13, no. 1, pp. 149–152, 2017.
- Arkes, “Regression analysis: a practical introduction,” Taylor Fr., vol. 49, no. 7, pp. 984–996, 2023.
- C. Montgomery, E. A. Peck, and G. G. Vining, “Introduction to linear regression analysis,” John Wiley Sons, vol. 34, no. 1, pp. 115–127, 2021.
- Ye and B. Liu, “Uncertain hypothesis test with application to uncertain regression analysis,” Fuzzy Optim. Decis. Mak., vol. 21, no. 2, pp. 1–18, 2022.
- Tanaka, S. Uejima, and K. Asai, “Linear regression analysis with fuzzy model,” IEEE Trans. Syst. Man Cybern, vol. 12, pp. 903–907, 1982.
- Pandit, P. Dey, and K. N. Krishnamurthy, “Comparative Assessment of Multiple Linear Regression and Fuzzy Linear Regression Models,” SN Comput. Sci., vol. 2, pp. 1–8, 2021.
- Nazari-Shirkouhi and A. Keramati, “Modeling customer satisfaction with new product design using a flexible fuzzy regression-data envelopment analysis algorithm,” Appl. Math. Model., vol. 50, pp. 755–771, 2017.
- G. Sarip, M. B. Hafez, and M. N. Daud, “Application of fuzzy regression model for real estate price prediction,” Malaysian J. Comput. Sci., vol. 29, no. 1, pp. 15–27, 2016.
- Kropat, A. Özmen, G. W. Weber, S. Meyer-Nieberg, and O. Defterli, “Fuzzy prediction strategies for gene-environment networks-fuzzy regression analysis for two-modal regulatory systems,” RAIRO-Operations Res. Opérationnelle, vol. 50, no. 2, pp. 413–435, 2015,.
- Chatterjee, Samprit, Hadi, and S. Ali, “Regression analysis by example,” John Wiley Sons, vol. 6, pp. 128–139, 2013.
- J. Prieto, A. Silva, J. de Brito, J. M. Macías-Bernal, and F. J. Alejandre, “Multiple linear regression and fuzzy logic models applied to the functional service life prediction of cultural heritage,” J. Cult. Herit., vol. 27, pp. 20–35, 2017.
- Garg and D. Rani, “Novel distance measures for intuitionistic fuzzy sets based on various triangle centers of isosceles triangular fuzzy numbers and their applications,” Expert Syst. Appl., vol. 191, pp. 116-128., 2022.
- Kreinovich, “Defuzzification,” in Towards Explainable Fuzzy AI: Concepts, Paradigms, Tools, and Techniques, vol. 44, no. 3, Cham: Springer International Publishing, 2022, pp. 21–34. doi: 10.1016/j.jmpt.2020.07.011.
- Soffritti and G. Galimberti, “Multivariate linear regression with non-normal errors: a solution based on mixture models,” Stat. Comput., vol. 21., no. 4, pp. 523–536, 2010.
- R. Arabpour and M. Tata, “Estimating the parameters of a fuzzy linear regression model,” Iran. J. Fuzzy Syst., vol. 5, no. 2, pp. 1–19, 2008.
- Zhou, H. Zhang, Y. Gu, and A. A. Pantelous, “Affordable levels of house prices using fuzzy linear regression analysis: the case of Shanghai.,” Soft Comput., vol. 22, pp. 22, 5407–5418, 2018.
- T. Khan and C. Valeo, “Short-term peak flow rate prediction and flood risk assessment using fuzzy linear regression,” J. Environ. Informatics, vol. 28, no. 2, pp. 71–89, 2016.