Urban Quality of Life- Analyzing Trends of Academic Papers in Developed and Developing Country Context using Text Mining
- Ananya Nandy
- Dr. Sarmistha Biswas
- 119-131
- Dec 15, 2023
- Environmental Impact
Urban Quality of Life- Analyzing Trends of Academic Papers in Developed and Developing Country Context using Text Mining
Ananya Nandy1, Dr. Sarmistha Biswas2
1Assistant Professor, Department of Economics, East Delta University, Chattogram, Bangladesh.
2Associate Professor, Eastern Institute of Integrated Learning in Management (EIILM), Kolkata, India.
DOI: https://doi.org/10.51584/IJRIAS.2023.81111
Received: 14 August 2023; Accepted: 31 August 2023; Published: 15 December 2023
ABSTRACT
Unsustainable urban growth is a major challenge for both developed and developing countries around the globe. Quality of urban life (QOUL) studies is common to find the gap between the public policy, urban planning, and sustainable urban growth with urban resource constraints. Urban development requires study of QOUL in both subjective and objective domain. QOUL studies are analyzed with literature review and text mining online tool -voyant tools. 30 research papers are incorporated from developed and developing countries where different countries have focused on different or common domains. Text mining helps to find the link between words and most used word in the corpus and also literature review further confirm that subjective study helps to focus towards achieving the sustainable urban development. It is also important to report urban development indicators but stakeholder involvement or bottom up approach is more important for an effective and initial start of the process.
Keywords: QUOL; Sustainable Development; Domains and text mining
INTRODUCTION
Urbanization is spreading throughout the planet. The urban share globally is increasing from around one third in 1950 to about two thirds in 2050, with more than half of the world’s population already residing in urban area. By 2050, approximately 7 out of 10 people will live in cities, with the urban population predicted to more than double from its current level (World Bank, 2023). Urbanization, which accounts for more than 80% of the world’s GDP, can support sustainable growth through improved productivity and innovation (United Nations, n.d.). In order to build sustainable cities in both developed and developing countries, urban growth must be efficiently managed. When the policymakers and several studies backed by the United Nations, World Bank, Organisation for Economic Co-operation and Development (OECD), European Commission, and European Statistics (EUROSTAT) began to pay major attention to the quality of urban life and sustainable urban growth, the study of Quality of Life (QoL) came into sharper focus (Senlier et al., 2009). The first studies on Quality of Urban Life (QOUL) were conducted in the USA and the UK in 1970, and over time, both subjective and objective markers came to be utilized to investigate this issue (Yuan et al., 1999; Cummins, 1999). Different persons living in the same urban environment may have varied degrees of satisfaction subject to their demographic and other characteristics, but some key factors will also be in common (Wish, 1986).
The term “quality of life” refers to a person’s general or overall well-being, which encompasses non-material components like freedom, tolerance, and self-expression in addition to material well-being (standard of living or livability)(Okulicz-Kozaryn, 2013). Standard of living is another term that refers to a degree of material comfort that includes things like access to education, clean water, housing, telephones, food, clothing, paved roads, computers, and other amenities. Standard of living is measured, not life quality, in livability rankings which is narrower then quality of life. One may reside in the city with the best ranking in terms of living standards and still have a very poor quality of life, according to Mercer (n.d.). A collection of generic measuring methods, was also created by the World Health Organization (WHO). This group of questionnaires is used to measure quality of life (QOL), which is related to health issues and allows different authorities to reflect their own cultural and value systems. The World Health Organization defines quality of life as how people feel about their place in life given their culture, the society they live in, and their ability to meet their expectations, goals, and standards (World Health Organization, n.d.). An individual’s level of satisfaction and contentment with several aspects of their life, such as their job, home, community, life, and society, as well as their financial, family, spiritual, recreational, social, emotional, and psychological well-being, is all related to QOL (Michalos et al., 2006). According to Keles (2012), people’s perceptions of their lives in the neighborhood as well as their own lives are reflected in their sense of well-being. The individual scale and the collective or community scale are the two levels at which the QOL is assessed. The individual scale measures how satisfied people are with the amenities and services that are offered, as well as their basic needs and expectations. Additionally, the collective level alludes to the metrics that raise societal standards of living. Since the 1930s, many geographic and socioeconomic situations have been studied in relation to QOL (Wish, 1986; Sirgy et al., 2002). Despite being a hegemonic concept in social science, the idea of QOL lacks a defined history and agreed-upon definitions (Lydick& Epstein, 1993; Lotfi & Koohsari, 2009). This is due to the fact that ‘quality of life’ can be considered to be a real, subjective experience, which makes the quantitative measurement more challenging (Mittal et al., 2019). This poses a particular measuring challenge for various fields, including psychology, health, social science, and environmental studies (Rapley, 2003).
In research projects, public policy, and urban planning, urban environmental quality and associated concepts like QOL and sustainability have gotten a lot of attention (Kamp et al. 2003; Seik, 2000; Campbell, 1976). QOUL assesses the citizens’ perceptions about the urban environment they live in. The social, economic, and physical characteristics of the metropolitan area are included in the urban environment and urban living conditions, and they have an effect on QOUL (Das, 2007). Household’s perspective of the urban environment using variables under the many sustainability dimensions can be examined to determine where improvements are needed in the other dimensions. Education, healthcare, and social security all need to be improved for the social dimension. The creation of more income and jobs, the eradication of poverty, and improvements to the environment’s health ecosystem, green infrastructure, and natural resources are all necessary for improving the economic dimension of urban quality of life (Nikoofam & Mobaraki, 2020).
OBJECTIVES OF THE STUDY
Quality of life has been considered an economic good in the study of economics because of it`s inherent qualities. Currently 4.4 billion people, or 56% (approx) of the world’s population, now reside in cities. According to projections, there could be an additional 2.5 billion people living in urban areas by 2050 as a result of urbanization, which is the gradual transition of people from rural to urban areas. Nearly 90% of this increase is expected to occur in Asia and Africa, according to a new United Nations data set (World Urbanization Prospects, 2018). 43 megacities with more than 10 million residents are expected to exist in the world by 2030, the majority of them in developing areas (United Nations, n.d.b). Sustainable development is becoming more and more dependent on the effective management of urban growth as the globe continues to become more urbanized, particularly in low-income and lower-middle-income countries where the rate of urbanization is anticipated to be the quickest. To meet the demands of their expanding urban populations in terms of housing, transportation, energy, and other infrastructure, as well as jobs and essential services like education and healthcare, will be difficult for many nations. According to urban economist Wingo (1973), QOL has three distinct features as an economic good. QOL is in short supply hence people are willing to exchange it for items that will make them similarly happy. Moreover households and businesses decide where to reside depending on as Quality of life factors. Quality of life is a public good that requires funding from the community. As per the SDG Goal 11 sustainable developments requires a sustained urban growth with making cities and human settlements inclusive, safe, resilient and sustainable with some targets and indicators. Put another way, facilities of any type, including trails, should be planned and designed for a balance among the economic, environmental, and social characteristics of an area so that its residents can lead healthy, productive, and enjoyable lives. Hence Urban development and QOL are closely knitted, and proper urban management needs improvement of quality of urban life (QOUL).
The study aims to explore and compare the studies conducted in developed and developing countries to offer a better urban management option. Our work seeks to use free online text mining method Voyant tool along with the literature review to investigate trends in a the review paper looks at recent research on overall urban quality of life concepts. Moreover the study will focus on the studies conducted in the cities of developed and developing countries.
METHODOLOGY
Search phrases like “urban quality of life” and “quality of life in the city”, “urban live ability”, “Urban neighbourhood satisfaction” are utilized in the Google scholar search engine to find research in the relevant topic. The QOUL studies used different proxy to measure QOL such as urban neighbourhood satisfaction, urban livability etc. To explore the QOUL assessment categories papers are studied from both developed and developing countries and other relevant papers in global scale. For the QOUL study comparison of developed and developing country the following standards were applied while choosing papers for review: in chronological order, starting in 2000- 2020 for developed countries and 2001-2022 for developing countries. The article’s subject matter was chosen to address the following issue: the most current QOUL research trends, the indicators or dimensions of QOUL study. The sample size for the review was adjusted to at least 30 papers in accordance with the rule of thumb requirement for the minimum size of the sample based on the assumption of the central limit theorem and normal distribution (Hogg et al., 1977). For the two groups of countries this study considers 15 papers from developed countries and 15 from developing countries. World Bank categorizes countries into four groups according to gross national income (GNI) per capita. The countries classified as Low income economies ($1,135 or less), Lower Middle Income Economies ($1,136 – $4,465), Upper Middle Income Economies ($4,466 – $13,845) and High Income Economies ($13,846 or more). It employs gross national income (GNI) per capita data in US dollars that have been converted from local currencies using the World Bank Atlas method, which smooth out variations in exchange rates. We classify low- and lower-middle-income nations as developing nations, whereas high- and upper-middle-income nations are categorized as developed nations (Sabir et al., 2019 ; Khokhar& Serajuddin, 2015).
RESULTS AND DISCUSSIONS
Scientific research has shown that there is no linear relationship between economic development and quality of life. However it cannot be expected that satisfying economic needs may improve the quality of life because the life of human being is a multidimensional and complicated. In particular, a lot of unbiased research has focused on how economic growth affects the standard of living in cities (Zanella et al., 2014). Although economic reasons may well help the development of livable cities, economically developed cities frequently experience intense strain due to things like high housing and living prices, which in turn presents problems for urban livability (Ogneva-Himmelberger et al., 2013). Most people have become more conscious of the social costs and environmental harms of economic expansion during the past ten years, and academics have concluded that rising GDP growth may not always result in betterment of people’s quality of life (Glatzer, 2006). So developed countries may ensure better objective life conditions but QOUL study is more than that. There is available literature to explore different issues of QOUL in different cities of developed and developing countries. A comprehensive list is provided below on the studies conducted in developed and developing countries shown in Table 1 and Table 2.
Table1. Studies included in the review- Developed Countries
| Literature | Country and city | Objective and dimensions of QOL study | ||||
| 1. Seik, F. T. (2000) | Singapore | Life as a whole, leisure, religion, self-development, media, consumer goods social life, environment, wealth, public utilities, transport, housing, healthcare, housing, family life. | ||||
| 2. McMahon (2002) | Bristol, U.K | Sustainable business, health and well-being, food and water quality, community safety, social economy, leisure, culture, tourism, land use and development. | ||||
| 3. Marans (2003) | Detroit, USA (Detroit Area Study -DAS 2001) | The relationship between people’s subjective and behavioral reactions to the objective condition by assessing the subjective well-being and travel and transportation, communities and neighboring, parks and recreational activity, housing and residential mobility, and sprawl and open space preservation. | ||||
| 4. Bonaiuto et al. (2003) | Rome, Italy | Accessibility and roads Green areas, Socio-relational features, People and social relations, Functional feature, Welfare services, Recreational services , Commercial services, Transport services , Context features , Pace of life , Environmental health ,Upkeep and care ,Neighbourhood attachment. | ||||
| 5. Dunning et al. (2006) | Saskatoon, Canada | Social cohesion variables (i.e., feeling a part of the neighborhood, level of comfort in calling on neighbors in a crisis, level comfort in participating in community projects, and volunteer activity) , place related variables (community security, human services, community services, micro quality of environment, macro quality of environment) | ||||
| 6.Lee (2006) | Taipei, Taiwan | Civic services, neighborhood satisfaction, community status, neighborhood environmental assessment, and local attachment. | ||||
| 7. Santos et al. (2007) | Porto, Portugal | Environment, urbanism, mobility, sports and leisure, culture, education, health, social work, trade and service, housing, urban safety, poverty and exclusion, Social and civic behaviour. | ||||
| 8.Santos and Martins,(2006) | Porto, Portugal | Environmental Conditions ,Collective Material Conditions or social dimension of the city and Global concept of quality of life , Quality of life in the city of Porto, Quality of personal life and Quality of life in the individual’s residential area. | ||||
| 9. Senlier et al. (2008) | Kocaeli, Turkey | Employment opportunities, housing costs, urban safety, cleanliness of cities, satisfaction with public transport, air quality, integration of inhabitants, and comparisons among the cities. | ||||
| 10. Williams et al. ( 2008) | Saskatoon, Canada | Friendliness in neighbourhood, safety and security, income compared to others. | ||||
| 11. Slavuj (2011) | Rijeka, Croatia | Length of residence, accommodation type, perceived property value, tenure, neighbourhood attachment, community attachment, and activity and participation in solving common issues in the neighbourhood. | ||||
| 12. Ülengin et al. 2001 | Istanbul, Turkey | Quality of physical environment, economic environment, Social environment, transportation and communication. | ||||
| 13. Wadi and Furlan (2017) | Qatar | Physical parameter, Social Parameter and Perceptual Parameter . | ||||
| 14. Zhan et al. (2018) | China (40 cities) | Urban security, the convenience of public facilities , natural environment , sociocultural environment , convenient transportation , and environmental health. | ||||
| 15. Nikoofam and Mobaraki (2020) | Famagusta, North Cyprus | Social, environmental, economic, physical, cultural, political characteristics, urban mobility, infrastructural indicators, and demography, social characteristics, place identity or perception of urban space. | ||||
Table 2. Studies included in the review- Developing Countries
| Literature | Country and city | Objective and dimensions of QOL study |
| 2. Majumder et al. (2007 | Chattogram, Bangladesh | Neighbourhood, social and physical environmental indicators |
| 3. Hasan, 2008 | Pakistan | Review the objective QOL indicators of Karachi and Lahore included in UN- Habitat Global Urban Indicators Program (GUIP) city ranking. |
| 4. Das (2007) | Guwahati, India | Physical, economic and social indicators |
| 5. Patel et al. (2011) | Surat, India | Natural Environment, Physical Environment, Health, Economic Sector, Social Sector, Political Sector, Education Sector and Infrastructure Sector. |
| 6. Goharipouret al. (2011) | Tehran, Iran | Cultural, Service, technical service and construction criteria |
| 7.Mridha and Moore (2011) | Dhaka, Bangladesh | Management and maintenance, Architectural features, Neighborhood, Neighbors , Recreation facilities , Ambient environment |
| 8. Arifwidodo (2012) | Indonesia | Distance from City Center, Gross District Density, Number of Urban Amenities , Perception on Air Pollution Safety |
| 9. Rezvani et al. (2013) | Noorbad, Iran | Indicators under economic, social and physical dimensions |
| 10. Zakerhaghighi et al. (2014) | Hamedan, Iran | Services, transport, Economic, Education, Security |
| 11.Zareei et al.(2015) | Tehran, Iran | Social(security, urban governance, daily access, recreation, education, social and cultural aspects), Physical( transportation, housing, infrastructure), Economic and Environmental aspects. |
| 12. Bardhan et al. (2015) | Kolkata, India | Compact urban form (UF) and neighbourhood scale |
| 13. Saha et al. (2020) | Kolkata, India | Health (physical), Health (mental), Social activities and relationships, Leisure activities, Level of independence, Life and Self perceptions, Support from neighbourhood, Religious/ spiritual beliefs, |
| 14. Pauzhuhan et al. (2020) | Arak, Iran | Place identity, citizenship ethics, social security, environmental quality, environmental sanitation, economic satisfaction, quality of public transportation. |
| 15. Patil and Sharma (2022) | India ( 14 cities) | Basic amenities index, Economic development index, Safety and security index, Transportation access index, Environmental impact index, Infrastructure development index, Gender role index |
are measured in the above studies and the findings are different depending on the indicators and the city location. With the in-depth study of the research conducted in the developing and the developed countries it is revealed that sample sizes are comparatively higher in the developed countries because most research initiatives are conducted at city level and funded either by city urban authority or university fund to monitor progress and whereas the studies in the developing countries are mostly conducted by the individual researchers. So the resource constraints are not only visible in the urban infrastructural development but this also impacts of QOUL research studies. Moreover the studies in the developed countries combined the subjective and objective indicators. To incorporate objective indictors availability of data report necessary. In developed countries the QOL is reported in regular interval in many cities by the city urban authority. In QOUL studies the social environment plays a major role for developed countries and it is emphasized that social environment should be improved or peoples` interaction in neighborhood plays a major role in QOUL. Neighborhood attachment, social environment are the overlapping factors to influence QOUL. On the contrary the developing countries focuses more on the physical environment and neighborhood satisfaction arising with different domains.
With the aid of Voyant, a free online tool accessible at https://voyant-tools.org that also created a word cloud based on the terms with the highest frequency, the tendency of predominate terms on the corpus and the incidence variation were detected. A cloud of words based on the terms with the highest incidence on the corpus was structured allowing the visualization and identification of the focus and subjects included on the corpus as an integral view. Two corpus are created for the developed and developing countries with the help of Voyant.
This corpus for developing countries has 15 documents with 119,485 total words and the corpus for developed countries has 15 documents with 98,597 total words. When we compare the most frequent words in QOUL studies for developing country high frequency words are life (940), quality (851), urban (718), satisfaction (710) and QOL (605) and for developed countries life (923); quality (905); urban (785); QOL (480); satisfaction (445). So there is a similarity in the high frequent words for the studies in both groups of countries when the corpuses are compared. For the QOUL study , life, quality, urban are common words and satisfaction is a subjective word that explains that research on this field mainly focus on the subjective study with given objective condition of life. So this study will
further focus on the word cloud, word link and word trend of particular word ‘satisfaction’ is analyzed with the text mining tool.
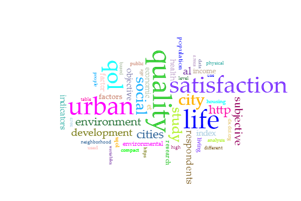
Fig 2: Word cloud of Developing country
Source: Compiled in http://voyant-tools.org/
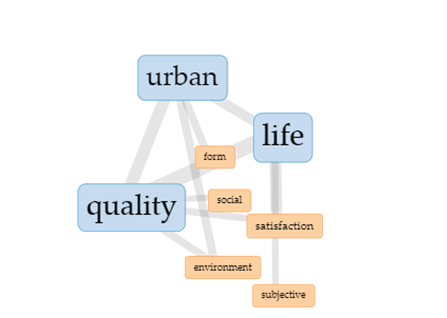
Fig 3: Word links for Developing country
Source: Compiled in http://voyant-tools.org/
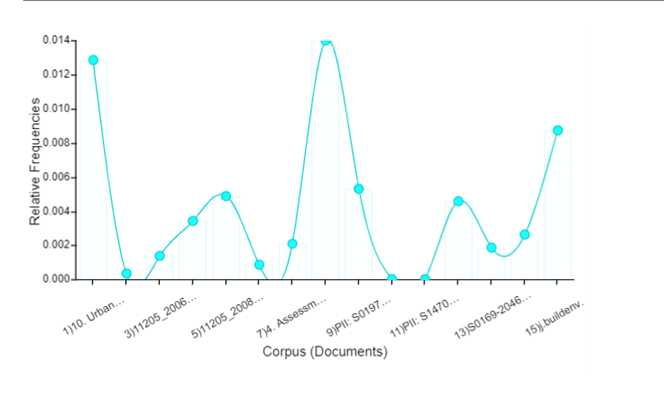
Fig 3: Trend document term – satisfaction of Developing country
Source: Compiled in http://voyant-tools.org/
Word cloud ( Fig2) of the corpus for developing country studies shows that neighbourhood, social, environment, health, income, physical, housing are most prominent words. For developing countries word link (Fig 3) generated by urban, quality and life forms a triangle showing connection with each other in Voyant tools. Life is connected with subjective domain and quality is related to satisfaction, social and environment. Further the word satisfaction appears in most of the studies in the corpus that is shown here. Highest frequency is in no 8.
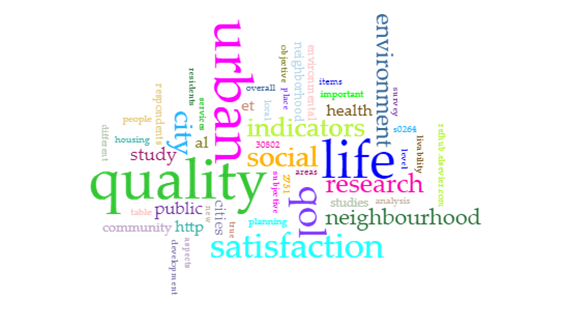
Fig 4: Word cloud of Developed country
Source: Compiled in http://voyant-tools.org/
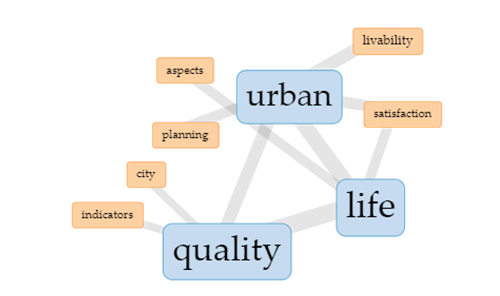
Fig 5: Word link of Developed country
Source: Compiled in http://voyant-tools.org/
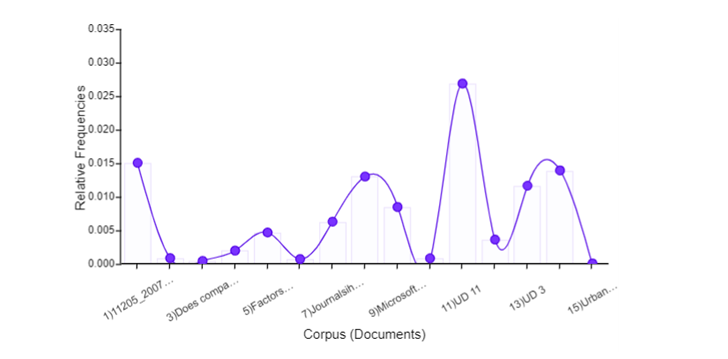
Fig 6: Trend document term- satisfaction of Developed country
Source: Compiled in http://voyant-tools.org/
Word cloud for developed country ( Fig- 4) shows that social, environment, neighbourhood, health is part of the word cloud. Word link (Fig 5) for developed countries urban quality of life is connected to livability, satisfaction, indicators and planning. Further Fig 3 and Fig 4 confirms that satisfaction is the key to quality of life study So even if objective conditions of life are better in developed countries still satisfaction may vary with the given objective condition to the city dwellers. In the developed countries urban development indicators are available and reported by the urban planning authority so indicators are also used to measure and report QOUL. In case of developing countries subjective way of QOUL study is most common.
The study of QOUL in both developed and developing countries is presented in Table 1 and this table addressed different domains focused in the studies over time. The literature review table is also added as a separate corpus to justify the connections among the important dimensions. It is visible (Fig- 7) that urban indicators to be used are social, physical economic and environmental domain. Neighbourhood and safety play an important role in urban management. These are the common sustainability domains for a holistic urban management.
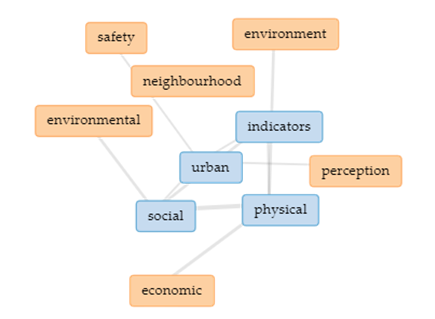
Fig 2: Word link – Literature review table for domains
Source: Compiled in http://voyant-tools.org/
To ensure sustainable urban development subjective satisfaction study plays a major role and stakeholder assessment is a necessary step to formulate practical urban management policy.
CONCLUSION
Despite the fact that QOUL can be challenging to define and evaluate, academics, governments, and communities frequently agree that QOUL research is worthwhile (Dunning et al. 2008). Since there is no perfect, “objective” set of metrics, someone must create each urban QOL indicator. Objective set of indicators are mainly developed in a top-down, expert-only manner, away from the people whose quality of life is being evaluated. According to experience, stakeholder involvement enhances the effectiveness of development interventions. In greater detail, a collaborative review of urban circumstances by experts, decision-makers, and stakeholders impacted by issues in a city produces conclusions that are more thorough and palatable than those produced by a strictly expert-driven approach (Leitmann, 1993). Therefore, urban QOL indicators should be created by representatives at the level where they will be used such as the neighborhood, district, state, city, metropolitan area, or region. Though there are arguments in setting up QOUL indicators but from the study of the cities in developed and developing countries where challenges of urban growth and development are different it is evident that the dimension of study still remained the same such as focusing on the social , economic and environmental domain. The use of text mining tool also reveals that the QOUL study in both developed and developing countries focuses on the satisfaction of the urban dwellers. In effective urban management all the aspects including recreational amenities, safety, pollution free environment, and quality urban amenities of transportation, education, health facilities and economic opportunities poses a challenge specially to the developing countries with growing population that lacks proper urban infrastructure.
To achieve the SDG goal by 2030 will pose a major challenge to the urban development and city planners need not only to allocate budget for urban development but research is also necessary to monitor progress. Database management will help to track progress and the stakeholder participation is necessary from residents to urban planners and academia.
REFERENCES
- Arifwidodo, S.D., 2012. Exploring the effect of compact development policy to urban quality of life in Bandung, Indonesia. City, Culture and Society, 3(4), pp.303-311.
- Bardhan, R., Kurisu, K. and Hanaki, K., 2015. Does compact urban forms relate to good quality of life in high density cities of India? Case of Kolkata. Cities, 48, pp.55-65.
- Biswas-Diener, R. and Diener, E., 2001. Making the best of a bad situation: Satisfaction in the slums of Calcutta. Social Indicators Research, 55, pp.329-352.
- Campbell, A., Converse, P.E. and Rodgers, W.L., 1976. The quality of American life: Perceptions, evaluations, and satisfactions. Russell Sage Foundation.
- Cummins, R.A., 1999. A psychometric evaluation of the comprehensive quality of life scale. Urban Quality of Life: Critical Issues and Options. Singapore: School of building and real estate, National University of Singapore, pp.32-46.
- Das, D., 2008. Urban quality of life: A case study of Guwahati. Social indicators research, 88, pp.297-310.
- De Hoyos, M. and Barnes, S.A., 2012. Analysing interview data. Warwick Institute for employment research.
- Dunning, H., Williams, A., Abonyi, S. and Crooks, V., 2008. A mixed method approach to quality of life research: A case study approach. Social indicators research, 85, pp.145-158.
- Glatzer, W., 2006. Quality of life in the European Union and the United States of America: Evidence from comprehensive indices. Applied research in quality of life, 1, pp.169-188.
- Goharipour, H., Karimi, M. and Barakpour, N., 2011, February. Evaluation of urban management performance based on citizen satisfaction with municipal services in city of Tehran. In International conference of social science and humanity, Singapore.
- Hasan, L., 2008. Cities and Quality of Life-Should We Monitor Pakistani Cities?. Available at SSRN 1097517.
- Hogg, R.V., Tanis, E.A. and Zimmerman, D.L., 1977. Probability and statistical inference (Vol. 993). New York: Macmillan.
- Keles, R., 2012. The quality of life and the environment. Procedia-Social and Behavioral Sciences, 35, pp.23-32.
- Khokhar, T. and Serajuddin, U., 2015. Should we continue to use the term “developing world”. World Bank Blogs, 16.
- Lee, Y.J., 2008. Subjective quality of life measurement in Taipei. Building and environment, 43(7), pp.1205-1215.
- Leitmann, J., 1999. Can city QOL indicators be objective and relevant? Towards a participatory tool for sustaining urban development. Local environment, 4(2), pp.169-180.
- Lotfi, S. and Koohsari, M.J., 2009. Measuring objective accessibility to neighborhood facilities in the city (A case study: Zone 6 in Tehran, Iran). Cities, 26(3), pp.133-140.
- Luger, M.I., 1996. Quality‐of‐life differences and urban and regional outcomes: A review. Housing policy debate, 7(4), pp.749-771.
- Lydick, E. and Epstein, R.S., 1993. Interpretation of quality of life changes. Quality of life Research, 2, pp.221-226.
- Majumder, A.K., Hossain, M.E., Islam, M.N. and Sarwar, M.I., 2007. Urban environmental quality mapping: a perception study on Chittagong Metropolitan City. Kathmandu university journal of science, engineering and technology, 3(2), pp.35-48.
- Dunning, H., Williams, A., Abonyi, S. and Crooks, V., 2008. A mixed method approach to quality of life research: A case study approach. Social indicators research, 85, pp.145-158.
- Marans, R.W., 2003. Understanding environmental quality through quality of life studies: the 2001 DAS and its use of subjective and objective indicators. Landscape and Urban Planning, 65(1-2), pp.73-83.
- Marans, R.W. and Stimson, R., 2011. An overview of quality of urban life. Investigating quality of urban life: Theory, methods, and empirical research, pp.1-29.
- McMahon, S.K., 2002. The development of quality of life indicators—a case study from the City of Bristol, UK. Ecological indicators, 2(1-2), pp.177-185.
- Mercer. (n.d.). Quality of living city ranking, viewed 5 July 2023, <https:// mobility exchange .mercer .com/Insights/quality-of-living-rankings>.
- Michalos, A.C., Sirgy, M.J. and Estes, R.J., 2006. Introducing the official journal of the international society for quality-of-life studies: Applied research in quality of life (ARQOL). Applied research in quality of life, 1, pp.1-3.
- Mittal, S., Khan, M.A., Romero, D. and Wuest, T., 2019. Smart manufacturing: Characteristics, technologies and enabling factors. Proceedings of the Institution of Mechanical Engineers, Part B: Journal of Engineering Manufacture, 233(5), pp.1342-1361.
- Mridha, A.M.M.H. and Moore, G.T., 2011. The quality of life in Dhaka, Bangladesh: Neighborhood quality as a major component of residential satisfaction. In Investigating quality of urban life: theory, methods, and empirical research (pp. 251-272). Dordrecht: Springer Netherlands.
- Liao, P.S., 2009. Parallels between objective indicators and subjective perceptions of quality of life: A study of metropolitan and county areas in Taiwan. Social indicators research, 91, pp.99-114.
- Namazi, P. S. (2009). Parallels between objective indicators and subjective perceptions of quality of life: A study of metropolitan and county areas in Taiwan. Social indicators research, 91, 99-114.
- Namazi-Rad, M., Perez, P., Berryman, M. and Lamy, F., 2012. An experimental determination of perceived liveability in Sydney.
- Nikoofam, M. and Mobaraki, A., 2020. Assessment of quality of life in the urban environment; case study: Famagusta, N. Cyprus. Civil Engineering and Architecture, 8(5), pp.860-872.
- Noll, G., 2000. Negotiating asylum: the EU acquis, extraterritorial protection and the common market of deflection (p. 644). Brill.
- O’Connor, H. and Gibson, N., 2003. A step-by-step guide to qualitative data analysis. Pimatisiwin: A Journal of Indigenous and Aboriginal Community Health, 1(1), pp.63-90.
- Ogneva-Himmelberger, Y., Rakshit, R. and Pearsall, H., 2013. Examining the impact of environmental factors on quality of life across Massachusetts. The Professional Geographer, 65(2), pp.187-204.
- Patil, G.R. and Sharma, G., 2022. Urban Quality of Life: An assessment and ranking for Indian cities. Transport Policy, 124, pp.183-191.
- Pazhuhan, M., Shahraki, S.Z., Kaveerad, N., Cividino, S., Clemente, M. and Salvati, L., 2020. Factors underlying life quality in urban contexts: Evidence from an industrial city (Arak, Iran). Sustainability, 12(6), p.2274.
- Rapley, M., 2003. Quality of life research. Quality of Life Research, pp.1-286.
- Rezvani, M.R., Mansourian, H. and Sattari, M.H., 2013. Evaluating quality of life in urban areas (case study: Noorabad City, Iran). Social indicators research, 112, pp.203-220.
- Rogerson, R.J., 1999. Quality of life and city competitiveness. Urban studies, 36(5-6), pp.969-985.
- Rogerson, W.P., 1997. Intertemporal cost allocation and managerial investment incentives: A theory explaining the use of economic value added as a performance measure. Journal of political economy, 105(4), pp.770-795.
- Sabir, S., Rafique, A. and Abbas, K., 2019. Institutions and FDI: evidence from developed and developing countries. Financial Innovation, 5(1), pp.1-20.
- Saha, S., Basu, S. and Pandit, D., 2020. Identifying factors influencing perceived quality of life (QoL) of Indian elderly: Case study of Kolkata, India. Social Indicators Research, pp.1-41.
- Santos, L.D. and Martins, I., 2007. Monitoring urban quality of life: The Porto experience . Social Indicators Research, 80, pp.411-425.
- Seik, F.T., 2000. Subjective assessment of urban quality of life in Singapore (1997–1998). Habitat international, 24(1), pp.31-49.
- Senlier, N., Yildiz, R. and Aktaş, E.D., 2009. A perception survey for the evaluation of urban quality of life in Kocaeli and a comparison of the life satisfaction with the European cities. Social indicators research, 94, pp.213-226.
- Sirgy, M.J., Widgery, R.N., Lee, D.J. and Yu, G.B., 2010. Developing a measure of community well-being based on perceptions of impact in various life domains. Social Indicators Research, 96, pp.295-311.
- Slavuj, L., 2011. Urban Quality of Life–a Case Study: the City of Rijeka. Croatian Geographical Bulletin, 73(1).
- Slottje, D.J., 1991. Measuring the quality of life across countries. The Review of economics and statistics, pp.684-693.
- Ülengin, B., Ülengin, F. and Güvenç, Ü., 2001. A multidimensional approach to urban quality of life: The case of Istanbul. European Journal of Operational Research, 130(2), pp.361-374.
- United Nations.(n.d. a). Goal 11: Make cities inclusive, safe, resilient and sustainable, viewed 10 July 2023, <https://www.un.org/sustainabledevelopment/cities/>.
- United Nations.(n.d. b). Around 2.5 billion more people will be living in cities by 2050, projects new UN report, viewed 10 July 2023, <https://www.un.org/en/desa/around-25-billion-more-people-will-be-living-cities-2050-projects-new-un-report#:~:text=The%20 report%20also%20estimates%20that,populous%20city%20on%20the%20planet>.
- Van Kamp, I., Leidelmeijer, K., Marsman, G. and De Hollander, A., 2003. Urban environmental quality and human well-being: Towards a conceptual framework and demarcation of concepts; a literature study. Landscape and urban planning, 65(1-2), pp.5-18.
- Veenhoven, R., 1996. Developments in satisfaction-research. Social indicators research, 37, pp.1-46.
- Veenhoven, R., 2004. World database of happiness. Challenges for quality of life in the contemporary world: Advances in quality-of-life studies, theory and research, pp.75-89.
- McGillivray, M. and MacGillivray, M. eds., 2007. Human well-being: Concept and measurement (p. 113). Basingstoke: Palgrave Macmillan.
- Okulicz-Kozaryn, A. 2013. City life: Rankings (livability) versus perceptions (satisfaction). Social indicators research, 110, pp.433-451.
- Veenhoven, R. (2007). Subjective measures of well-being. In Human well-being: Concept and measurement (pp. 214-239). London: Palgrave Macmillan UK.
- Wadi, R. and Furlan, R., 2017. The Quality of Urban Life (QOUL) of New-Salata Neighborhood in Qatar.
- Williams, A., Kitchen, P., Randall, J. and Muhajarine, N., 2008. Changes in quality of life perceptions in Saskatoon, Saskatchewan: comparing survey results from 2001 and 2004. Social Indicators Research, 85, pp.5-21.
- Wingo, L., 1973. The quality of life: toward a microeconomic definition. Urban Studies, 10(1), pp.3-18.
- Wish, N.B., 1986. Are we really measuring the quality of life? Well‐being has subjective dimensions, as well as objective ones. American journal of economics and sociology, 45(1), pp.93-99.
- World Bank. ( July 2023). Urban Development, viewed 10 July 2023, https:// www.world bank.org/en/topic/urban development/overview
- World Health Organization. (n.d.). WHOQOL: Measuring Quality of Life, viewed 10 July, 2023,<https://www.who.int/tools/whoqol/whoqol-bref#:~:text=WHO%20defines%20Qual ity%20of%20Life,%2C%20expectations%2C%20standards%20and%20concerns>.
- World Urbanization Prospects. (2018). United Nations, viewed 5 July 2023,<https:// smartnet.niua.org/sites/default/files/resources/wup2018-keyfacts.pdf>.
- Yuan, L.L., Yuen, B. and Low, C., 1999. Quality of life in cities–definition, approaches and research. Urban quality of life: Critical issues and options, pp.1-13.
- Zakerhaghighi, K., Khanian, M. and Gheitarani, N., 2015. Subjective quality of life; assessment of residents of informal settlements in Iran (a case study of Hesar Imam Khomeini, Hamedan). Applied research in quality of life, 10, pp.419-434.
- Zanella, A., Camanho, A.S. and Dias, T.G., 2015. The assessment of cities’ livability integrating human wellbeing and environmental impact. Annals of Operations Research, 226, pp.695-726.
- Zareei, J., Rezaeinia, H., Aftabi, Z. and Moghadam, M., Evaluation of General Indexes for Quality of Life (Case Study: Region 9 of Municipality of Tehran).
- Zhan, D., Kwan, M.P., Zhang, W., Fan, J., Yu, J. and Dang, Y., 2018. Assessment and determinants of satisfaction with urban livability in China. Cities, 79, pp.92-101.