Characterization of Fade Depth Due to Multipath Propagation at Microwave Band
- Sanyaolu, M. E.
- Ndubuisi, I. E.
- Popoola F. A.
- Owoyemi, S. I.
- 14-25
- Jan 29, 2024
- Information Technology
Characterization of Fade Depth Due to Multipath Propagation at Microwave Band
1Sanyaolu, M. E., 1Ndubuisi, I. E., 2Popoola F. A., 3Owoyemi, S. I.
1Department of Physical Sciences, Redeemer’s University, Ede, Osun State, Nigeria
2Department of Mathematical and Physical Sciences, Glorious Vision University, Ogwa, Edo State, Nigeria
3Department of Integrated Science, Adeyemi Federal University of Education, Ondo, Ondo State, Nigeria
DOI: https://doi.org/10.51584/IJRIAS.2024.90102
Received: 12 December 2023; Revised: 27 December 2023; Accepted: 30 December 2023; Published: 28 January 2024
ABSTRACT
The incidence of multipath fading in two Nigerian cities is explored in this study utilising the geoclimatic factor technique and ITUR Recommendation P530-14. Nigerian cities Abuja and Yola are being considered for the study. Two years (2019- 2020) of radiosonde data obtained from the Nigerian Meteorological Agency (NIMET) are used. The estimation of the amount of time a certain fade depth is underestimated was presented which leads to outage probability due to atmospheric multipath propagation, assuming the given fade depth leads to the received signal falling below the squelch level. The Inverse Distance Square (IDS) approach was utilized for calculating point refractivity gradients that were not exceeded for 1% of the time at 65 m above the ground for the selected two cities in Nigeria. The findings reveal that the point refractivity gradient and the geoclimatic component vary on a monthly, seasonal, and annual basis. It is also seen that the fade depth revealed that the maximum risk of duct occurrence is much higher in Abuja compared to Yola.
Keywords: Fade depth, multipath propagation, Point refractivity, climatic change, wireless networks
INTRODUCTION
In a system for wireless communication, the transmitted signal is capable of traveling along multiple paths due to reflections, refractions, and diffractions in the environment. These multiple paths can cause constructive or destructive interference, resulting in variations in the received signal strength. The multipath theory explains that the severity of deterioration is determined by the strength and phase ranges of signal components entering a receiver via different paths [1].
In wireless communications, the study of fade depth is an important topic. A major contributor to the performance deterioration of wireless communication systems is fading, or the random variation in a signal’s amplitude, phase, or frequency caused by the propagation medium [2]-[3]. According to [4], fade depth is the amount of attenuation or fading that occurs in the received signal in comparison to the transmitted signal, because they make it easy to connect voice, data, video, and IoT (Internet of Things) devices anywhere. Wireless communication systems have become an essential part of modern society. However, these systems are susceptible to a variety of fading that has the potential to result in signal degradation, increased error rates, and connectivity loss [5]- [7]. Variations in signal strength and or delay over time and space are a result of fading, which can be brought on by factors such as multipath propagation, atmospheric conditions, and obstructions in the transmission path.
The distortion profundity is a significant measurement for evaluating the presentation of remote correspondence frameworks, as it can influence different framework boundaries, for example, bit error rate, motion toward commotion proportion, and blackout likelihood [8]. Blurring alludes to the constriction or contortion of a radio transmission because of changes in the engendering climate. When changes in the propagation environment affect the signal strength or quality, fading occurs in wireless communication systems. “The variation in received power or signal-to-noise ratio that results from the interaction of a radio signal with the medium over which it is transmitted,” as defined by [9], is the definition of fading. [10] in their study implied that fading is the signal strength loss caused by the signal’s attenuation and interference as it moves through the propagation environment. Fading results in information being lost and lowers the communication link’s reliability and quality [11]. It may be challenging to maintain a dependable communication link as a result of this, as the signal’s quality and strength may fluctuate over time and in other instances cause a total outage which could take some time to restore [12].
[13] states that the ratio of peak signal strength to minimum detectable signal power is widely used to determine the depth of fading, hence it is a measure of the severity of fading in a wireless communication system. According to the authors, a variety of factors, including the distance between the transmitter and receiver, the frequency of the signal, and the presence of obstacles or other environmental factors, can influence the severity of fading. The system’s ability to reliably transmit data may be impacted by the fact that the severity of fading can vary depending on the propagation environment. The authors also emphasized the significance of selecting the right modulation and coding schemes to lessen the effects of fading and enhance the communication link’s reliability and quality.
A few studies have explored the effect of distorting on remote correspondence frameworks and proposed different moderation procedures. For instance, [14] gives an outline of remote correspondence frameworks and their presentation constraints because of blurring, commotion, and obstruction. [15] described the plan and examination of correspondence frameworks within the sight of blurring and different degradation, utilizing strategies like variations and coding. Modern digital and analog communication systems, including wireless systems and fading channels, are discussed in depth in [16]. Research on fading profundity has been done in both hypothetical and experimental areas. Analytical models for describing the statistical properties of fading and modeling the fading process have been the focus of theoretical research [17]-[18]. Trial studies have zeroed in on estimating the blur profundity in genuine remote correspondence channels and creating experimental models for anticipating the blur profundity under various circumstances [19].
In a study by [20], the authors investigated the impact of several fading conditions, including Rayleigh, Rician, and Nakagami-m, Coordination Communication System Performance. The authors found that the severity of fading, as measured by the fade depth, had a significant impact on the error performance of the communication link. The authors also proposed a helpful diversity scheme that can mitigate the effects of fading and improve the reliability of the communication link.
A different study, [21] looked at how fade depth affects how well visible light communication (VLC) systems work. The authors measured the strength of the received signal under various fade depth conditions with an experimental setup. The authors discovered that the VLC system was more susceptible to fading at higher frequencies and that the system’s bit error rate (BER) was significantly affected by the fade depth. The researchers proposed a channel calculation that can reduce the impacts of fading.
[22] studied how wireless sensor networks (WSNs) perform with fade depth. A WSN’s performance was simulated by the authors under several fading conditions, such as Rayleigh, Rician, and Nakagami-m fading. The authors discovered that the WSN’s energy consumption and packet loss rate were significantly influenced by the severity of fading.
However, despite the research that has been done in Nigeria so far, accurately measuring and predicting fade depth in real-world wireless communication channels remains difficult due to the environment’s complexity and the dynamic nature of the geographical area. As a result, additional research, and evaluation of various approaches to measuring and predicting fade depth, as well as the factors that influence their accuracy, are required. There is still a need to learn more about the statistical properties of fade depth in different kinds of fading channels and how it affects how well communication systems work wirelessly. There is a need to develop effective techniques for mitigating the effects of fade depth in wireless communication systems as well as accurate methods for measuring and predicting fade depth. This study aims to address these knowledge gaps by providing insights into Identifying effective methods for reducing the effects of fading depth to minimize its influence on system performance and evaluating the accuracy of methods for measuring and predicting fade depth in real-world wireless communication channels. The discoveries of this study can assist with working on the plan and execution of remote correspondence frameworks and add to the advancement of more dependable and productive remote correspondence technologies.
METHODS
In this work, two years (2019 to 2020) data on meteorological parameters, namely, air temperature, pressure, and humidity are obtained from the Nigerian Meteorological Agency (NIMET) for Abuja, located at 9.0765° N, 7.3986° E and Yola located at 9.209 ° N, 12.4782° E. in Nigeria. The NIMET meteorological parameters data are obtained using radiosonde. The radiosonde is an airborne weather station with an inbuilt radio transmitter. The radiosonde is launched on a daily basis and as it ascends from ground level. it measures the meteorological parameters every six (6) seconds from the surface to one hundred meters (100 m) in altitude in clear air (that is, without rain, fog, or snow). At the same time, it transmits the measured values to the appropriate ground station where the data are further processed [23].
The ITU-R model has undergone continuous evaluations, leading to continuous improvements in its prediction capabilities. It estimates outage probability by analyzing the atmospheric refractivity index in clear air. The radio refractivity index (also known as ‘n’) is the ratio of velocity in a given medium to velocity in free space [22]. The radio refractivity index ‘n’ is around 1.000312, slightly more than unity, under ordinary atmospheric circumstances at the Earth’s surface.
The International Telecommunication Union Recommendation [24] specifies a general model for calculating atmospheric refractivity ‘N’ and atmospheric water vapour pressure ‘e,’ which is given by:
N = (n – 1) (106) (1)
where n is the refractive index
N =77/T ( P + 4810 (e/T)) (2)
e = (6.112 H)/100 exp (17.5 t)/(t+240.98) (3)
in these equations:
T represents the absolute temperature,
p represents the atmospheric pressure,
e represents the water vapor pressure,
H represents the relative humidity, and
t represents the atmospheric temperature in Celsius.
The point refractivity of the atmosphere varies with height, and the point refractivity gradient describes how the radio refractivity index changes with height. The point refractivity gradient in the first 65 metres from the ground is calculated using [25].
dN1 = (N2-N1)/(h2-h1 ) (4)
Where N2 is the refractivity at 100 m
N1 is the refractivity at ground level
h2 = 65 m
h1 = ground level
Inverse Distance Weighting (IDW) is a method of spatial interpolation that is employed in data analysis when a collection of missing points or no observations is available.
![]() (5)
(5)
i represented the value approximated with respect to the observed points,x0, n is the total number of points that were sampled. Z is the known value at the sampled point, λi and xi are the weighting parameters.
 (6)
(6)
di denotes the distance between xo and xi, n is as mentioned earlier, and p is the power factor.
The Geoclimatic factor K was calculated using [26]
K = 10(-4.6-0.0027dN1) (7)
The following calculation is used to predict the percentage of time (pw) that fade depth A (dB) is surpassed in the average worst month for detailed design applications using the [27]
![]() (8)
(8)
where f is the frequency in GHz, hL is the altitude of the lower antenna (i.e., the smaller of he and hr).
To calculate the path inclination’s magnitude |εp| (in milliradians, mrad), the following formula is employed:
![]() (9)
(9)
Where d is the path length in (Km), he is the height of the transmitter antenna height and hr is the receiving antenna height.
In this study, the frequency used is 15 GHz, the antenna height is 120 meters, the receiving antenna is 50 meters and the path length is 30 km. We employed the ITU-R method for quick planning with an overall standard deviation of error in predictions of 5.9 dB. The precision in the prediction will increase if the ITU-R method for detailed link design, which requires that the terrain data be used. The overall standard deviation of error for the detailed applications method is 5.7 dB [27].
RESULTS AND DISCUSSION
Radiosonde balloons are launched two times every day, around 10 and 11 p.m. However, in some months, this data was only provided once every day. Data is displayed three times a day in some particular cases to highlight the inconsistency of the monthly samples utilized for the analysis. In general, the key statistics of propagation effects for the design of radio communication systems indicated the worst month. The worst month of the year for any performance degrading mechanism is the month in which the threshold is exceeded for the longest period of twelve consecutive calendar months. It should also be highlighted that the worst month for each threshold level is not always the same.
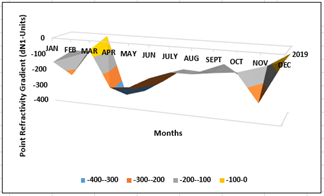
Fig. 1: Monthly variation of point refractivity gradient in the lowest 100 m of the atmosphere not exceeded for 1% of an average year for Yola.
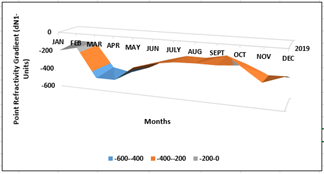
Fig. 2: Monthly variation of point refractivity gradient in the lowest 100 m of the atmosphere not exceeded for 1% of an average year for Abuja.
Figures 1 and 2 show monthly shifts of the point refractivity gradient between Abuja and Yola during the rainy season for two years. As a result of the outcome, point refractivity rates appear to fluctuate year to year as well. From the results of this study, the year 2019 has the lowest value of point refractivity gradient, and the value gets less negative in the following year at both locations.
Figure 1 shows that the highest point refractivity was detected in Yola in 2019, while the lowest point was recorded in 2020. The mean point refractivity gradient during the two years is predicted to be -98 N-units/Km. This is attributed to the climatic changes during that period. Yola experienced very low precipitation in the year 2019.
Figure 2 shows the results obtained from the computed point refractivity gradient values in regard to the average amount of monthly records. From March to August, high levels of point refractivity were recorded for Abuja, owing to the presence of high humidity beginning in March, and as a result, there is a lot of water vapor in the atmosphere, which could be attributed to the convective and occasionally thunderstorm forms of rain that were seen during this time. Due to heavy rainfall in the months preceding the event, the atmosphere experiences a lifting of the boundary layer, with significant amounts of water vapor present in the atmosphere [28].
The values of point refractivity were also seen to be low during the dry season. Figure 2 depicts the monthly change of point refractivity at the start of the dry season in October, revealing an erratic oscillation. The measured point refractivity gradients are projected to diminish by December as the harmattan haze begins to take impact and becomes intense. These findings are in agreement with the works of [22]-[23], [28]-[30]. 2011).
The point refractivity gradients at Yola in the year 2019 vary greatly; the highest value of -34.31 N-units/Km was recorded in December, while the lowest value of -282.765 N-units/Km was recorded in November. The results also agree to an extent with the global ITU map which theoretically gives the threshold of d in these coordinates to be -273.2 N-units/Km. However, the variations in the values call for attention to optimizing the performance of digital terrestrial point-to-point links in Yola.
Table I: Worst months values
| Locations | Worst months | Point refractivity gradient | Geoclimatic factor |
| Abuja | April | -486.556 | 1.74997 E-05 |
| Yola | April | -391.314 | 1.89518 E-05 |
Table II: Geo climatic factor (K) for Abuja
| Months | 2019 | 2020 | Average |
| Jan | 2.08296 E-05 | 2.13329 E-05 | 2.10813 E-05 |
| Feb | 2.07967 E-05 | 2.16182 E-05 | 2.12074 E-05 |
| Mar | 1.81725 E-05 | 1.8504 E-05 | 1.83382 E-05 |
| Apr | 1.75226 E-05 | 1.74997 E-05 | 1.75112 E-05 |
| May | 1.73244 E-05 | 1.73391 E-05 | 1.73317 E-05 |
| Jun | 1.76058 E-05 | 1.7603 E-05 | 1.76044 E-05 |
| Jul | 1.77886 E-05 | 1.77568 E-05 | 1.77727 E-05 |
| Aug | 1.79086 E-05 | 1.79794 E-05 | 1.7944 E-05 |
| Sep | 1.77056 E-05 | 1.79038 E-05 | 1.78047 E-05 |
| Oct | 1.77981 E-05 | 1.77554 E-05 | 1.77768 E-05 |
| Nov | 1.8038 E-05 | 1.94731 E-05 | 1.87555 E-05 |
| Dec | 2.06915 E-05 | 1.98713 E-05 | 2.02814 E-05 |
Table III: Geo climatic factor (K) for Yola
| Months | 2019 | 2020 | Average |
| Jan | 2.24131E-05 | 2.22516E-05 | 2.23323E-05 |
| Feb | 2.24847E-05 | 2.24001E-05 | 2.24424E-05 |
| Mar | 2.13226E-05 | 2.16739E-05 | 2.14983E-05 |
| Apr | 1.94716E-05 | 1.89518E-05 | 1.92117E-05 |
| May | 1.79374E-05 | 1.80616E-05 | 1.79995E-05 |
| Jun | 1.80404E-05 | 1.82402E-05 | 1.81403E-05 |
| Jul | 1.82362E-05 | 1.82916E-05 | 1.82639E-05 |
| Aug | 1.83257E-05 | 1.83887E-05 | 1.83572E-05 |
| Sep | 1.82134E-05 | 1.81703E-05 | 1.81919E-05 |
| Oct | 1.81742E-05 | 1.89434E-05 | 1.85588E-05 |
| Nov | 1.99107E-05 | 2.11792E-05 | 2.0545E-05 |
| Dec | 2.19377E-05 | 2.20277E-05 | 2.19827E-05 |
Table 1 summarizes the month with the highest point refractivity gradient readings and associated geo climatic parameters K numbers. Tables 2 to 3 tabulate the geo climatic factor K values for each month of the two-year study period for the two locations. The values of geo climatic factors are, as expected, inverse to those of point refractivity gradients. It should be noted that to estimate the average values of the geo climatic factor, we first calculate the average of the point refractivity gradient values and then use equation (8) to approximate the geo climatic factor values. Seasonal assessment of the point refractivity gradient is typically recommended by ITU-R P.453-9 (ITU-R, 2003).
When designing terrestrial line-of-sight systems, a fade margin that allows for multipath fading must be integrated into the connection planning. Multipath fading as proposed by the ITU-R (ITU 2015) specified that the frequency of operations, route length, path inclination, and geoclimatic factors in the region must all be considered. The fading edge differs with the geological component and as such, according to the ITU Recommendation, determining the geoclimatic factor (K) value reliably predicts multipath fade from local data.
The value of K in the worst month is a significant factor in determining the multipath fade margin. It has to do with the month having the highest K value. Tables 2 and 3 demonstrate the monthly variations in geoclimatic factor for the two cities studied. For Yola, the months of January and February in the year 2019 give a high value of K, with a peak of K=2.24847E-05 in February.
In Abuja, the high value of K takes place in January, February, and December with a peak K=2.08296E-05 in January.
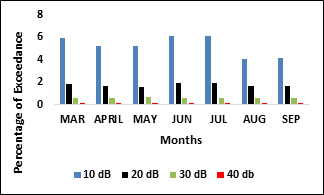
Fig 3: Percentage of time a certain fade depth A (dB) in wet months in Abuja in the year 2019
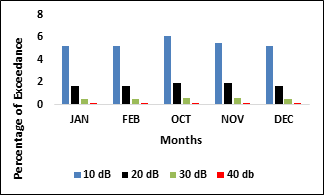
Fig. 4: Percentage of time a certain fade depth A (dB) in dry months in Abuja in the year 2019
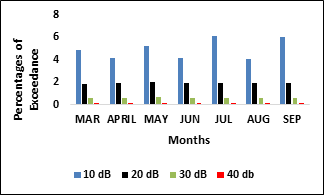
Fig. 5: Percentage of time a certain fade depth A (dB) in wet months in Abuja in the year 2020
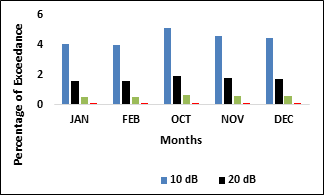
Fig. 6: Percentage of time a certain fade depth A (dB) in dry months in Abuja in the year 2020
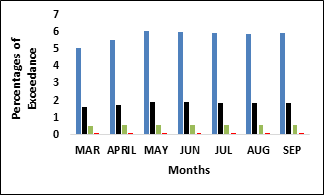
Fig. 7: Percentage of time a certain fade depth A (dB) in wet months in Yola in the year 2019
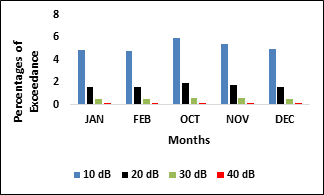
Fig 8: Percentage of time a certain fade depth A (dB) in dry months in Yola in the year 2019
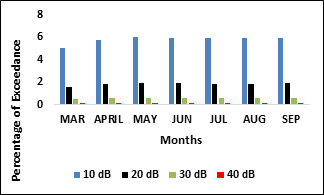
Fig 9: Percentage of time a certain fade depth A (dB) in wet months in Yola in the year 2020
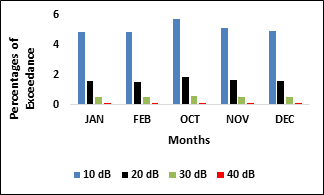
Figure 10: Percentage of time a certain fade depth A (dB) in dry months in Yola in the year 2020
Understanding fading processes is critical in the design and performance of wireless systems. For a reliable terrestrial link, microwave link attenuation owing to multipath must be predicted. As previously established, multipath fading is a normal phenomenon that can only be identified statistically. The ITU-R approach is used to compute the percentage of time a particular fade depth is exceeded and fading occurrences can be predicted at a given fade depth or percentage of the outage. Geoclimatic factor K values established in preceding subparagraphs have been utilized to anticipate the percentages of time that a certain fade depth has been exceeded using a frequency of 15 Ghz, transmitter height of 120 m and receiver height of 50 m and the link distance was 30 km.
Figure 3 and Figure 4 show seasonal variation of the percentage of time various values of fade depth are exceeded in Abuja in 2019 while Figure 5 to Figure 6 indicates the same for Abuja in 2020. It can also be seen that for Yola as shown in Figure 7 to Figure 10, the percentage of time that a certain fade depth varies from season to season. Due to this, the ITU-R [3] recommends planning around the worst month. In considering the worst month for both the locations, Abuja has higher percentages of occurrence than Yola.
Fade depth is exceeded due to the geoclimatic factor K in each of the locations studied. Figure 3 shows the wet months in Abuja in 2019 where the worst month occurred in June. In 2019, the worst month for Abuja is October for the dry season as seen in Figure 4. The worst month for Yola in 2019 during the wet season was May as seen in Figure 5 while the peak during the dry season occurred in October. This correlates well with the work of Akinloye et al., (2016), which revealed that the maximum risk of duct occurrence was determined to be in February. ITU-R (ITU-R, 2003) verifies this for the likelihood of duct occurrence. The occurrence of ducts is highly correlated with multipath fading.
CONCLUSIONS
Multipath fading was investigated in this study in correlation to the distribution of point refractivity gradient in the lowest 65 m above ground. The Inverse Distance Square (IDS) method was used to approximate the values where there were missing points. It was discovered that the suggested point refractivity for the regions is less than the ITU-R for the locations selected in Nigeria.
The worst month values gradient of point refractivity for Abuja and Yola are -486.556NU/km and -391.314NU/km, respectively, in April. The various values of point refractivity gradients were utilized to forecast geoclimatic factor K for distinct regions. It was established that the Geo-climatic conditions within the multipath fading distribution vary by month, season, and year in connection to geographical and climatic variables. The geoclimatic factor played a key role sin more precise forecasts of fading occurrences. Furthermore, studies reveal that the worst month in many parts of Nigeria changes annually and usually occurs around the rainy season months.
ACKNOWLEDGMENT
We appreciate the Nigerian Meteorological Agency (NIMET) for making the data used for this study available for research purposes.
REFERENCES
- Djuma, S. (2012). Clear-air microwave signal prediction on terrestrial paths in Central Africa using existing models. M.Sc. Thesis, National University of Rwanda, September 2012.
- Israel, E., A. Babatunde and D.A. Kayode, (2018). Estimation of refractivity gradient and geoclimatic factor k for radio link design in Nigeria. Phys. Sci. Int. J., 19(2): 1-9.
- Goldsmith, A. J. 2005. Communications over radio waves. Press of Cambridge University.
- Sanyaolu, M.E., Dairo, O.F., Willoughby, A.A. and Kolawole, L.B. (2020). Estimation of Rain Fade Durations on Communication Links at Ka-band in Equatorial and Tropical Regions, Telecommunications and Radio Engineering, 79(2): pp 129-141. https://doi.org/10.1615/TelecomRadEng.v79.i2.50
- Grabner, M., V. Kvicera, P. Pechac and M. Mudroch, (2010). Multipath fading measurement and prediction on 10 GHz fixed terrestrial link. Proceeding of 15th Conference of Microwave Techniques COMITE, 2010.
- Sanyaolu, M.E., Dairo, O. F., Soge, A. and Willoughby, A.A. (2021), Prediction of Rain-Induced Attenuation Along Earth-Space Links at Millimetre Wave Bands over West African Region. Telecommunications and Radio Engineering, 80(11): pp35–62. https://doi.org/10.1615/TelecomRadEng.2022041459
- Sanyaolu Modupe Eunice, (2021), Evaluation of Vertical Refractivity Profile Over Microwave Link in Mowe, Nigeria, International Journal of Microwave Engineering, 6(1). https://doi.org/10.5121/Jmicro.2021.6401
- Willoughby, A. A., Sanyaolu, M. E., Osinowo, M. O., Soge, A. O., Dairo, O. F. (2022). Estimation of some Radio Propagation Parameters using Measurements of Surface Meteorological Variables in Ede, Southwest Nigeria. Journal of the Nigerian Society of Physical Sciences. 5 (2023) 875. https://doi.org/10.46481/jnsps.2023.875
- Rappaport, T. S. (2002). Communication over the air: Second Edition of Principles and Practice Pearson Education.
- Iniobong, J.E., C.U. Mfonobong and U.C. Iwuchukwu, (2016). Determination of refractivity gradient and geoclimatic factor using radiosonde data and inverse distance weighting spatial interpolation for missing data. Int. J. Syst. Sci. Appl. Math., 1(4): 76-81
- Abdulwahab, A. K., Y. Musa, O. O. Khalifa, and in fading channels, cooperative diversity for wireless sensor networks. 8(4), 627-638, Journal of Ambient Intelligence and Humanized Computing.
- Goldsmith, Andrew J. Remote Correspondences. Press of Cambridge University
- Fashuyi, M.O., P.A. Owolawi and T.J. Afullo, (2006). Rainfall rate modeling for LOS radio systems in South Africa. South Afr. Inst. Elect. Eng. (SAIEE), 97(1): 74-81.
- Proakis, J. G., and M. Salehi (2007). Fifth edition of Digital Communications McGraw-Hill.
- Akinloye, B.E., H.J. Enyenihi and I.A. Ezenugu, (2016). Estimation and comparative analysis of atmospheric refractivity and fade depth for microwave links in Calabar. Int. J. Syst. Sci. Appl. Math., 1(4): 82-85.
- Ding, B. P. Lathi, and others. (2009). Communication systems that are both digital and analog today. Press of Oxford University.
- Sanyaolu, M. E., Dairo, O. F. Willoughby, A. A., and Akinyemi, G. A. (2021). Characteristics of rain fade slope on microwave communication in Mowe, Nigeria, Journal of Physics: Conference Series, Volume 2034, 7th National Annual Conference of the International Union of Radio Science-NIGERIA (URSI-NG 2021). . https://doi.org/10.1088/1742-6596/2034/1/012003
- Sanyaolu, M.E. (2022), Performance of Rain- Induced Attenuation Prediction Models for Terrestrial Link in Cameroon. International Journal of Engineering Applied Sciences and Technology, 7(1):17-25. https://doi.org/33564/IJEAST.2022.v07i01.003
- Sanyaolu Modupe Eunice, Sanyaolu Olufemi (2022). Seasonal and latitudinal variations of surface radio refractivity over Nigeria, Indonesian Journal of Electrical Engineering and Computer Science, 28(3), pp. 1548~1553. https://doi.org/10.11591/ijeecs.v28.i3
- Khan, A. A. Nasir, H. M. Alghamdi, and M.S. (2019). Alouini Cooperative system performance in a variety of changing environments. 7, 157224-157238, IEEE Access.
- Liu, J. Zhao, and S. Guo. Performance of visible light communication systems affected by fading depth. Optik, 133, 119-125.
- Valma, E. Tamosiunaite, M., Tamosiunas, S., Tamosiuniene, M., and Zilinskas, M. (2011). Variation of radio refractivity with height above ground. Elektronika ir Elektrotechnika, 111 (5), 23-26.
- Bettouche, Y., Agba, B. L., and Kouki, A. B. (2014). Geoclimatic factor and point refractivity evaluation in Quebec-Canada. In General Assembly and Scientific Symposium (URSI GASS), 2014 XXXIth URSI (pp. 1-4). IEEE (2014, August).
- International Telecommunication Union Recommendation ITU-R P.453-11, Geneva,
- International Telecommunication Union Recommendation ITU-R 530-16, Geneva.
- ITU-R, (2012). Propagation data and prediction methods required for the design of terrestrial line-of-sight systems. Recommendation of ITU-R P.530-14, Geneva
- ITU-R, (2003). The radio refractivity index: Its formula and refractivity data. Recommendation of ITU-R P.453-9, Geneva, Switzerland.
- Ojo, O. L., Ajewole, M. O., Adediji, A. T., and Ojo, J. S. (2015). Estimation of clear-air fades depth due to radio climatological parameters for microwave link applications in Akure, Nigeria. International Journal of Engineering and Applied Sciences, 7(3). ISSN2305-8269
- Sanyaolu, Modupe Eunice (2023), Tropospheric Scintillation Predictions of the Nigerian Climate; A Case Study of Mowe, Ifo Local Government, South West Nigeria. Nigerian Journal of Environment and Health 3, 55–63. https://njeh.lsfnigeria.org/vol3-no1/
- Odedina, P.K. and T.J.O. Afullo, (2007). Use of spatial interpolation technique for determination of geoclimatic factor and fade depth calculation in Southern Africa. Proceeding of IEEE AFRICON Conference. Windhoek, Namibia.