
Hybrid Exponential Type Estimators of Finite Population Mean in Double Sampling
- T. UBA
- 453-472
- Mar 13, 2025
- Education
Hybrid Exponential Type Estimators of Finite Population Mean in Double Sampling
T. UBA
Department of Statistics, Joseph Sarwuan Tarka University Makurdi, Benue State, Nigeria
DOI: https://doi.org/10.51584/IJRIAS.2025.10020041
Received: 23 January 2025; Accepted: 03 February 2025; Published: 15 March 2025
ABSTRACT
In this study, two-auxiliary exponential type estimators of finite population mean in Two-phase are proposed. The proposed estimators are extension of (1) estimator finite population mean in SRS to Two-phase sampling. The study investigated efficiency of the proposed estimators by utilizing the ratio of bias to standard error (RBSE) as a proxy to examine confidence limits for estimates. The expressions for the bias and Mean Square Error (MSE) of the estimators were derived. A comprehensive simulation study was carried out to show the efficacy of the estimators as compared to conventional estimators using Coefficient of Variation as a performance measure. Furthermore, a small sample from real data set was utilized to validate the performance of proposed estimators under two varying correlation coefficients amongst variables in the parameter space. The results of both the simulation study and real life studies have shown that the proposed estimators were not only asymptotic, more efficient but produces estimates that are more precise than most of the existing estimators considered in this study.
Keywords: Bias, Correlation Coefficient, Asymptotic Relative Efficiency, Ratio of Bias to Standard Error, Regression Estimators.
INTRODUCTION
In survey sampling, estimators are widely used within the design-based mode of inference both at the design and estimation stages for large-scale surveys (2). There are situations whereby single-auxiliary estimators of finite population characteristics, may not be efficient (3). In such situations there may be need to utilize multi-auxiliary variables that are correlated with the study variable in order to improve the sampling design and estimation. It may also be of interest to combine sampling techniques in a single survey in order to obtain the desired information, (4).
Basically, is known that the use of auxiliary information in survey sampling improves the precision of estimates of population parameters such as population total, population mean, population proportion, and so on (5). The usual estimators that use auxiliary information are the traditional ratio, product and regression estimators respectively as well as their improved or hybrid versions. When there is a positive correlation between the study variable and the auxiliary variable, the use of the classical ratio estimator is appropriate. On the other hand, if the correlation is negative, classical product estimator is preferable. Conversely, the regression estimator is used to estimate the population characteristics of interest when the regression line of the study variable and the auxiliary variable does not pass through the origin, but makes an intercept along the y-axis.
According to (6), John Graunt is believed to be the first to use auxiliary information in the 1660s for estimating the population England. Detailed work on auxiliary information were established in the work by (7), not forgetting the work on the classical ratio estimator by (8). (9) noted that the estimation of population parameters with greater precision is a relentless matter in sampling theory and that the precision of estimates can be improved by increasing the sample size but at the expense of the benefits of sampling hence the use of auxiliary information. In many practical situations, the regression line does not pass through the origin. As such the ratio and product estimators do not perform equally well as compared to the regression estimator. For this reason, many authors such as (10), (11), (12) among many others have suggested modified ratio estimators in order to provide better alternatives. Recently, the use of auxiliary variable has enjoyed a boost due to exponentiation of the auxiliary variable in the work of (13), (14), (15), and so on. (16) introduced modifications of the exponential ratio estimator by using some transformations of the auxiliary variables. Exponentiation is widely applicable to ratio, product and regression estimators or a mixture (hybrid) of these, and appears to improve the precision of parameter estimates even when the relation between the study variable and the auxiliary variable is weak.
Under many sampling schemes, several exponential estimators, using the population information of the auxiliary variable, have been developed. However, if the information on the population mean of auxiliary variable is not readily available, two-phase (double) sampling method is the most appropriate sampling scheme to be adopted. It is cost effective, and is typically used when it is expensive to collect data on the variable of interest but relatively cheaper to collect variables that are correlated. If the population mean, X ̅ of the auxiliary variable x is not known prior to the commencement of the survey, then it is appropriate to employ the two-phase sampling scheme. The following authors have proposed improved versions of the ratio exponential, regression exponential, or a regression-cum-ratio exponential type estimators using one or more auxiliary variables under double sampling, and these include the works by (17), (18). Taking a cue from the work of (19), (20) developed a computational approach to generalized estimator of population mean in double sampling using correlation coefficient between the study variable and the auxiliary variable. This generalized ratio estimator is a product of the mean of the study variable, the ratio estimator and suitable chosen constants such that their sum equals unity. This generalized estimator performed better than the sample mean, the classical ratio and the (19) estimators respectively, in terms of minimum mean square error. Another interesting hybrid estimator of finite population mean under Two-phase sampling is that of (21). This Regression-cum-ratio estimator takes advantage of the fact that it is easy to construct regression equation of y against x or y against z and using the known correlation coefficients between the auxiliary variables as additive factor to the second variable. The study examines the possibilities of different forms of auxiliary information derived from the remote sensing data in two phase sampling design and suggest an appropriate estimator that will be of broad interest and application.
Recently, (15) constructed an estimator of finite population mean in Two-phase sampling for stratification using the idea of chain-ratio estimators. The new improved estimator performed better than some selected unbiased standard estimators both in theoretical, natural and simulated populations. Similarly, (22) developed an efficient exponential chain ratio estimator for estimating finite population mean of the study character using imputation of missing data under two-phase sampling. While (23) proposed mixed estimators of finite population mean in Two-phase sampling using two auxiliary variables, they cautioned that purpose of mixture and conditions for which the individual estimators are developed must be stated and efficiency must be the target. (24) in their study proposed ratio-in-regression estimator of the mean using mean of the study and the auxiliary variables together with the rank of the auxiliary variable. In Two-phase sampling.
MATERIALS AND METHODS
Description of two-phase sampling design
Consider a finite population of N units, ![]()
![]() and
and ![]()
![]() , denote the values of the
, denote the values of the ![]() unit of the characters
unit of the characters ![]() and
and ![]() respectively. Here, y is our variable of interest (study variable), x and z are the auxiliary variables that can be correlated with our variable of interest. Let
respectively. Here, y is our variable of interest (study variable), x and z are the auxiliary variables that can be correlated with our variable of interest. Let ![]() be the first phase sample of size
be the first phase sample of size ![]() from the population of size
from the population of size ![]() according to a simple random sampling without replacement (
according to a simple random sampling without replacement (![]() ) scheme, and
) scheme, and ![]() ,
, ![]() ,the sample means of the two auxiliary variables are observed. Let
,the sample means of the two auxiliary variables are observed. Let ![]() be the second phase sample of size
be the second phase sample of size ![]() from the first phase sample
from the first phase sample ![]() , and y, x, and z are observed. We also define:
, and y, x, and z are observed. We also define: ![]() The parameter subspace, (
The parameter subspace, (![]() ) and
) and ![]() : the parameter subspace, (
: the parameter subspace, (![]() ), where,
), where, ![]() : Correlation coefficient between Y and Z,
: Correlation coefficient between Y and Z, ![]() : Correlation coefficient between X and Z,
: Correlation coefficient between X and Z, ![]() : Correlation coefficient between Y and X.
: Correlation coefficient between Y and X.
Expectation under Two-Phase Sampling
We define the relative error in the first phase as follows:
![]()
Thus,
![]()

where,
![]()
are the sampling fractions for the first and second sampling fractions respectively, (20).
EXISTING ESTIMATORS IN LITERATURE
(i) Classical regression estimator in two-phase sampling (8)
![]()
![]()
(ii) Regression type estimator in two-phase sampling
The (25) regression type estimator for two-phase sampling is an extension of (26) estimator in survey sampling. It is given as:
![]()
![]()
![]()
![]()
where:

(iii) Ratio-chain type exponential estimator
Motivated by (27), (28) suggested the modified exponential ratio estimator to estimate finite population mean of study variable ![]() in presence of two auxiliary variables,
in presence of two auxiliary variables, ![]() and
and ![]() . This estimator is given by
. This estimator is given by


![]()
![]()
![]()
where:
![]() ,
, ![]() ;
; ![]() , and
, and ![]() .
.
(iv) Exponential Chain ratio-type estimator in double sampling
(29) proposed a class of improved exponential chain ratio and product-type estimators of finite population mean ![]() under Double (Two-phase) sampling scheme. The exponential chain ratio type estimator is given by:
under Double (Two-phase) sampling scheme. The exponential chain ratio type estimator is given by:

where, ![]() and
and ![]() are suitably chosen constants. The bias of the exponential chain ratio estimator is given as:
are suitably chosen constants. The bias of the exponential chain ratio estimator is given as:

![]()
![]()
where,
![]()
PROPOSED ESTIMATOR UNDER TWO-PHASE SAMPLING SCHEME
By extending the [29] estimator of finite population mean in SRS, we propose the following hybrid exponential type regression-cum-ratio estimators of finite population mean in Two-phase random sampling under two conditions.
Case I: Proposed estimator under Two-phase sampling when auxiliary variables are not transformed
When the auxiliary variables are not transformed, our proposed alternative hybrid regression-cum-ratio exponential type estimator under of population mean under Two-phase sampling without replacement is given by:

where, ![]() and
and ![]() are suitably constants which minimize the MSE of
are suitably constants which minimize the MSE of ![]() .
.
We define:
We define the relative error in the first phase as follows:
![]() ;
; ![]() ;
; ![]()
Theorem 1:
The bias of the proposed alternative hybrid regression-cum-ratio exponential type estimator under Two-phase sampling without replacement when the variables are not transformed is given by:

Proof of Theorem 1:
Consider the expression in equation (15) above. Inserting the appropriate definitions of section 2 into the following expression, we have:


![]()
![]()
Expanding the exponential part of (17a) gives:
![]()

Taking expectation on both sides of (17b) and applying the definitions in (3) gives
![]()
![]()
![]()
![]()
![]()
![]()
![]()
Theorem 2:
The Mean Square Error (MSE) of the alternative hybrid regression-ratio exponential type estimator finite population mean under Two-phase sampling without replacement is given by:![]()

Proof of Theorem 2:
To find the MSE we square both sides of (17a) and take expectations.

![]()
![]()
![]()
![]()


Therefore,

Theorem 3
The values of ![]() and
and ![]() that minimizes the MSE of the proposed estimator,
that minimizes the MSE of the proposed estimator, ![]() , in two-phase sampling when the supplementary variables are not transformed are given by:
, in two-phase sampling when the supplementary variables are not transformed are given by:
![]()
Proof of Theorem 3:
In order to find the optimum values of ![]() and
and ![]() that minimize the MSE, we differentiate Equation (19) partially with respect to
that minimize the MSE, we differentiate Equation (19) partially with respect to ![]() and
and ![]() and equate to zero.
and equate to zero.
![]()
![]()
![]()
![]()
![]()
![]()
![]()
![]()
![]()
Therefore,
![]()
Putting (21) and (22b) into (19), and simplifying using maple, we have

![]()
![]()
Therefore,
![]()
Recall again from (17) that:

Therefore, inserting the values of (21) and (22b) into the above and simplifying using maple gives us:
![]()
Case II: Proposed estimator in Two-Phase random sampling when auxiliary variables are transformed.
The proposed estimator when the variables are transformed is given as:

where, ![]() and
and ![]() are determined such that the MSE of
are determined such that the MSE of ![]() is minimized.
is minimized.
Theorem 4
The bias of the hybrid regression-cum-ratio exponential type estimator using SRSWOR, under two-phase sampling when the auxiliary variables are transformed is given by:
![]()
Proof of Theorem 4:
Consider the expression in (24)

And inserting the definitions of (16) and (24) into the above expression, we have:


By first order approximation we have:
![]()
Which on expansion gives:
![]()
Considering terms up to the power of two only we get:
![]()

Taking expectation on both sides of (27)) we have:
![]()

Inserting the definitions of (3) in the above expression, we have:


Therefore,

![]()
![]()
Theorem 5
The MSE of the hybrid regression–ratio exponential type estimator in two-phase sampling is given by:![]()

![]()
Proof of Theorem 5
In order to obtain the MSE of ![]() , we square both sides of Equation (27) and take expectations.
, we square both sides of Equation (27) and take expectations.
![]()

![]()

By taking expectations on both sides of the above and applying the definition of (3), we have

Therefore,

where,
![]()
Theorem 6
The values of ![]() and
and ![]() that minimizes the MSE of the proposed estimator,
that minimizes the MSE of the proposed estimator, ![]() , in two-phase sampling when the auxiliary variables are transformed are given by:
, in two-phase sampling when the auxiliary variables are transformed are given by:

Proof of Theorem 6:
To obtain the optimal values of ![]() and
and ![]() , we differentiate (30) partially with respect to
, we differentiate (30) partially with respect to ![]() and
and ![]() , and equating to zero:
, and equating to zero:
![]()
![]()
From Equation (31) ,

Putting (33) into (34a)
![]()
![]()
![]()
Again, Putting (33) and (34b) into (30), we obtain the ![]() have on simplification using maple
have on simplification using maple


where, ![]() .
.
From (28), we know that:
![]()
Therefore, putting (33) and (34b) into the above expression gives on simplification
![]()
where,![]()
EFFICIENCY CRITERIA
For two unbiased estimators ![]() and
and ![]() of
of ![]() , we compare the variances of the estimators to determine their relative efficiency, i.e. Relative Efficiency of
, we compare the variances of the estimators to determine their relative efficiency, i.e. Relative Efficiency of ![]() and
and ![]() is:
is:
![]()
We extend this to large sample variances of asymptotically unbiased estimators.
Let ![]() and
and ![]() be asymptotically unbiased for
be asymptotically unbiased for ![]() , then it is said that
, then it is said that ![]() is Asymptotically Efficient Relative to
is Asymptotically Efficient Relative to ![]() if:
if:
![]()
where ![]() are the proposed and
are the proposed and ![]() and existing and competing estimators (8), (21), (28), and (29) under consideration in this study.
and existing and competing estimators (8), (21), (28), and (29) under consideration in this study.
Asymptotic unbiasedness
Consider estimators based on n-sample,![]()
are identical and independently distributed. Even estimators that are biased, may be close to unbiased for large ![]() . An estimator
. An estimator ![]() is an asymptotically unbiased estimator of deterministic
is an asymptotically unbiased estimator of deterministic ![]() if:
if:
![]()
Theorem 7
Let ![]() denote an estimator of
denote an estimator of ![]() . If
. If ![]() ) and
) and ![]() ) both approach zero as
) both approach zero as ![]() , then the mean squared error between
, then the mean squared error between ![]() and
and ![]() approaches zero and hence
approaches zero and hence ![]() is a consistent estimator of
is a consistent estimator of ![]() .
.
Proof:
![]()
So, if:
![]() and
and
![]() as
as ![]() , then,
, then,
![]()
which means convergence in mean square and hence ![]() also converges to
also converges to ![]() in probability.
in probability.
We now show that ![]() is asymptotically consistent.
is asymptotically consistent.
Ratio of bias to standard error (RBSE)
(30) stated a mathematical expression to measure the effect of bias on the accuracy of an estimate as:
![]()
where ![]() is the bias of
is the bias of ![]() (and
(and ![]() is unbiased).
is unbiased).
as a working rule, if
![]()
Then, effect of bias on the accuracy of an estimate is negligible otherwise, there might exist the problem of over-/under-estimation of the parameters in question
RESULTS
The results of analyses of both the synthetic and real data sets are as presented in Tables 1-6 and Figures 1-4 respectively.
Table 1: Estimates of Mean by Estimators (Populations I-II)
|
|
|
Population I |
Population II |
||||||
|
|
|
Sample size (n) |
Sample size (n) |
||||||
|
|
|
|
|
|
|
|
|
|
|
|
|
|
|
|
|
|
|
|
|
|
|
|
|
|
|
|
|
|
|
|
|
|
|
|
|
|
|
|
|
|
|
|
|
|
|
|
|
|
|
|
|
|
|
|
|
|
|
|
|
|
|
|
|
|
|
|
|
|
|
|
|
|
|
|
|
|
|
|
|
|
|
|
|
|
|
|
|
|
|
|
|
|
|
|
|
|
|
|
|
|
|
|
|
|
|
|
|
|
|
|
|
|
|
|
|
|
|
|
|
|
|
|
|
|
|
|
|
|
|
|
|
|
|
|
|
|
|
|
|
|
|
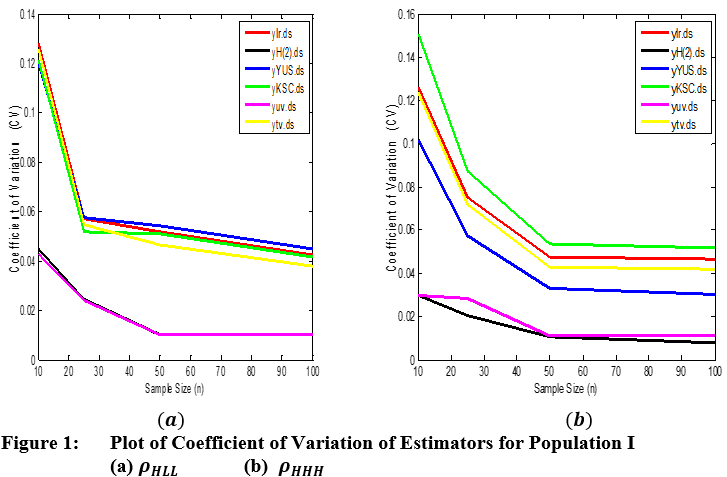

Table 3: Bias of Estimators under Two-Phase Sampling (Populations I-II)
|
|
|
Population I |
Population II |
||||||
|
|
|
Sample size (n) |
Sample size (n) |
||||||
|
|
|
|
|
|
|
|
|
|
|
|
|
|
|
|
|
|
|
|
|
|
|
|
|
|
|
|
|
|
|
|
|
|
|
|
|
|
|
|
|
|
|
|
|
|
|
|
|
|
|
|
|
|
|
|
|
|
|
|
|
|
|
|
|
|
|
|
|
|
|
|
|
|
|
|
|
|
|
|
|
|
|
|
|
|
|
|
|
|
|
|
|
|
|
|
|
|
|
|
|
|
|
|
|
|
|
|
|
|
|
|
|
|
|
|
|
|
|
|
|
|
|
|
|
|
|
|
|
|
|
|
|
|
|
|
|
|
|
|
|
|
|


Table 4: Ratio of Bias to Standard Errors of Estimators (Populations I-II)
|
|
|
Population I |
Population II |
||||||
|
|
|
Sample size (n) |
Sample size (n) |
||||||
|
|
|
|
|
|
|
|
|
|
|
|
|
|
|
|
|
|
|
|
|
|
|
|
|
|
|
|
|
|
|
|
|
|
|
|
|
|
|
|
|
|
|
|
|
|
|
|
|
|
|
|
|
|
|
|
|
|
|
|
|
|
|
|
|
|
|
|
|
|
|
|
|
|
|
|
|
|
|
|
|
|
|
|
|
|
|
|
|
|
|
|
|
|
|
|
|
|
|
|
|
|
|
|
|
|
|
|
|
|
|
|
|
|
|
|
|
|
|
|
|
|
|
|
|
|
|
|
|
|
|
|
|
|
|
|
|
|
|
|
|
|
|
Table 5: Asymptotic Relative Efficiency (ARE) of Estimators (Populations I-II)
|
|
|
Population I |
Population II |
||||||||
|
|
|
Sample size (n) |
Sample size (n) |
||||||||
|
|
|
|
|
|
|
|
|
|
|
||
|
|
|
0.1118 |
0.1734 |
0.0369 |
0.0556 |
0.0546 |
0.0283 |
0.0877 |
0.0638 |
||
|
|
|
0.9048 |
0.9431 |
0.9989 |
0.9922 |
1.1109 |
1.0189 |
0.9873 |
0.999 |
||
|
|
|
0.1277 |
0.1730 |
0.0337 |
0.0492 |
0.0588 |
0.0293 |
0.0676 |
0.0561 |
||
|
|
|
0.1251 |
0.2106 |
0.0385 |
0.0575 |
0.0760 |
0.0304 |
0.0800 |
0.0702 |
||
|
|
|
1.0000 |
1.0000 |
1.0000 |
1.0000 |
1.0000 |
1.0000 |
1.0000 |
1.0000 |
||
|
|
|
0.1166 |
0.1908 |
0.0462 |
0.0692 |
0.0570 |
0.0317 |
0.1083 |
0.0984 |
||
|
|
|
0.0549 |
0.1419 |
0.0521 |
0.0553 |
0.0515 |
0.0246 |
0.0451 |
0.0591 |
||
|
|
|
1.0024 |
1.9008 |
1.0364 |
2.0676 |
7.1978 |
2.0216 |
1.8277 |
1.1760 |
||
|
|
|
0.0851 |
0.2433 |
0.1072 |
0.1327 |
0.2427 |
0.0433 |
0.1525 |
0.2220 |
||
|
|
|
0.0382 |
0.1050 |
0.0410 |
0.0448 |
0.0624 |
0.0169 |
0.0428 |
0.0587 |
||
|
|
|
1.0000 |
1.0000 |
1.0000 |
1.0000 |
1.0000 |
1.0000 |
1.0000 |
1.0000 |
||
|
|
|
0.0572 |
0.1554 |
0.0637 |
0.0674 |
0.0537 |
0.0273 |
0.0551 |
0.0872 |
||
Table 6: Parameter Estimates for Estimators using Real data (Population III) for Small Sample ![]()
|
|
|
|
|
|
|
|
|
|
|
5.8838 |
0.0065 |
1.3757 |
|
|
|
|
|
5.9275 |
0.0206 |
2.4265 |
-0.000647 |
0.0045 |
|
|
|
6.0066 |
|
1.4401 |
0.000516 |
0.0059 |
|
|
|
6.0138 |
0.0124 |
1.8528 |
0.000335 |
0.0030 |
|
|
|
|
0.0086 |
1.5732 |
0.001169 |
0.0126 |
|
|
|
|
0.000046
|
0.1127 |
1.11195E-06 |
0.0002 |
|
|
|
6.1602 |
0.0108 |
1.6886 |
|
|
|
|
|
6.6658 |
0.0342 |
2.7730 |
0.00031 |
0.0017 |
|
|
|
6.6658 |
0.0212 |
1.9973 |
-0.00046 |
0.0032 |
|
|
|
7.2845 |
0.0124 |
1.5286 |
0.00034 |
0.0031 |
|
|
|
6.1588 |
0.0155 |
2.0221 |
0.00212 |
0.0170 |
|
|
|
6.3013 |
8.3293E-05 |
0.1448 |
1.92319E-06 |
0.00021 |
DISCUSSION OF RESULTS
Population I (Simulated data)
Considering the first parameter subspace labeled ![]() , one of the proposed estimators,
, one of the proposed estimators, ![]() is perceived to be more efficient than other estimators throughout the parameter subspace while its variant,
is perceived to be more efficient than other estimators throughout the parameter subspace while its variant, ![]() is third best among the other competing estimators as
is third best among the other competing estimators as ![]() (Table 2 and Figure 1a). The proposed estimators are, asymptotically unbiased (Table 3 and Figure 3a), and consistent (Table 2 and Figure 1a). However, only estimator
(Table 2 and Figure 1a). The proposed estimators are, asymptotically unbiased (Table 3 and Figure 3a), and consistent (Table 2 and Figure 1a). However, only estimator ![]() is asymptotically efficient (Table 5).
is asymptotically efficient (Table 5).
In the second parameter space, ![]() , The estimator,
, The estimator, ![]() dominated the proposed and other estimators in the entire space (Table 2 and Figure 1b). Considering asymptotic properties, the proposed estimators are both asymptotically unbiased (Table 3 and Figure 1b), and consistent (Table 2 and Figure 2b), but again, only
dominated the proposed and other estimators in the entire space (Table 2 and Figure 1b). Considering asymptotic properties, the proposed estimators are both asymptotically unbiased (Table 3 and Figure 1b), and consistent (Table 2 and Figure 2b), but again, only ![]() is asymptotically efficient (Table 5). The ratio of bias to SE of all the competing estimators falls under the acceptable threshold
is asymptotically efficient (Table 5). The ratio of bias to SE of all the competing estimators falls under the acceptable threshold ![]() .
.
Population II (Simulated data)
In the first parameter subspace, ![]() ,
, ![]() was apparently more efficient than the proposed and other estimators for small sample sizes. However, as
was apparently more efficient than the proposed and other estimators for small sample sizes. However, as ![]() , one of the proposed estimators,
, one of the proposed estimators, ![]() dominated
dominated ![]() and the others throughout the subinterval (Table 2 and Figure 2a). It was however detected that ratio of bias to standard error of
and the others throughout the subinterval (Table 2 and Figure 2a). It was however detected that ratio of bias to standard error of ![]() estimator is greater than the threshold of 0.1 (Table 4). This implies, estimated parameters by
estimator is greater than the threshold of 0.1 (Table 4). This implies, estimated parameters by ![]() are likely to fall outside the 95% confidence intervals. Thus, the proposed estimators are preferable. The proposed estimators are again, asymptotically unbiased (Table 3 and Figure 3), and consistent (Table 2 and Figure 3a), once again, only
are likely to fall outside the 95% confidence intervals. Thus, the proposed estimators are preferable. The proposed estimators are again, asymptotically unbiased (Table 3 and Figure 3), and consistent (Table 2 and Figure 3a), once again, only ![]() is asymptotically efficient (Table 5).
is asymptotically efficient (Table 5).
The most efficient estimator in the second subspace, ![]() , is apparently,
, is apparently, ![]() while one of the proposed estimators,
while one of the proposed estimators, ![]() is the second most efficient (Table 1 and Figure 2b). However, RBSE of the estimator,
is the second most efficient (Table 1 and Figure 2b). However, RBSE of the estimator, ![]() exceeds 0.1 in the entire partition (Table 4). The implication is that,
exceeds 0.1 in the entire partition (Table 4). The implication is that, ![]() might have either underestimated or overestimated parameters in this interval (Sarmah et al., 2013). Again the proposed estimators are preferable under this condition. Thus, the proposed estimators are respectively, asymptotically unbiased (Table 3 and Figure 4b), and consistent (Table and Figure 17b), but, only
might have either underestimated or overestimated parameters in this interval (Sarmah et al., 2013). Again the proposed estimators are preferable under this condition. Thus, the proposed estimators are respectively, asymptotically unbiased (Table 3 and Figure 4b), and consistent (Table and Figure 17b), but, only ![]() is asymptotically efficient (Table 5).
is asymptotically efficient (Table 5).
Population III (Real data)
For Population III, only a sample size of ![]() is considered. Here, one of the proposed estimators
is considered. Here, one of the proposed estimators ![]() outperformed all the other competing estimators under study in both the
outperformed all the other competing estimators under study in both the ![]() and
and ![]() parameter subspaces in terms of CV (Table 6). Its variant,
parameter subspaces in terms of CV (Table 6). Its variant, ![]() appears second in
appears second in ![]() subspace while
subspace while ![]() is second in terms of CV in the
is second in terms of CV in the ![]() subspace. Thus the proposed estimators are preferable.
subspace. Thus the proposed estimators are preferable.
In view of the performance of the proposed and other competing estimators in Two-phase sampling, it is evident that the proposed estimators are more efficient than most of the existing estimators considered in this study namely, the classical regression estimator, (25) estimator, (31) estimator and (29) estimator.
CONCLUSION
This study proposed two new estimators for estimating the population mean in two-phase sampling. The performance of the proposed estimators was evaluated using simulated and real data. The results show that the proposed estimators, particularly y ̅_(uv.ds), outperform most of the existing estimators considered in this study, including the classical regression estimator and several other estimators. The proposed estimators are asymptotically unbiased, consistent, and efficient, with y ̅_(uv.ds) being the most efficient in most cases. The ratio of bias to standard error of the proposed estimators falls within the acceptable threshold, indicating that they provide reliable estimates. Overall, the findings of this study suggest that the proposed estimators are preferable for estimating the population mean in two-phase sampling, particularly when the sample size is large.
REFERENCES
- Uba, T., A. J. Ikughur and S. C. Nwaosu (2021). An Alternative Hybrid Estimator of Finite Population Mean in Simple Random Sampling. Asian Journal of Probability and Statistics, 15(4): 276-298.
- Kalton, G. (2002). Models in the Practice of Survey Sampling (Revisited). Journal of Official Statistics, 18(2): 129-154
- Diana, G., and Perri, P. F. (2007). Estimation of Finite Population Mean Using Multi-Auxiliary Information. METRON- International Journal of Statistics, 65(1): 99-112.
- Ikughur, A. J., Ikyaagba, B. K., and Nwaosu, S. C. (2017). Exponential Ratio-Product Type Estimators in Stratified Random Sampling. Journal of the Nigerian Statistical Association, 29: 35-46.
- Riaz, N., Noor-Ul-Amin, M. and Hanif, M. (2014). Regression-Cum-Exponential Ratio Type Estimators for the Population Mean. Middle East Journal of Scientific Research, 19(12): 1716-1721.
- Neyman, J. (1938). Contribution to the Theory of Sampling Human Populations. Journal of the American Statistical Association, 33(201): 101-116.
- Cochran, W. G. (1940). The Estimation of the Yields of the Cereal Experiments by Sampling for Ratio of Grain to Total Produce. The Journal of Agricultural Science, 30: 262-275.
- Kanwai, M. E., Ashiribi, O. E., and Isah, A. (2016). Use of Auxiliary Variable and Asymptotically Optimum Estimators to Increase Efficiency of Estimation in Double Sampling. International Journal of Statistics and Probability, 5(3): 55-62.
- Onyeka, A. C. (2013). A Class of Product-Type Exponential Estimators of the Population Mean in Simple Random Sampling Scheme, Statistics in Transition, 14(2): 189-200.
- Saini, M., and Kumar, A. (2015). Exponential Type Product Estimator for Finite Population Mean with Information on Auxiliary Attribute. Applications and Applied Mathematics, 10(1): 106-113.
- Mishra, S. S. (2018). Generalized Square Root Transformation and Exponential Ratio Type Estimator for Finite Population Mean in Sample Survey. Bulletin of Mathematics and Statistics Research, A peer reviewed International Journal, 6(2): 1-7.
- Bahl, S., and Tuteja, R. K. (1991). Ratio and Product Type Exponential Estimator. Information and optimization sciences, 12: 159-163.
- Singh, R., Chauhan, P., Sawan, N., and Smarandache, F. (2009). Improvement in Estimating the Population Mean using Exponential Estimator in Simple Random Sampling. Bulletin of Statistics and Economics, 3(9): 13-18.
- Grover, L. K., and Kaur, P. (2011). An Improved Estimator of the Finite Population Mean in Simple Random Sampling. Model Assisted Statistics and Applications, 6(1): 47-55.
- Rashid, R., Noor-Ul-Amin, M., and Hanif, M. (2015). Exponential Estimators for Population Mean using Transformed Variables. Applied Mathematics and Information Sciences-an International Journal, 9(4): 2107-2112.
- Singh, H. P. and Espejo, R. (2003). On Linear Regression and Ratio Product Estimation of a Finite Population Mean. The Statistician, 52: 59-67.
- Samiuddin, M., and Hanif, M. (2007). Estimation of Population Mean in Single and Two-Phase Sampling with or Additional Information. Pakistan Journal of Statistics, 23: 99-118.
- Malik, K. A., and Tailor, R. (2013). Ratio type Estimator of Population Mean in Double Sampling. International Journal of Advanced Mathematics and Statistics, 1 (1):34-39.
- Yadav, S. K., Mishra, S. S., Tiwari, V., and Shukla, A. K. (2014). Computational Approach to Generalized Ratio Type Estimator of Population Mean under Two Phase Sampling. International Journal on Recent Trends in Computing and Communication, 2(10): 3013-3017.
- Handique, B. K. (2012). A class of Regression-cum-Ratio Estimators in Two-Phase Sampling for Utilizing Information from High Resolution Satellite Data. ISPRS Annals of the Photogrametery, Remote Sensing and Spatial information Sciences, 1(4): 71-76.
- Deepan, G., Upasana, G. and B. K. Singh (2024) Exponential chain ratio estimator of finite population mean with imputation of missing data under two-phase sampling, Advances and Applications in Statistics, 91(9): 1113-1135. https://doi.org/10.17654/0972361724059
- Dash, P. and Sunani, K. (2022) An Improved Class of Mixed Estimators of Population Mean under Double Sampling. Indian Journal of Science and Technology 15(7): 276-291. http s://doi.org/10.17485/IJST/v15i7.1396
- Tahir, M., Yude, B., Bashir, S., Hussain, S & Munir, T. (2023). A New Improved Estimator for the Population Mean using Twofold Auxiliary Information under Simple Random Sampling. Management Science Letters, 13(4): 265-276.
- Hamad, N., Hanif, M., and Haider, N. (2013). A Regression Type Estimator with Two Auxiliary Variables for Two-Phase Sampling. Open Journal of Statistics, 3: 74-78.
- Hanif, M., Hamad, N. and Shabbaz, M. Q. (2009). A Modified Regression Type Estimator in Survey Sampling. World applied Science Journal, 7(12): 1559-1561.
- Singh, P., and Vishwakarma, G. K. (2007). Modified Exponential Ratio and Product Estimators for Finite Population Mean in Double Sampling. Austrian Journal of Statistics, 36: 217-225.
- Estimator in Two-Phase Sampling using Auxiliary Information. Statistical, 73(2): 221-234.
- Kalita, D., Singh, B. K., and Choudhary, S. (2013). Improved Exponential Chain Ratio and Product-Type Estimators for Finite Population mean in Double Sampling. International Journal of Statistical Sciences, 13: 21-37.
- Cochran, W. G. (1977). Sampling Techniques. (3rd Ed.), USA, Wiley Eastern limited, Pp. 428.
- Yadav, R., Upadhyaya, L. N., Singh, H. P., and Chatterjee, S. (2013). A Chain Ratio Exponential Type Estimator in Two-Phase Sampling using Auxiliary Information. Statistical, 73(2): 221-234.