
Effect of Soaking and Salt-Water Blanching on the Proximate, Antinutrients and Amino Acid Profile Composition of Cream Coloured Pigeon Pea Flours
- Nzelu, I. C.
- Elochukwu, C. U
- 198-210
- Sep 22, 2023
- Chemistry
Effect of Soaking and Salt-Water Blanching on the Proximate, Antinutrients and Amino Acid Profile Composition of Cream Coloured Pigeon Pea Flours
Nzelu, I. C. and Elochukwu, C. U
Food Technology Department, Federal Polytechnic Oko, Anambra State, Nigeria
DOI: https://doi.org/10.51244/IJRSI.2023.10816
Received: 16 July 2023; Accepted: 19 August 2023; Published: 21 September 2023
ABSTRACT
The study was on the effect of processing: soaking and salt-water blanching and cooking on the proximate, anti-nutrient and amino-acid composition of cream coloured pigeon pea seeds’ flours. The proximate composition analysis showed significant (p>0.05) differences between the values obtained for crude protein, ash, fat, crude fibre, carbohydrates and moisture, in the raw/untreated and the processed pigeon pea. Healthy cleaned pigeon pea seeds (2.5kg) were divided into five portions of 500 g each. They were subjected to five different processing methods and coded AOP, BXY, CZK, DRN and EVT respectively. AOP represented the untreated flour; BXY represented salted and 1h boiled pigeon pea flour; CZK represented salted and 2h boiled pigeon pea flour; DRN represented 24h soaked and 1h boiled pigeon pea flour while EVT represented 2h boiled pigeon pea flour sample. The flours’ crude protein contents ranged from 19.54 to 21.68%, crude fat ranged from 2.40 to 3.96%; ash ranged from 3.48 to 5.20 %; fibre ranged from 9.45 to 10.19%, moisture ranged from 4.70 to 6.46 % while carbohydrates ranged from 50.48 to 57.49%. In the anti-nutrients’ assays, processing significantly reduced the levels of oxalate, saponins, alkaloids, tannins, cyanide and phytate. In addition to the significant differences, straight cooking without salt blanching or soaking yielded the highest levels of leucine, lysine, phenylaline, tryptophan, valine, methionine and histidine, 7 out of the 8 essential amino acids. The result of essential amino acid indices of the sample flours revealed that the flours are of good protein quality. This result also showed that straight-cooking yielded highest crude protein and highest levels of the essential amino acids. Also, processing generally lowered the levels of anti-nutrients in the pigeon pea seeds’ flours, thus making them safer for consumption. Salt-blanching yielded more softening and pastry product.
Keywords: Pigeon pea, Proximate, Soaking, Salting, Flours
INTRODUCTION
Legumes (dry beans and pulses) are edible fruits or seeds of pod-bearing plants belonging to the family of Leguminosae, and are widely grown throughout the world. Pigeon pea (Cajanuscajan) is among the lesser known legumes (Rajev and Karim, 2009) grown in some countries of the world, depending upon the climatic conditions to support their growth and food habits of the consumers, (Salunkheet al., 1986). Pigeon pea has been classified into the family Fabaceaewith one polymorphic specie Cajanuscajan. It is an important food legume and among the legumes adapted to draught conditions, (Saxenaet al., 2010). Pigeon pea ranks fifth importance among edible legumes of the world and is one of the oldest food crops (Salunkheet al, 1986). It is also commonly known as congo pea, red gram, yellow dahl and no-eye pea (Salunkheet al, 1986), but known in Nigeria as “FioFio” or “agbugbu” in Igbo, “Yarchacha” in Hausa and “Epanla” in Yoruba (Nzelu, 2010). Its origin has been considered as either from Africa, then carried to India through slave trade or, from India who alone contributed 90% of its world production (Salunkheet al, 1986). In terms of structure, the shape, size and colour of the seed vary according to cultivars. The seed shape can be round or oval, and sometimes with raised hilum. Pigeon pea is among the legumes commonly used as foods in the tropics. Others include African yam bean (Sphenostylisstenocarpa), Bambara groundnut (Vignasubterranean), cowpea (Vignaunguiculata) and Rice bean (Vigna radiate L). Legumes occupy an important place in human nutrition due to their high plant protein content (20-50%) (Kaushalet al., 2012). Of concern is the fact that legumes contain non- nutritive plant chemicals (phytochemicals) which reduce nutrient absorption, impair digestion, reduce nutrients absorption and, impair optimal utilization of nutrients, thus producing negative effects when consumed unprocessed. However, food processes such as cooking, soaking, blanching, germination, fermentation e.t.c., reduce or remove the antinutrients’ effects, (Bora, 2014). It is however worthy of note that Phytochemicals have been proven to be beneficial for human health in preventing diseases. Phytic acid for example may contribute to maintaining normal blood sugar and heart health, (Onimawo and Akubor, 2012).
On account of their protein, dietary fibre, starch, vitamins and minerals, legumes are useful in the fight against Protein Energy Malnutrition (PEM) especially among the low income class in the developing countries (Siddiq and Uebersax, 2003). Pigeon pea seed is rich in protein, carbohydrate and minerals. Also, the seed coat, contains most of the non-digestible carbohydrates and relatively higher proportions of calcium and iron, (Salunkheet al., 1986). In addition to its nutritional properties, there are claims that pigeon pea has some medicinal properties due to the presence of antioxidants in the plant and seeds (Moulisha et al., 2016). Despite these benefits, the traditional utilization of pigeon pea (like other food legume), still entails long and tedious preparation processes, resulting in excessive expenditure of fuel and time. Till date the major form of consumption of pigeon pea traditionally is in the form of porridge. Pigeon pea porridge may be consumed in combination with rehydrated “achichaede” in the south eastern parts of Nigeria. However, Moin-moin produced from processed Pigeon pea seeds was recently reported by Uchegbu, (2018), while Fasoyiroet al. (2009) reported of pigeon pea dawadawa.
A major factor limiting its expanded consumption is the so called storage-induced textural defects that prolong cooking time and demands corresponding higher energy requirements for preparation. The hard-to-cook (HTC) phenomenon and hard-shell are initiated by structural and compositional factors. The presence of the seed coat greatly increased the cooking time for a number of legumes (Muller, 1967). To solve the challenges of the HTC phenomenon, household processors have been in search of resource-reducing-processes including soaking and the use of alkaline salts in the cooking water so as to soften legumes. Bicarbonate of soda was reported for Europe and North America while trona, (kanwa or akanwu in Yoruba and Igbo respectively), a naturally occurring sodium sesquicarbonate is added to soften the beans and shorten the cooking time in West Africa and Nigeria, (FAO, 1982). The use of trona is still in practice for cooking such legumes as Treculiaafricana in Nigeria till date. Loss of nutrients will be expected in either of the processes in addition to possible negative effect on health, especially an account of the added common salt. The aim of this study is to ascertain the impact of soaking and salt-water blanching, on some chemical properties of processed cream-coloured pigeon pea flours.
MATERIALS AND METHODS
Cream-coloured pigeon pea seeds were procured from Akwata section of Ogbete Market, Enugu, Enugu State, Nigeria. Healthy cleaned pigeon pea seeds (2.5kg) were divided into five portions of 500 g each. They were subjected to five different processing methods and coded AOP, BXY, CZK, DRN and EVT respectively. Sample AOP represents the untreated pigeon pea which served as the control. The sample was just cleaned, sundried and milled into flour. Samples BXY and CZK were processed by washing, blanching the pigeon pea seeds for 30 minutes with a solution containing 20 g of salt in 2 L of water. The salt water was decanted after 1 hour of boiling, and the pigeon pea seeds were rewashed. The seeds were then transferred into fresh boiling water (2 L) and boiled for 1 hour (sample BXY) and 2 hours (sample CZK), respectively, with additional potable water as needed. The pigeon pea seeds were strained out, cooled, and dried. The dried seeds were milled into flour. Sample DRN was processed by soaking the pigeon pea seeds in water at a ratio of 1:2 (pigeon pea to water) under atmospheric conditions of 35°C ± 2°C for 24h. The soaked seeds were removed from the soak water and boiled for 2 hours. The soaked, boiled pigeon peas were then dried and milled into flour. Sample EVT was washed and poured into boiling water and cooked for 2 hours with approximately 4 L of water. The cooked seeds were strained, dried and milled into flour. The method as described by Nwankeziet al. (2019) was adopted for drying and pulverizing the dried seeds to produce flours. The flours were sieved using a 1 mm aperture size. All the samples were analyzed for their proximate, antinutrient, and amino acid compositions. The standard amino acid used for comparison was based on the Amendment of FAO/WHO (1991).
Pigeon pea seeds
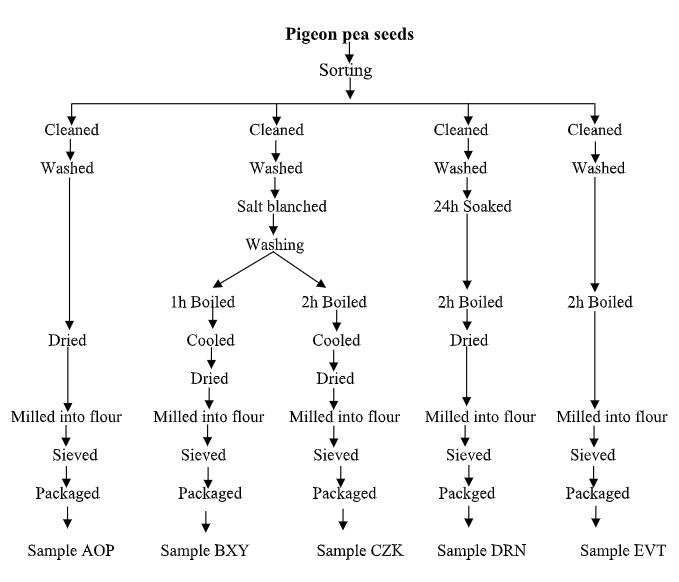
Fig 1: Flow chart for the preparation of pigeon pea flours
METHODS
Proximate composition determination
The moisture, crude protein (N × 6.25), crude fat and crude fibre were obtained using AOAC (2010) standard methods. Carbohydrate was obtained by difference.
Moisture content determination
Two grams of each sample was weighed into dried weighed crucible and dried in an oven at 105OC for 3h. The dried samples were put into desiccators, cooled and reweighed. The process was repeated until constant weight was obtained. The difference in weight was calculated as the percentage moisture of the original sample.
Percentage (%) moisture = W2 – W1 × 100
W2 – W3 1
Where W1= Initial weight of empty dish
W2 = Weight of dish and undried sample W3 = Weight of dish and dried sample
Ash content determination
Two grains of each sample was weighed into a crucible, dried in an oven for 3h at 100OC, then transferred into a muffle furnace at 550OC. Heating continued and was stopped when the material turned ashy in colour. The dish and ash were reweighed after cooling in a desiccators at room temperature. The weight of the residual ash was calculated.
Percentage (%) ash = Weight of Ash × 100
Weight of original sample 1
Fat content determination
Two grams of each sample was loosely wrapped with filter paper and with 120ml of petroleum ether. The fat content was extracted by soxhlet extraction technique for 5h. The percentage (%) oil content was calculated as follows:
Percentage (%) oil content = W2 – W1 × 100
W3 1
Where W1= Weight of empty extraction flask
W2 = Weight of the flask and oil extracted W3 = Weight of the sample
Crude fibre determination
Two gram (2g) sample and 1g asbestos were put into 200ml of 1.25% of H2SO4 in a flask and boiled for 30min. The mixture was poured unto a Buchner funnel fitted with cheese cloth, secured with a rubber band and allowed to filer. The residue was transferred into 200ml boiled NaOH and boiling continued for 30mins, and the mixture was filtered using the Buchner funnel. The residue was washed with alcohol twice, followed by thrice washing with petroleum ether. The residue was then transferred to a weighed, clean, dry crucible and dried in an oven to constant weight. The percentage (%) crude fibre of the samples was calculated as:
Percentage (%) crude fibre= W1 – W2 × 100
W3 1
Where W1 = Weight of sample before incineration W2 = Weight of sample after incineration W3 = Weight of original sample
Crude protein determination
The micro kjeldahl method described by AOAC (1990) was adopted. Two grams of each sample digested using 10ml of Con. H2SO4 and one tablespoon of selenium catalyst in along necked digestion tube. Heating was done in a fume chamber. 10ml of the digest was mixed with equal volume of 45% of NaOH solution and poured into a kjeldahl distillation apparatus and the mixture was distilled and the distillate was collected into 4% boric acid solution containing 3 drops of methyl red indicator. Titration was done using 50ml of the distillate. The nitrogen content was calculated and multiplied with 6.25 factor to obtain the crude protein content.
Percentage (%) Nitrogen = (100×N×14×VF) T
100×Va
Where N= Normality of Titre (0.IN)
VF= Total volume of digest: (100ml) T = Titre value
Va= Aliquot volume distilled
Carbohydrate content determination
The Nitrogen Free Extract (NFE) method of AOAC (1990) was adopted. The carbohydrate was calculated as: weight by difference between 100 and the summation of other proximate parameters:
NFE = 100 – (M + P+ F1 +A + F2)
Where M = Moisture
P = Protein, F1= Fat, A = Ash, F2= Crude Fibre.
Anti–nutrients determination
The antinutrient properties were determined by Abezaet al (1968) method, for Oxalate; Harbone (1973), was for Saponin and Alkaloids; Lucas and Markaka, (1975) was for Phytate; AOAC (2005) for Tannin and AOAC (1980) was for Hydrogen cyanide.
Determinationof oxalate
The oxalate content was determined by the mothoddescribrd by Abezaetal (1968). This method involves three major steps viz digestion, oxalate precipitation and permanganate titration. About 2g of the sample was weight into 250ml conical flask 190ml distilled water and 10ml of 6MHCL were added. The mixture was digested for 1h on boiling water bath, cooled and transferred into a 250ml volumetric flask, diluted to volume and filtered. Four drops of methyl red indicator were added, followed by concentrated ammonia until the solution turned faint yellow. The solution was then heated to 1000C, allowed to cool and filtered to remove precipitate containing ferric ions the filtrate was boiled, 10ml of 5% calcium chloride was added with constant stirring and allowed to stand overnight. The mixture was filtered through Whatman No. 40 filler paper.
Using distilled water; the precipitate was washed several times then was transferred quantitatively to a beaker. Five milliliter of 25% sulphuric acid was added to dissolve the precipitate. The resultant solution was maintained at 800C and titrated against 0.5% potassium permanganate used, the oxalate content of the sample was calculated using the equation 1ml of KMn04 = 2.2mg.
Determination of Saponin
The saponin content of the samples was determined by double extraction gravimetric method of Harbone (1973). 5g of the powered sample was mixed with 50ml of 20% aqueous ethanol solution in a flask, heated and filtered. The extraction was repeated and the total extract was reduced to about 40ml at 90OC. The saponins was later extracted with 60ml of normal butanol, washed with aqueous 5% NaCl solution then evaporated to dryness in a pre-weighed evaporation dish. The saponin content was determined by difference and calculated a percentage of the original sample thus:
% Saponins = W2 –W1 × 100
Weight of sample 1
Where W1 = Weight of evaporating dish
W2 = Weight of evaporating dish and sample
Determination of Alkaloid
This was done using Harbone (1973) method. Fifty milliliters of 10% acetic acid solution in ethanol was added to 5g of the sample in ethanol. The mixture was shaken very well and allowed to stand for 4h before filtering. The filtrate was concentrated and the alkaloid was precipitated with NH4OH added drop wise. The mixture was allowed to cool before filtering off the precipitate with a weighed filter paper. The precipitate was washed with 1% of NH4OH and dried in the filter paper in the oven at 60OC for 30mins, and re-weighed to get the weight of the filter paper and the alkaloid.
% Alkaloid = W2 – W1 × 100
W 1
Where W= Weight of sample
W1 = Weight of filter paper
W2 = Weight of filter paper plus precipitate
Determination of Phytates
The phytate contents of the sample were determined using the method of Lucas and Markaka (1975). Five gram of each sample was soaked in 100ml of 2% HCl in a 250ml conical flask, and filtered after 5h soaking time. 25ml of the filtrate was mixed with 50ml, 0.3% Potassium thiocyanate solution (as indicator) all in a 250ml beaker. The mixture was titrated against standard FeCl3 solution until slightly brownish yellow colour persisted for 5min.
% Phytate (mg/100g) = Titre × 0.064 × 100
Weight of sample
Determination of Tannin
Tannin was determined using the standard procedure of AOAC (2005). Two grams of the dried sample was boiled in 300ml distilled water, cooled, diluted and filtered through a non- absorbent cotton wool. 25ml of the infusion was titrated with 0.1N KMnO4 (which was standardized against 0.1N oxalic acid), till there was a colour change. Tannin was calculated as follows: Tannin content (mg/100g) = titre X 0.0066235.
Determination of Hydrogen Cyanide
The Alkaline Titration method of AOAC (1980) mg/100g was used. 10-20g of ground sample was mixed with 200ml water and allowed to stand for 2-3h to allow for autolysis. Steam distillation was conducted on the set up during which 150-160ml distillate was collected in NaOH solution. The distillate was diluted to 250ml. 100ml aliquot was titrated with 0.02N AgN03 after adding 6NNH4OH and 2ml 2% potassium iodine.
Amino acids determination
This determination was by Bentiz (1989) method pigeon pea seeds’ powder after digestion, was inserted into the analyzing chamber of Technicon Sequential Multi-sample Amino Acid Analyzer (TSM) which is designed and operates to separate, detect and quantify amino acids by the development of a chomatogram. The area under each peak was calculated. The concentration of each amino acid was expressed as g/16gN to the equivalent of g/100g protein.
Protein quality determination
The protein quality of the pigeon pea flour samples were determined on the basis of the amino acid profiles. The essential amino acid index (EAAI) was calculated using the method of Steinke et al. (1980)
EAAI = (Content of Essential Amino Acid in the Test Sample / Content of Essential Amino Acid in the Reference Protein) × 100
STATISTICAL ANALYSIS
Data from proximate and anti-nutrients’ determinations were collected in triplicates and means± standard deviations (SD) were computed. Data obtained were analyzed by one way analysis of variance (ANOVA) using the SPSS version 23 (2015) statistical procedure and significance was accepted at p<0.05 level of probability
RESULTS AND DISCUSSION
The results of the assays conducted are recorded on Table 1, 2 and 3. Table 1 reveals the proximate composition of the pigeon pea seeds flours, (in percentage). The flours’ crude protein contents ranged from 19.54%±0.35 to 21.68%±0.76, where AOP, the untreated flour which served as control had the least value and sample EVT, the 2h boiled sample had the highest value. The protein content of the raw unprocessed pigeon pea flour agrees closely with the works of Fasoyiroet al (2009), Uzoechina (2009) and Onu and Okongwu (2006) who reported 20.02% and 19.74% and 17.30% crude protein contents respectively. The straight cooking as a processing method therefore had the impact of releasing more proteins.
Table 1: Proximate composition of the Pigeon Pea Flour (DWB)
| Sample %C. Protein %Fat | %Ash | %C. Fibre | %Moisture %CHO pH | |||||
| AOP 19.54e±0.35 2.93c±0.07 | 5.20a±0.10 | 11.99c±0.11 | 5.55d±0.02 54.77c±0.23 4.36e±0.02 | |||||
| BXY | 20.72b±1.44 | 3.96a±0.05 | 4.76b±0.05 | 13.59a±0.25 | 4.70e±0.07 | 50.48e±0.79 | 4.43d±0.02 | |
| CZK | 20.19c±0.24 | 2.40e±0.09 | 3.79c±0.13 | 10.19d±0.13 | 5.92c±0.04 | 57.49a±0.16 | 4.64b±0.02 | |
| DRN | 19.95d±0.14 | 3.82b±0.02 | 3.83c±0.07 | 13.32b±0.09 | 5.97b±0.03 | 53.13d±0.09 | 4.79a±0.02 | |
| EVT | 21.68a±0.76 | 2.81d±0.04 | 3.48d±0.34 | 9.45e±0.16 | 6.46a±0.06 | 56.11b±0.68 | 4.53c±0.02 | |
Results are expressed as mean ±SD (n=3). Values with different superscripts within the columns are significantly different from each other at p<0.05.
Key: AOP = Untreated flour; BXY = Salted: 1h boiled; CZK = Salted: 2h boiled; DRN = 24h soaked, 1h boiled and EVT = 2h boiled
With 1h and 2h boiling after salt blanching of the pigeon pea seeds, the crude protein content of samples BXY (20.72%)and CZK (20.19%) amounted to 6.03% and 3.33% increase in the protein content from the control sample. Much leaching of the water soluble proteins might have occurred due to the 24hr soaking in sample DRN. The fat contents ranged from 2.40%±0.09 for sample CZK (salted and 2h boiled) and 3.96%±0.05 in sample BXY. The 0.2% salt concentration in the blanch-water and 1h boiling (sample BXY) resulted to highest fat 3.96%, being 35.15% increase in sample BXY pigeon pea flour while the 24h soaking and 2h cooking resulted to 3.82%±0.02 fat. The processes enhanced the fat of sample DRN by 30.38%. The untreated pigeon pea flour sample AOP, had 5.20%±0.10 ash content. This was the highest value among the samples while sample DRN flour had 3.48%±0.34, the least among the sample. This 5.20%±0.10 ash content value agrees very much with the report of Fasoyiroet al (2009) who reported 4.73% but used pale brown pigeon pea variety. Decrease in ash content (from Table 1) could be attributed to the different processing techniques employed. However, it should be noted that the salt–water blanching would very likely enhance the ash content of samples BXY and CZK in particular. The highest value for the crude fibre composition was obtained from sample BXY. The least crude fibre value of 9.45%±0.16 was obtained from the sample EVT. The moisture contents ranged from 4.70%±0.07 to 6.46±0.06. All these fell below the 15% moisture levels regarded as for stable foods (Okaka and Okaka, 2001) during storage. The values obtained for the carbohydrate ranged between 50.48%±0.79 and 57.49%±0.16 for the samples. Sample CZK had the highest carbohydrate value while the sample BXY had the least value. The 0.2% salt-water blanching and 2h boiling resulted to very soft and pasty product. Cooked food product often result in changes in texture caused by co-agulation and loss in water-holding capacity of proteins, (Fellows, 2000). Softening the texture of some vegetables may occur when some salts are used for blanching. Sample BXY (salt-blanched) sample was less softened after 1h boiling while sample CZK (also salt-blanched) was highly softened after 2h boiling. In the presence of water and the physical agent, (heat), the pasty nature of the product occurred due to gelatinization of the starch and the denaturation of the protein content of the pigeon pea. Heat is the most commonly encountered physical agent and it is able to destabilize many bonds within proteins. The carbohydrate content of the samples ranged between 50.48% and 57.49%. The sample CZK had the highest value. The salt-blanching and the 2h heating (after blanching) seem responsible for the high softening and the pasty product obtained. From ancient times, alkaline salts e.g., bicarbonate of soda, local natural salts and potashes have been added to the cooking water to soften legumes like cowpeas, (FAO 1982). The sample EVT had 56.11% carbohydrate content (Table 1). This sample was equally tender but was not pasty. The pH of all the flours ranged between 4.36±0.02 and 4.79±0.02. Most mircroorganisms grow best if the pH of the food is 6.6 and 7.5, i.e., neutral pH, (Gaman and Sherrington, 1977). The chances of the attack of pathogens on these flours will be minimal once the flours retain the low moisture levels and they are stored in cool places.
Table 2: Anti-nutrient properties of the Processed Pigeon Pea Flours
| Sample | Oxalate | Saponin | Alkaloid | Tannins | Cyanide | Phytate |
| (mg/100g) | (%) | (%) | (mg/100g) | (mg/100g) | (mg/100g) | |
| AOP | 54.50a±0.05 | 1.45a±0.05 | 1.02a±0.02 | 11.92a±0.07 | 0.93a±0.03 | 382.63a±0.77 |
| BXY | 33.25d±0.25 | 0.11d±0.01 | 0.71c±0.01 | 8.09c±0.14 | 0.74b±0.01 | 300.22b±0.16 |
| CZK | 49.25b±0.25 | 0.25b±0.00 | 0.61e±0.01 | 9.02b±0.02 | 0.63c±0.02 | 283.00c±0.39 |
| DRN | 38.17c±0.67 | 0.24bc±0.02 | 0.65d±0.01 | 6.17e±0.17 | 0.23e±0.02 | 249.58d±0.47 |
| EVT | 28.75e±1.25 | 0.20c±0.00 | 0.83b±0.01 | 7.37d±0.12 | 0.51d±0.02 | 166.38e±0.32 |
**Results are expressed as mean ±SD (n=3). Values with different superscripts within the columns are significantly different from each other at p<0.05
Key: AOP = Untreated flour ; BXY = Salted: 1h boiled; CZK = Salted: 2h boiled; DRN = 24h soaked, 1h boiled and EVT = 2h boiled
Table 2 shows the anti-nutrient properties of the flour samples oxalate, tannins, cyanide and phytates were recorded in mg/100g while saponin and alkaloid were recorded in percentages. There were significant (p < 0.05) differences in the anti-nutrient properties of the samples. The values of the specific anti-nutrients: oxalate, saponin, alkaloid, tannin, cyanide and phytate were highest in sample AOP, the untreated pigeon pea flour. This effect is in consonance with the reports of Oladeleet al., (2009). The untreated sample had its oxalate contents reduced to 49.25±0.25mg/100g (9.63% reduction) from the 54.50±0.05mg/100g of the raw/untreated pigeon pea flour sample. Sample EVT, boiled for 2h had the 28.75mg/100g the least value (47.27% reduction) of the oxalate in the pigeon pea flour. Oxalate concern is because high oxalate in diets can increase the risk of renal calcium absorption. In terms of saponin concentration, the treatments reduced the 1.45±0.05% saponin of untreated sample AOP by 92.41% in sample BXY, and by 82.75% in the sample CZK (Table 2). With 0.20±0.00, sample EVT had 86.02% reduction in the saponin concentration in the 2h boiled pigeon pea flour. According to FAO (1980), the quantities of saponin found in legumes are not usually harmful to man and may indeed have some beneficial effects in lowering the cholesterol levels in the consumer. Again Onimawo and Akubor (2012) have reported that acute saponin poisoning is rare in both animals and man. In their reports, saponins are glycosides. They are characterized by their bitter or astringent tastes and foaming properties. Alkaloid concentration of 1.02±0.02 of the raw pigeon pea flour (sample AOP) was reduced to 0.61±0.01% in the sample CZK (40.19% reduction) in the salt-blanched and to 0.83±0.01% (18.63% reduction) in sample EVT, 2h boiled pigeon pea flour. The combination of salt and boiling thus seems effective in the reduction or removal of alkaloids in the pigeon pea flours. The tannin content of the sample AOP flour in mg/100g was reduced from 11.92±0.07 to 9.02±0.02 (24.32% reduction) in sample CZK, to 8.09±0.14 (32.13% reduction) in sample BXY, to 7.37±0.12 (38.17% reduction) in sample EVT and 6.17±0.17 (48.23% reduction) in sample DRNflour samples. It is generally accepted that moist heat is effective in anti-nutrients’ reduction as can be seen for sample EVT (Table 2). Again, soaking where the soak water is discarded also may be beneficial in removing phytates and cyanogenic compounds (Salunkheet al., 1986). Sample DRNthus had the least value of tannin (34.77% reduction), among the flours. 24h soaking reduced the tannins most significantly. This agrees with the report of Siddiq and Uebersax (2013). The seed coat of beans contains various tannins and phenol compounds that have been shown to have strong anti-oxidant capacity and free-radical potential. However, Salunkheeta.l (1986) posits that the possible significance of residual anti-nutrients of processed pigeon pea cannot be explained without further investigation. These components are often considered as antinutrients, because they can bind to di-valent ions e.g., iron, zinc and calcium, forming insoluble complexes with proteins, amino acids and mineral components of the bean, thus making the nutrients unavailable to the consumer. Tannins may decrease protein quality by decreasing digestibility and palatability, (Onimawo and Akubor, 2012). This bioavailability may occur because the tannins can bond to positively charged proteins, amino acids and minerals (Siddiq and Uebersax, 2013). Sample AOP had the highest value of the Hydrogen cyanide concentration 0.93mg/100g while the sample DRNhad the least HCN concentration among the flour samples (Table 2). With 166.38±0.32mg/100g, the 2h boiled sample (sample EVT) had the least phytate (56.60% reduction) in the flours. The 24h soaked and 1h boiled sample (DRN) had 249.58±0.47mg/100g (34.77% phytate reduction), while the samples BXY and CZK with 300.22±0.16 and 283.00±0.39 mg/100g phytate values had 21.54% and 26.04% phytate reductions respectively. Soaking as well as cooking are effective in reducing phytate, (Abiodun and Adeleke, 2011). The permissible limit of these anti-nutrients as reported by Ndidiet al (2014) are all above the values obtained from the pigeon pea flour samples. The FAO (1982) had also reported that the traditional methods or domestic preparations of legumes have largely overcome the problems of toxicity.
Table 3: Amino acid properties of the Processed Pigeon Pea Flour compared with FAO/WHO (1991) recommendation
| Sample | A | B | C | D | E | Anuonyee t al | Child |
| Leucine* | 7.47b±0.03 | 7.35c±0.02 | 7.18e±0.01 | 7.24d±0.02 | 7.53a±0.03 | 7.50 | 7.00 |
| Lysine * | 4.93c±0.01 | 5.04b±0.04 | 4.77d±0.02 | 4.72d±0.04 | 5.57a±0.03 | 6.87 | 5.30 |
| Isoleucine * | 4.18c±0.00 | 3.99d±0.00 | 5.52a±2.9 | 3.92e±0.01 | 4.39b±0.01 | 3.70 | 3.50 |
| Phenylalanine* | 5.32b±0.01 | 5.05c±0.02 | 4.61d±1.10 | 5.32b±0.02 | 5.50a±0.05 | 8.45 | 3.80 |
| Tryptophan* | 1.31a±0.01 | 1.26b±0.02 | 1.10c±0.01 | 0.89d±0.01 | 1.31a±0.04 | 1.10 | |
| Valine * | 5.20b±0.04 | 4.33d±0.03 | 4.68c±0.02 | 4.68c±0.01 | 5.32a±0.05 | 5.49 | 4.50 |
| Methionine * | 1.6b±0.01 | 1.42c±0.02 | 1.28d±0.01 | 1.39c±0.01 | 1.76a±0.06 | 1.38 | 1.50 |
| Proline | 4.36a±0.03 | 3.86c±0.04 | 3.65e±0.01 | 3.76d±0.03 | 4.06b±0.04 | 3.40 | |
| Arginine | 9.97b±0.00 | 9.12d±0.03 | 9.29c±0.02 | 9.29c±0.02 | 10.34a±0.02 | 6.47 | |
| Tyrosine | 3.96a±0.03 | 3.98a±0.12 | 3.78b±0.02 | 3.61c±0.04 | 3.96a±0.06 | 2.25 | |
| Histidine * | 2.24b±0.00 | 2.24b±0.03 | 2.17c±0.00 | 2.17c±0.00 | 2.3a±0.04 | 3.35 | 1.50 |
| Cystine | 1.63ab±0.03 | 1.57b±0.04 | 1.51±0.02 | 1.57b±0.04 | 1.66a±0.05 | 1.26 | 5.50 |
| Alanine | 4.32a±0.02 | 3.56d±0.05 | 3.72c±0.02 | 3.72c±0.05 | 4.02b±0.01 | 4.32 | |
| Glutamic Acid | 15.44c±0.04 | 19.95a±8.0 | 14.23e±0.03 | 14.61d±0.02 | 15.75b±0.05 | 15.17 | |
| Glycine | 4.42b±0.01 | 4.32c±0.03 | 3.8e±0.02 | 3.99d±0.05 | 4.56a±0.02 | 3.65 | |
| Threonine | 3.61a±0.01 | 3.44b±0.03 | 3.16d±0.02 | 3.28c±0.04 | 3.66a±0.04 | 3.22 | 2.30 |
| Serine | 4.38b±0.01 | 4.11d±0.02 | 4.10e±0.02 | 4.22c±0.59 | 4.54a±0.04 | 2.91 | |
| Aspartic Acid | 11.04b±0.01 | 10.48c±0.05 | 10.29e±0.02 | 10.42d±0.03 | 11.24a±0.02 | 8.90 | |
| TEAA | 32.25 | 30.68 | 31.31 | 30.33 | 33.68 | ||
| TNEAA | 63.13 | 64.39 | 57.53 | 57.47 | 63.79 |
**Results are expressed as mean ±SD (n=3). Values with different superscripts within the columns are significantly different from each other at p<0.05.
Key: AOP = Untreated flour; BXY = Salted: 1h boiled; CZK = Salted: 2h boiled; DRN = 24h soaked, 1h boiled and EVT = 2h boiled
*= Essential amino acid
The amino acid profiles of the processed flours were recorded in Table 3. There was significant difference (p < 0.05) among amino acids of the flour samples. Eight essential [EAAs] and ten non-essential amino acids [NEAAs] were assessed. The sum of the EAAs and NEAAs can be seen on Table 3. Leucine constituted the highest concentrated essential amino acid EAA for all the samples while GLU and ASP were the highest concentrated NEAA for all the samples. For GLU, ASP and LEU, the pattern of concentration was E>A>B>D>C. The order of concentration for LYS, MET and HIS were LYS E>B>A>C>D; for MET: E>A>B>D>C and for HIS: E>A>B>C>D. Thus the pattern for Leucine is similar to that of Methionine. Many authors have reported GLU and ASP as the highest concentrated AAs for legumes and their products while Adeyeye (2010) also reported the pattern of cooked > raw > other treatments for cooked and roasted groundnut seeds. The raw seeds’ flour of sample A was most concentrated in its Alanine (ALA), PRO, TYR and THR while samples A and E had equivalent values for Tryptophan. Sample E, had the highest concentrations of LEU, LYS, PHE, TRY, VAL, MET, ARG, TYR, HIS, CYS, GLY, THR, SER and ASP, comparatively. The rest of the amino acids were better concentrated in the sample E (2h straight cooked pigeon pea seeds’ flour). Arginine [ARG] constituted the highest single NEAA in all the samples, after Glutamic acid [GLU] and Aspartic acid [ASP] which are acidic AAs. The Essential Amino Acid Indices (EAAIs) of the test samples has higher content of essential amino acids compared to the reference protein for children used for comparison. The range of the EAAIs of the test samples are within the range of 112 to 128% with sample EVT having the highest value while sample DRN had the least value. Research has shown that a value of EAAI greater than 100% indicates that the test samples’ essential amino acid contents are higher than that of the reference protein, suggesting a better amino acid profile and higher protein quality. According to Houet al., (2022), a food product with a high EAAI score of more than 100 % indicates a good protein quality.
CONCLUSION
The work has revealed that cooked pigeon pea is a rich source of protein and carbohydrate. Soaking is an effective way of reducing the concentrations of the anti-nutrients, thus enhances bio-availability of nutrients to the consumers. Also the salt enhanced the softening of the beans, and at the same time, assisted in the reduction of the anti-nutrients in combination with cooking process. Altogether soaking, salt blanching and heat treatment through cooking enhance the quality of cooked pigeon pea.
REFERENCES
- Abeza, R.H, Blake, J.T and fisher, E.J. (1968). Oxalate determination: Analytical problems Encountered with certain plant species. Journal of the Association of Official Agricultural chemists 51:963-965.
- Abiodun, A. O, and Adeleke, R. O (2011). Effect of dehuling/soaking on the chemical, functional and nutritional contents of three varieties of Nutritional food science 41:117-22 [in Siddiq and Uebersax (2013)].
- AOAC (1990). Association of Official Analytical Chemists. Official Methods of Analysis of the (15th edition), Washington DC, USA:
- AOAC (2005). Association of official Analytical Chemists. Official Methods of Analysis of the (18th edition), Washington C. USA
- AOAC (2010). Association of official Analytical Chemists. Official methods of analysis of the (Horwitzed) 19th edition, current through Revision 3 Washington C. USA
- Anuonye, J.C., Ndaliman, M., Elizabeth, O.U. and Yakubu, M.C. (2012). Effect of blending on the composition and acceptability of blends of unripe banana and pigeon pea flours. Nigerian Food Journal (NIFOJ) 30 (1):116-123
- Bhat, Rajeev and Karim, A (2009). Exploring the nutritional potential of wild and underutilized legumes. Compressive Reviews in Food Science and Food Safety. 5:305-331
- Benitez, L.V (1989). Amino acid and Fatty acid profiles in Aquaculture Nutrition Studies, 23-25 in De Silva S.S (ed.) Fish Nutrition Research in Asia. Proceedings of the thirst Asian Fish Nutrition Network Meeting. Asian Fish Society Special Publication 4: 166p. Asian Fisheries Society, manila Philippines.
- Bora, (2014). Anti-Nutritional Factors in Foods and their Effects. Journal of Academia and Industrial Research 3(6):285-290.
- Echendu, A., Onimawo, I. A and Adieze, S. (2004). Production and Evaluation of Doughnut and Biscuits from maize- pigeon pea flour blends. Nigeria Food Journal Vol. 22 Pp 147-153
- FAO (1982). Legumes in Human Nutrition. 2nd Food and Agriculture Organization (FAO) Rome.
- Fasoyiro, S.B, Obatolu, V.A, Ashaye, O.A., Adeojo, E.A., Ogunleti, D.O. (2009). Chemical and sensory qualities of pigeon pea (Cajanuscajan) developed into a local spice “dawadawa” Nigeria Food Journal 27 (2) Pp 150-158
- Fellows, P. (2000). Food processing technology: principles and practice. CRC Press. Boca. Boston. New York. Washington DC.
- Gaman, P.M. and Sherrigton, K.B. (1977). The Science of Food an Introduction to Food Science, Nutrition and Microbiology, Pegamon Press Oxford New York Toronto Paris
- Harbone, B. (1973). Phytochemical Methods a guide to Modern Technology of Plant Analysis, 2ND ED, chapman and Hall (New York) Pp: 88-185.
- Hou S, Men Y, Wei M, Zhang Y, Li H, Sun Z, Han Y. Total Protein Content, Amino Acid Composition and Eating-Quality Evaluation of Foxtail Millet (Setariaitalica (L.) P. Beauv). 2022 Dec 22;12(1):31. doi: 10.3390/foods12010031. PMID: 36613247; PMCID: PMC9818070.
- Lucas, G.M. and P. Markaka, 1975. Phytic acid and other phosphorus compound of bean (Phaseolusvugaris) Agric. Ed. Chem., 23: 13-15.
- Lee, J.H; Moon,S.J, and Huh, K.B 919930 influence of Phytate and low dietary calcium on calcium, phosphate and zinc metabolism by growing rats. Journal of Nutrition and Health (26). 145-155.
- Moulisha B, Pallab, K.H. and Ashoke, K.G. (2016). Antioxidant and free radical scavenging effects of fruits of DregeaVolubilis. Journal of Natural Science, Biology and Medicine 1 (1); 29-34. DOI: 4103/0976-9668.71670.
- Ndidi, S, Ndidi, C. U., Aimola, I. A, Bassa, O.Y, Mankili, M and Adamu, Z (2014). Effect of processing (Boiling and Roasting) on the nutritional and anti-nutritional properties of Bambara Groundnuts (Vigna subterranean (L) Verdc) from southern Kaduna. Hindwai Publishing Corporation Journal of Food Processing Pp.1-9. http://dx.doi.org/10- 1155/2014/472129
- Nwanekezi, C., Onuoha F.C., Arukwe, D.C.,andOdimegwu, E.N., (2019). Proxiamte composition and Hyperlipidemia lowering potential of Rice Bran Enriched with yam flour. Nigerian Food J., 37: (1) 11-23.
- Nzelu, C. (2010): Identification, Composition and Processing of Tropical Food Commodities. Published in Nigeria by Eaglets Publishers. 2 Ekwueme Close Abakpa Nike, Enugu, Nigeria. ISBN: 978-978-49575-8-8
- Okaka J.C. and Okaka AN C (2001) Foods: Composition Spoilage, Shelf-Life Extension OcJanco Academic Publishers, 4 Oboro street Independence Layout, Enugu
- Oladele, A. K., Osunahunsi, O. F. and Adebowale, Y. A. (2009). Effects of processing techniques on the nutrients and antinutrients contents of tigernut (Cyperusesculentus I.) Nigerian Food Journal 27 (2) Pp 210-218.
- Onimawo, A and Akubor, P. I. (2012). Food Chemistry: Integrated Approach with Biochemical Background. Published in Nigeria by Ambik Press LTD. ISBN: 978-379229-9- 7. Pp 287-314.
- Onu, P.N. and Okongwu, S.N. (2006). Performance characteristics and nutrient utilization of starter broilers fed raw and processed pigeon pea (Cajanuscajan) seed meal. International Journal of Poultry Science, 5(7): 693–697.
- Saxena, B., Kumar, R.V. and Sultana, R. (2010). A Review Health 2, 1335-1344
- Salunkhe, D. K, Chavan, J. K and Kadam, S. S. (1986). Pigeon pea as an important food source, Critical Review in Food Science Nutrition 23: 103- https://doi.org/10.1080/10408398609527422
- Siddiq, M and Uebersax A. (2013). Dry beans and Pulses, Production Processing and Nutrition. Wiley Blackwell. John Wiley and Son Publications.
- Steinke, H., Prescher, E.E. and Hopkins, D.T. (1980). Nutritional Evaluation (PER) of isolated soy-bean protein and combination of Food proteins, J. Food Sci. 45(2), pp. 323-327
- Uchegbu, N (2018). Assessment of the Anti-oxidant potential moi-moin produced from Germinated pigeon pea (cajanuscajan flour) Proc. of the 4thRefost, Awka.