
Temporal Variations of Heavy Metal Concentrations in Selected Fishes, Sediments and Surface Water along an Artisanal Refinery Site, Rivers State, Nigeria
- Florence Chinedu Akubuo
- Leo C. Osuji
- Aduabobo. I. Hart
- 290-306
- Nov 23, 2023
- Environmental Assessment
Temporal Variations of Heavy Metal Concentrations in Selected Fishes, Sediments and Surface Water along an Artisanal Refinery Site, Rivers State, Nigeria
*Florence Chinedu Akubuo1, Leo C. Osuji1,2 & Aduabobo. I. Hart1,3
1Institute of Natural Resources, Environment and Sustainable Development (INRES), University of Port Harcourt, P.M.B 5323, Choba, Port Harcourt, Nigeria.
2World Bank Africa Centre of Excellence in Oilfield Chemicals Research (ACE-CEFOR), University of Port Harcourt P.M.B 5323, Choba, Port Harcourt, Nigeria.
3Department of Animal and Environmental Biology, University of Port Harcourt, P.M.B 5323, Choba, Port Harcourt, Nigeria.
*Corresponding Author
DOI: https://doi.org/10.51244/IJRSI.2023.101029
Received: 30 September 2023; Revised: 18 October 2023; Accepted: 23 October 2023; Published: 23 November 2023
ABSTRACT
This study determined the temporal variations of heavy metal (Lead (Pb), Iron (Fe), Zinc (Zn), Arsenic (As), Copper (Cu) and Cadmium (Cd) concentrations in selected fishes, sediments and surface water along an artisanal refinery site in Rivers State, Nigeria. Water and sediment samples were collected aseptically in screw-capped bottles at both low and high tides from approximately 20 cm below the surface. Live Flathead grey mullet (Mugil cephalus), swimming crabs (Callinectes amnicola), periwinkles (Tympanotonus fuscatus) and Guinean tilapia (Tilapia guineensis) were collected at the Ibaka waterfront for six months at an interval of one month from local fishermen. The sampling was carried out between November 2022 and April 2023 for statistical variation. Heavy metal content was analyzed using standard methods. The study found temporal variations in Cu, Zn, and Fe concentrations in four fish species from Ibaka Creek in Okrika, indicating potential contamination. However, Pb, Cd, and As concentrations remained constant throughout the sampling period. Cd and Fe concentrations exceeded recommended threshold values, raising concerns about health and environmental risks. Pb, Zn, As, and Cu concentrations remained within acceptable limits, indicating lower risks to human health and the environment. Sediment samples showed variation in Pb concentrations, exceeding EPA thresholds but within WHO guidelines. The findings emphasize the urgent need for attention to address heavy metal contamination in the area, including strict regulations and monitoring of artisanal refinery activities.
Keywords: Heavy metals, Temporal trends, Contamination, Artisanal refinery, Health risks
INTRODUCTION
Nigeria’s heavy reliance on crude oil, primarily located in the Niger Delta region, is a well-established fact. This region is home to a total of 606 oil fields, with 355 of them situated onshore and 251 offshore, encompassing 5,284 operational oil wells and an extensive network of 7,000 kilometres of oil and gas pipelines (Akpotor, 2019; Onyena and Sam, 2020). Nigeria, boasting an average daily oil production of 2.2 million barrels, holds the top position in Africa and ranks sixth globally in this regard (Oluniyi, 2017; Omoregie, 2019). Over the past three decades, the profits generated from oil have played a pivotal role in Nigeria’s economy, constituting nearly 11% of its GDP, 95% of its foreign exchange earnings, and 83% of all revenue collected by the Federal Government (NNPC, 2019).
However, the consequences of these oil-related activities have made it increasingly difficult to preserve the quality of the aquatic ecosystem within the Niger Delta. Numerous studies have documented this impact (Sam and Zabbey, 2018; Okoyen et al., 2020). Runoff, atmospheric deposition, and uncontrolled effluent discharges from urban, municipal, and industrial sources have collectively exacerbated the challenge of evaluating water quality in streams, rivers, and marine environments (Bashir et al., 2020; Odekina et al., 2021).
Spilled oil on the surface of water has the potential to swiftly disperse and, through bacterial processes or oxidation, may either dissolve or descend to the seabed. This can cause substantial harm to aquatic life and the sediment (Onyena and Sam, 2020; Bacosa et al., 2022). Oil contamination causes sediment degradation near the surface, contributing to biodiversity loss and habitat destruction (Sayed et al., 2021). The mangrove regions affected by oil spills are also susceptible to health hazards and other environmental issues (Zhang et al., 2019; Obida et al., 2021).
In the Niger Delta, human activities linked to petroleum exploration, development, and production frequently lead to oil leaks (Sam and Zabbey, 2018; Sakib, 2021). Among coastal environments, tidal wetlands within the Niger Delta are regarded as highly prone to recurrent oil spills (Zhang et al., 2019; Onyena and Sam, 2020). Mangroves, in particular, prove exceptionally sensitive to both legal and illicit discharge of crude oil and industrial waste, resulting in substantial oil contamination in coastal regions (Sakib, 2021). Over the past six decades, there have been 238 significant oil spills in areas dominated by mangroves, leading to the direct release of approximately 5.5 million tons of oil and the devastation of up to 1.94 million hectares of mangrove habitat, thereby annihilating at least 126,000 hectares of mangrove ecosystems (Onyena and Sam, 2020). Even within the marine ecosystem, oil exploration within or in proximity to mangrove shorelines can exert considerable adverse effects (US Fish and Wildlife Services, 2013; Zhang et al., 2019).
The transition from traditional artisanal crude oil refining to illicit lowland and concessional refining in Nigeria’s Niger Delta region has given rise to detrimental socioeconomic and environmental consequences (Ite et al., 2013; Kalu, 2018). Given the widespread prevalence of artisanal crude oil refining and the substantial upsurge in illegal refining activities, it becomes imperative to evaluate the health hazards linked to these practices (Ite et al., 2013). The refining process often results in the release of persistent metals with a heightened potential for bioaccumulation. These metals can exert neurotoxic and carcinogenic effects when humans are exposed to them through inhalation, ingestion, or skin contact (Fu et al., 2020). Consequently, significant attention has been directed towards comprehending the adverse impacts of metal pollution on both human health and the environment due to their persistence, culminating in ecological and health risks (Abdel-Shafy et al., 2016; Opete et al., 2019).
The aim of this study is to evaluate the concentration of heavy metals in water, sediment, and selected fish species along Ibaka Creek. The study focuses on an artisanal refinery site located in the Okrika Local Government Area of Rivers State, along the upper reaches of the Bonny estuary. The study aimed to identify how these heavy metals can bioaccumulate in the water, sediment, and selected fish species and how they can affect the ecosystem in accordance with regulatory and public health guidelines.
MATERIALS AND METHODS
Description of Sampling Areas
The research was conducted in the Ibaka waterfront, a tidal mangrove region situated in the Niger Delta, Nigeria, as indicated in Figure 1. The Ibaka mangrove swamp falls within the geographic coordinates of 4°43’55.7″N to 4°45’02.5″N latitude and 7°04’07.4″E to 7°04’38.4″E longitude. The region is constantly inundated with waste from various sources, including animal, human, and domestic activities. The waste is generated through sewage discharge, refuse disposal, and commercial waste disposal, which are deposited into the tidal river. Additionally, the sample site is in proximity to Creeks and neighbouring communities such as George Ama, Ogoloma, and ACT Jetty. The study area is susceptible to effluent discharge from industries and a densely populated coastal settlement.
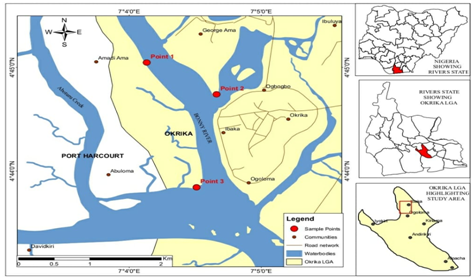
Figure 1: Section of the Ibaka sampled stations studied.
Heavy Metal Analytical Procedure and Methods
Fish Samples Collection
Samples of Flathead grey mullet (Mugil cephalus) and Guinean tilapia (Tilapia guineensis) were collected from the Ibaka creeks using fishing nets (Cast nets) that were cast and left overnight. Swimming crabs (Callinectes amnicola) were captured using dragnets, while periwinkles (Tympanotonus fuscatus) were handpicked from the mud flat. Upon retrieval, the fish samples were promptly placed in pre-cleaned polythene bags, sealed, labelled, and stored in ice boxes (4 ºC) for transportation to the laboratory. In the laboratory, these samples were stored in a deep freezer until the point when muscule tissues were extracted for analysis. Muscular tissues were specifically chosen for analysis in this study because they represent the most commonly consumed part of the fish. It’s important to note that these four fish species are staples in the diets of the Ibaka community in the Okrika local government area of Rivers State throughout the year.
Total Digestion for Heavy Metals
The fish samples were subjected to a series of preparation steps. Initially, the samples were dried and then granulated using a blender. Subsequently, extraction was carried out utilizing a mixture of Nitric acid, Perchloric acid, and Sulphuric acid, following the APHA 3030I modified complete digestion method as outlined in Table 3.1.
During the extraction process, One gram of the granulated fish samples was accurately weighed and placed into a 250ml Pyrex conical flask. Then, 20ml of the digestion solution was added to the flask. The samples were carefully heated within a fume hood using an electrical mantle at a temperature of 250°C. The granules underwent a noticeable colour change, transitioning from dark to grey, signifying the completion of digestion. Subsequently, the digested solution was removed from the fume hood and allowed to cool on the workbench. An additional 20 ml of distilled water was introduced, followed by further cooling. The digested solution was then meticulously sieved through Whatman 42 ashless filter paper into a 100ml glass volumetric flask. The filtrate in the volumetric flask was brought up to the 100ml mark on the flask. This solution was subsequently transferred into a clean 100ml plastic bottle and labelled accordingly. These prepared sample extracts were then ready for analysis using Flame Atomic Absorption Spectroscopy (AAS) to determine the levels of Pb, Fe, Zn, As, Cu, and Cd. To maintain rigorous quality control and assurance, standard operating procedures, reagent blanks, and spiked sample recovery tests were all implemented to ensure the consistency and accuracy of the results.
Sampling and Digestion of Sediment
Sediment samples, collected during the sampling period from November 2022 to April 2023, were obtained from the mud flats bottom surface, specifically from the upper 0 to 5 cm layer, using an Eckman grab, following the methodology of Osman and Kloas (2010). Each sediment sample consisted of three randomly selected grabs, retrieved from the creek banks, carefully organized, and placed into clean polyethylene bags. The surface layer was chosen for analysis due to its role in regulating metal transfer between sediments and water, and its function as a repository for metals that benthic species are exposed to (Chakraborty, 2017).
The polythene bags were labelled with the sampling location and date, and the samples were maintained at a chilled temperature in an ice box during transportation to the laboratory. Upon arrival, the samples were stored in a laboratory freezer at -20°C until they were ready for preparation and subsequent heavy metal analysis. The sediment samples were allowed to reach room temperature (25 to 28°C) before being placed in acid-cleaned evaporating beakers for digestion. They were then dried in an oven at 50˚C until they reached a consistent weight. Subsequently, the dried sediment samples were crushed using a ceramic mortar and pestle and sifted through a polypropylene sieve with a 2 mm mesh size.
For digestion, a mixture of concentrated nitric acid (Analytical grade) and hydrochloric acid in a 1:3 ratio (aqua regia) was used. An accurate 2 g of dry sediment was measured using an electronic weighing scale and placed into a 50 mL beaker, which had been acid-cleaned. The sediment was then combined with 9 mL of a freshly prepared solution of HNO3 and HCl, and gently heated over a water bath until the volume was reduced to 20 mL. Subsequently, the digested sample was filtered through a Whatman 0.42 μm filter paper into a 50 mL volumetric flask, which was then filled to the mark with distilled-deionized water. AAS was employed to analyze the heavy metal content in the filtrate, and a blank solution was created in a similar manner, using distilled water.
Sampling and Digestion of Water
Surface water sampling followed the procedure outlined by Ndimele and Kumolu-Johnson (2012). From November 2022 (Rainy season) to April 2023 (Dry season), surface water samples were randomly collected from the creek at three different points, approximately 0.3 meters below the water surface. To ensure consistency, each location’s samples were thoroughly mixed and then divided into three separate 500 ml plastic bottles.
Before sampling, the containers were meticulously cleaned using 10% nitric acid and subsequently rinsed with distilled water. The bottles underwent three rounds of rinsing with water from the creek just before sampling. Samples were obtained directly by immersing the sampling bottle into the surface water. Immediately following sample collection, 2 mL of nitric acid (AR grade) was introduced into the water samples to minimize metal adsorption onto the plastic bottle walls. The sample bottles were then labelled to specify the sampling date and site, after which they were placed in an ice box for transportation to the laboratory. Upon arrival at the laboratory, the samples were stored at 4˚C until they were ready for analysis. The digestion of the water samples was conducted in triplicate, using concentrated nitric acid (Analytical Grade), following the methodology outlined by Zhang (2012).
Quality assurance and control
The analysis equipment was initially calibrated using buck-certified atomic absorption standards for various heavy metals, enabling the generation of a calibration curve. To address potential equipment drift, a reagent blank was periodically run after every 10 sample analyses. The recovery rates consistently fell within the range of 82% to 110%. Metal concentrations in both sediment and biota samples were determined using atomic absorption spectrophotometry (Model 210 VGP, Buck Scientific).
Statistical Analysis
To determine the average, range, mean, and standard deviations of the examined samples, descriptive statistics were used. In addition, two-way analysis of variance (ANOVA) at a significance level of 0.05. were performed on the findings. The statistical evaluation was carried out using IBM SPSS 23 software.
RESULTS AND DISCUSSION
Results
Temporal Variation of Heavy Metals in Redbelly Tilapia (Tilapia guineensis)
Figure 2 shows the Temporal Variation of Heavy Metals in Redbelly Tilapia (Tilapia guineensis) from Ibaka Creek in Okrika from November 2022 to April 2023. The mean concentration of Lead did not vary significantly (P < 0.05) from 0.002±0.0 mg/kg in November to 0.002±0.0 mg/kg in April while copper ranged between 0.001±0.0 mg/kg in November to 0.40±0.0 mg/L in March. The Cadmium and Arsenic did not vary between 0.01±0.0 mg/L in November and April while Zinc ranged from 1.57±0.13 mg/kg in April to 1.85±0.0 mg/kg in December. The concentration of Iron ranged between 1.89±0.33 mg/kg in December to 7.22±0.23 mg/kg in January. The Copper concentration was higher in March while Zinc was highest in December. Iron was highest in January. The Copper concentration was lower in November while Zinc was lower in November as well. The monthly variation in the concentrations of the heavy metals in Zinc, Iron, and Copper in the red redbelly tilapia (Tilapia guineensis) was significantly different (P > 0.05) across the months. However, no significant (P < 0.05) variation was observed in the concentrations of Cadmium, Lead, and Arsenic across the months.
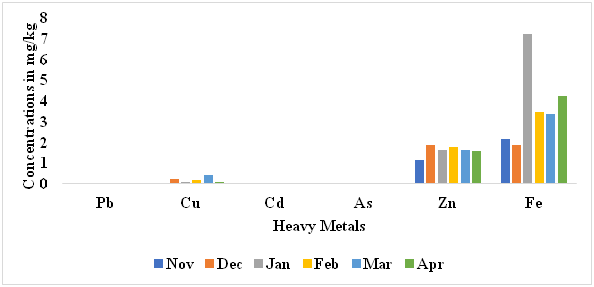
Figure 2: Temporal Variation of Heavy Metals in Redbelly Tilapia (Tilapia guineensis) from Ibaka Creek in Okrika.
Temporal Variation of Heavy Metals in Flathead grey mullet (Mugil cephalus)
Figure 3 presents the temporal variation of heavy metals in Flathead grey mullet (Mugil cephalus) obtained from Ibaka Creek in Okrika, spanning from November 2022 to April 2023. The mean concentration of Lead (Pb) was observed to be consistent (P < 0.05) at 0.002±0.0 mg/kg between November and April. Copper (Cu) concentrations ranged from 0.001±0.0 mg/kg in November to 0.32±0.0 mg/L in January. Cadmium (Cd) ranges between 0.01±0.0 mg/L in November and 0.05±0.0 mg/L in January while the concentrations of Arsenic were stable at 0.01±0.0 mg/L between November and April, while Zinc showed a slight variation from 1.50±0.01 mg/kg in December to 1.79±0.01 mg/kg in February. Iron (Fe) concentrations ranged from 1.23±0.23 mg/kg in January to 5.38±0.0 mg/kg in March. The concentrations of Arsenic and Lead were stable at 0.01±0.0 mg/L and 0.002±0.0 mg/kg respectively between November and April. The concentrations of Copper and Cadmium were highest in January, while the concentration of Iron was highest in March and the Zinc concentration highest in February. On the other hand, Zinc, Copper and Iron concentrations were lower in November. The monthly variation in the concentrations of copper, cadmium, Zinc and Iron, in the Flathead grey mullet (Mugil cephalus) was observed to be significantly different (P > 0.05) across the months. However, no significant (P < 0.05) variation was observed in the concentrations of Lead, and Arsenic across the months.

Figure 3: Temporal Variation of Heavy Metals in Flathead grey mullet (Mugil cephalus) from Ibaka Creeks.
Temporal Variation of Heavy Metals in Periwinkle (Tympanotonus fuscatus)
Figure 4 illustrates the temporal changes in heavy metal concentrations in Periwinkle (T. fuscatus) samples collected from Ibaka Creek in Okrika over the period of November 2022 to April 2023. The results showed that Lead (Pb) concentrations remained consistent at 0.002±0.0 mg/kg from November to April. No significant differences (P < 0.05) were observed in the months. Copper (Cu) concentrations ranged from 0.10±0.0 mg/kg in November to 0.95±0.04 mg/kg in February. Cadmium (Cd) concentrations varied from 0.01±0.0 mg/kg in December to 0.11±0.0 mg/kg in November, while the concentrations of Arsenic remained stable at 0.01±0.0 mg/kg between November and April. Zinc concentrations exhibited a slight variation, ranging from 0.71±0.34 mg/kg in December to 2.24±0.16 mg/kg in January. Iron (Fe) concentrations ranged from 1.16±0.0 mg/kg in November to 5.61±0.69 mg/kg in January.
The concentrations of Arsenic and Lead were observed to remain stable at 0.01±0.0 mg/L and 0.002±0.0 mg/kg, respectively, from November to April. Zinc and Iron concentrations were highest in January, while Copper concentration was highest in February, and Cadmium concentration was highest in November. On the other hand, Iron and Copper concentrations were lower in November while Zinc and Cadmium concentrations were lower in December. The monthly variations in the concentrations of Copper, Cadmium, Zinc, and Iron in Tympanotonus fuscatus were significantly different (P > 0.05) across the months. However, there was no significant (P < 0.05) variation in the concentrations of Lead and Arsenic across the months.
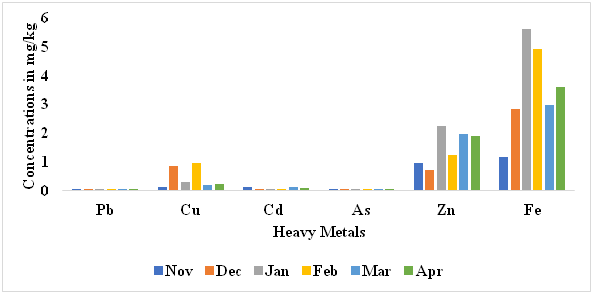
Figure 4: Temporal Variation of Heavy Metals in Periwinkle (Tympanotonus fuscatus) from Ibaka Creeks.
Temporal Variation of Heavy Metals in Swimming Crab (Callinectes amnicola)
Figure 5 presents the changes in heavy metal concentrations in Swimming Crab (Callinectes amnicola) samples collected from Ibaka Creek in Okrika over the period of November 2022 to April 2023. The findings indicate that Lead (Pb) concentrations were consistent (P < 0.05) at 0.002±0.0 mg/kg between November and April. Copper (Cu) concentrations ranged from 0.002±0.0 mg/kg in November to 0.92±0.0 mg/kg in December. Cadmium (Cd) concentrations varied from 0.01±0.0 mg/kg in March to 0.11±0.0 mg/kg in January, while Arsenic concentrations remained constant at 0.001±0.0 mg/kg from November to April. Zinc concentrations showed a slight variation, ranging from 2.12±0.02 mg/kg in March to 4.94±0.00 mg/kg in December. Iron (Fe) concentrations ranged from 3.86±0.0 mg/kg in March to 6.41±0.06 mg/kg in April.
The concentrations of Arsenic and Lead remained constant at 0.001±0.0 mg/kg and 0.002±0.0 mg/kg, respectively, from November to April. Zinc and copper concentrations were highest in December, while Cadmium concentration peaked in January, and Iron concentration reached its highest level in January. Conversely, Cadmium, Zinc and Iron concentrations were lower in March, Copper recorded the lowest in November while Zinc and Cadmium concentrations were lower in April and March respectively. The monthly variations in the concentrations of Copper, Cadmium, Zinc, and Iron in Callinectes amnicola exhibited significant differences (P > 0.05) across the months. However, no significant (P < 0.05) variation was observed in the concentrations of Lead and Arsenic throughout the months.
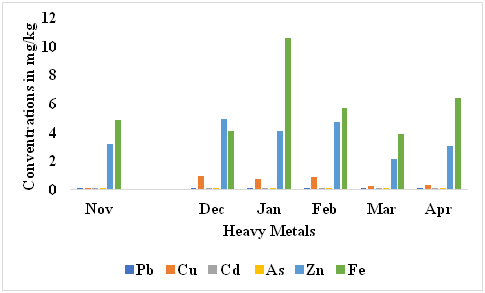
Figure 5: Temporal Variation of Heavy Metals in Swimming Crab (Callinectes amnicola) from Ibaka Creeks.
Temporal Variation of Heavy Metals in Sediment from Ibaka Creeks.
The figure presented in 6 showcases the changes in heavy metal concentrations in Sediment samples collected from Ibaka Creek in Okrika during the period of November 2022 to April 2023. Results showed that Lead (Pb) concentrations varied between 0.01±0.0 mg/kg in November and 0.49±0.0 mg/kg in March. Copper (Cu) concentrations ranged from 0.09±0.0 mg/kg in November to 0.93±0.0 mg/kg in March and April. Cadmium (Cd) concentrations were constant at 0.001±0.0 mg/kg in November, December, January, and February and then varied from 0.02±0.0 mg/kg in April to 0.03±0.0 mg/L in March. Meanwhile, Arsenic concentrations remained stable at 0.001±0.0 mg/kg between November and April while Zinc concentrations exhibited variations, ranging from 0.96±0.0 mg/kg in November to 2.73±0.33 mg/kg in March. Iron (Fe) concentrations ranged from 1.26±0.0 mg/kg in November to 15.87±0.0 mg/kg in December. The concentrations of Arsenic remained stable at 0.001±0.0 mg/kg from November to April. Lead, Copper, Cadmium, Zinc, and Iron concentrations in the sediment were lower in November, while Lead, Copper, Cadmium, and Zinc concentrations were higher in March and Iron concentrations reached its highest level in December. The monthly variations in the concentrations of Lead, Copper, Cadmium, Zinc, and Iron in the sediment exhibited significant differences (P > 0.05) across the months. However, there was no significant (P < 0.05) variation was observed in the concentrations of Arsenic across the months.
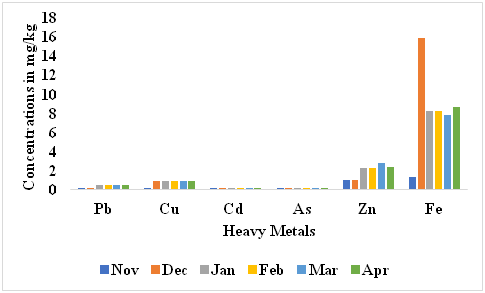
Figure 6: Temporal Variation of Heavy Metals in Sediment from Ibaka Creeks.
Temporal Variation of Heavy Metals in Surface Water from Ibaka Creeks.
In this study, surface water samples were collected from Ibaka Creek in Okrika between November 2022 and April 2023 to assess the changes in heavy metal concentrations. The results (Figure 7) revealed that Lead (Pb) concentrations ranged from 0.00±0.0 mg/kg in April to 0.002±0.0 mg/L in November and December. Copper (Cu) concentrations varied from 0.04±0.0 mg/L in November to 0.97±0.0 mg/L in March. Cadmium (Cd) concentrations were stable at 0.001±0.0 mg/L from November to April. Arsenic concentrations remained constant at 0.001±0.0 mg/L from November to April while Zinc concentrations exhibited variations ranging from 0.59±0.0 mg/kg in November to 0.93±0.0 mg/kg in March. Iron (Fe) concentrations ranged from 0.31±0.0 mg/kg in November to 1.17±0.0 mg/kg in March and April. The concentrations of Cadmium and Arsenic did not vary (P < 0.05) from November to April. Copper, Zinc, and Iron in the water were lower in November, while the highest concentrations values were in March. The concentrations of Lead, Zinc, Iron, and Copper showed significant monthly variations (P > 0.05), while. Arsenic and Cadmium concentrations did not show significant changes (P < 0.05) across the months.
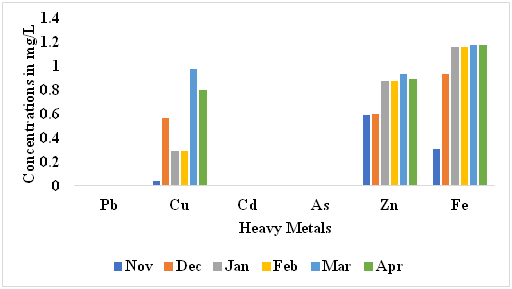
Figure 7: Temporal Variation of Heavy Metals in Surface Water from Ibaka Creeks.
DISCUSSION
Temporal Variation of Heavy Metals in the four fish species
The results presented in Figures 2, 3, 4, and 5 describe the temporal variations in heavy metal concentrations in different fish species (Redbelly Tilapia, Periwinkle, Swimming Crab, and Flathead grey mullet) collected from Ibaka Creek in Okrika over a period of six months. The redbelly tilapia, Periwinkle, and Swimming Crab showed temporal variations in the copper, zinc, and iron concentrations, indicating potential sources of contamination during specific periods. Lead, cadmium, and arsenic concentrations did not show significant variations across the months. For Flathead grey mullet, lead and arsenic concentrations remained stable, while copper and cadmium concentrations exhibited higher values in January. Zinc and iron concentrations showed slight variations across the observed months.
The concentrations of Cadmium (Cd) and Iron (Fe) in the four fish species exceeded the recommended threshold values of 0.005 set by the United States Environmental Protection Agency (EPA, 2020) and 0.3 recommended by the World Health Organization’s Guidelines (WHO, 2011). These elevated levels raise concerns regarding potential health and environmental risks associated with heavy metal contamination. On the other hand, the concentrations of Lead (Pb), Zinc (Zn), Arsenic (As), and Copper (Cu) were within the recommended threshold values. This suggests that the levels of these heavy metals in the studied fish species did not surpass the limits established by the EPA and WHO, indicating a relatively lower risk of adverse effects on human health and the environment.
The results showed that heavy metal concentrations in fish species varied across different months, suggesting temporal fluctuations in pollution levels (Chitmanat and Traichaiyaporn, 2010; Yu et al., 2020). This variation could be attributed to seasonal changes, such as variations in water flow, runoff, and pollutant inputs (Allafta and Opp, 2020). The variations in heavy metal concentrations among these species indicate differences in their exposure to pollutants and their ability to accumulate or eliminate heavy metals (Khan et al., 2015). Zhou et al. (2013) stated that such species-specific differences are crucial for understanding the ecological impacts and potential risks associated with heavy metal contamination in different trophic levels of the aquatic food chain.
Some heavy metals, such as Lead and Arsenic, exhibited stable concentrations throughout the monitoring period in all fish species studied (Zhuet al., 2013). This suggests that these metals may have a more persistent source of contamination or that their accumulation and elimination rates in the studied species are relatively balanced. Davies and Efekemo (2022) reported that stable concentrations over time highlight the importance of continuous monitoring to ensure that contamination levels remain within acceptable limits. The results also indicated significant temporal variations in the concentrations of certain heavy metals across different months. Copper, Zinc, and Iron showed significant variations in concentration levels in some fish species. This suggests the influence of seasonal factors, such as changes in environmental conditions, hydrology, or anthropogenic activities, on the input and accumulation of these metals in the studied fish species (Allafta and Opp, 2020; Islam et al., 2021).
Sonone et al. (2020) stated that the presence of heavy metals in fish species has implications for both human health and ecosystem integrity. Consumption of contaminated fish can pose risks to human health, especially if heavy metal concentrations exceed safe limits (Bat and Arici, 2018). Additionally, Davies and Ekperusi, 2021) agreed that the accumulation of heavy metals in fish indicates the potential impact on aquatic organisms and the overall ecosystem health. These findings highlight the need for continued monitoring, risk assessment, and mitigation strategies to protect both human populations and the environment.
Temporal Variation of Heavy Metals in Sediments from Ibaka Creeks.
The results presented in Figure 6 describe the changes in heavy metal concentrations in sediment samples collected from Ibaka Creek in Okrika over six months. Lead concentrations showed variations across the months, ranging from 0.01±0.0 mg/kg in November to 0.49±0.0 mg/kg in April. The increase in lead concentration from November to April suggests potential inputs or sources of lead contamination in the sediment during that period (Sonone et al., 2020). These variations highlight the importance of ongoing monitoring to assess lead contamination levels and potential environmental and human health risks associated with exposure to lead-contaminated sediment (Chris, et al., 2023). The Lead concentrations in the sediment exceeded the recommended threshold values of 0.015 set by the United States Environmental Protection Agency (EPA, 2020) but were within that (0.01) recommended by the World Health Organization’s Guidelines (WHO, 2011).
Xiao et al. (2013) stated that Lead concentrations in the sediment suggest potential environmental risks and concerns. Exceeding the EPA threshold indicates that the sediment may pose a higher risk of Lead contamination to the surrounding ecosystem (Ustaoğlu et al., 2020). Ali et al., 2019 stated that lead is a toxic heavy metal that can have detrimental effects on aquatic organisms, wildlife, and human health. Sall et al. (2020) also reported that lead can bioaccumulate in the food chain, leading to long-term consequences for both aquatic and terrestrial organisms. The presence of elevated Lead concentrations in the sediment can indicate pollution from various sources such as industrial activities, urban runoff, or historical contamination (Ali et al., 2019).
The concentrations of copper showed variations throughout the study period, ranging from 0.09±0.0 mg/kg in November to 0.93±0.0 mg/L in March and April. Copper concentration was within the threshold values recommended by the World Health Organization (WHO) in 2011 and the Environmental Protection Agency (EPA) in 2020. The WHO and EPA guidelines suggest that iron concentrations should not exceed 2.0 mg/kg and 1.3 mg/kg, respectively. The higher copper concentrations in March and April may be indicative of increased inputs of copper from external sources or seasonal influences. These variations emphasize the need for continuous monitoring to identify potential sources and assess the ecological and health implications of copper contamination in sediment.
Cadmium concentrations did not differ at 0.001±0.0 mg/kg from November to February and then varied in March and April, ranging from 0.02±0.0 mg/L to 0.03±0.0 mg/L. The stability of cadmium concentrations in the sediment during the initial months may suggest a relatively consistent level of cadmium contamination (Caballero-Gallardo et al., 2020). However, the subsequent variations in March and April indicate potential changes in the sources or environmental conditions influencing cadmium accumulation (Zhou et al., 2023). Further investigation is needed to understand the drivers of these variations and their implications for ecosystem health and human exposure.
Zinc concentrations exhibited variations, ranging from 0.96±0.0 mg/kg in November to 2.73±0.33 mg/kg in March. Iron concentrations also showed variability, ranging from 1.26±0.0 mg/kg in November to 15.87±0.0 mg/kg in December. These fluctuations in zinc and iron concentrations suggest temporal changes in their accumulation in the sediment (Bastakoti et al., 2019). The higher levels of zinc and iron during certain months may be associated with specific environmental conditions or inputs during those periods (Yang et al., 2013). Understanding the underlying factors driving these variations is crucial for assessing the potential risks associated with zinc and iron exposure in the ecosystem.
The monthly variations in lead, copper, cadmium, zinc, and iron concentrations in the sediment were found to be significantly different across the months. These variations highlight the dynamic nature of heavy metal accumulation in the sediment and indicate potential influences from seasonal factors, hydrological conditions, and anthropogenic activities (Zhao et al., 2021). Yin et al. (2020) stated that monitoring and studying these variations are important for evaluating the impacts on sediment quality, ecosystem health, and potential risks to organisms and human populations. The sediment samples from Ibaka Creek showed temporal changes in heavy metal concentrations, requiring continuous monitoring to identify sources, understand driving factors, and assess ecological and human health risks. Stable arsenic concentrations indicate consistent contamination, but further assessment against guidelines is necessary (Liu et al., 2017; Chi et al., 2018).
Temporal Variation of Heavy Metals in Surface Water from Ibaka Creeks.
The results obtained from the study on heavy metal concentrations in surface water samples collected from Ibaka Creek in Okrika revealed variations in the concentrations of different elements over the course of the study period (Figure 7). Lead (Pb) concentrations showed relatively low values throughout the study period, ranging from 0.00±0.0 mg/kg in April to 0.002±0.00 mg/kg in November. The values were consistent and did not show significant monthly variations (P < 0.05). The slight variations in Lead concentrations showed that there were no significant changes in its accumulation over time (Raju et al., 2013). Lead levels remained constant over the course of the research, indicating that lead contamination in Ibaka Creek was not a major problem during the months of the sampling. Furthermore, Chang et al. (2014) reported indications regarding the potential health risks associated with significant lead ingestion in children. According to their study, children who consume minimal amounts of lead may experience various adverse effects, including blood anaemia, kidney damage, severe stomachache, muscle weakness, and brain damage. The concentration of lead and the duration of exposure are crucial factors in determining the extent of lead toxicity (Giri et al., 2018). The study stresses that acute poisoning happens when people are exposed to raised lead concentrations for a brief period of time. According to Chang et al. (2014), the deleterious consequences of lead intoxication are more severe in these situations and can interfere with crucial metabolic processes, endangering human life seriously. These findings highlight the significance of taking lead exposure concentration and time into account when evaluating the possible health effects of lead poisoning.
Copper concentrations varied from 0.04±0.0 mg/L in November to 0.97±0.0 mg/L in March. This indicates a significant increase in copper concentration during the period. The higher concentrations of copper in March suggest increased inputs or sources of copper contamination during that period. However, copper concentrations exhibited a significant increase in March, indicating a potential source of copper pollution during that month. Copper is a common pollutant that can be derived from various sources, including industrial activities and agricultural runoff (Ganugapenta et al., 2018). The significant monthly variation in copper concentrations highlights the need for further investigation to identify potential sources and understand the factors driving these variations. Mutoti et al. (2023) further stated that it is necessary to identify the cause and evaluate its environmental impact and understanding the factors contributing to the temporal variations can aid in developing effective management strategies to minimize the adverse effects on the environment and potentially protect human health. In summary, the results suggest a significant increase in copper concentrations during the specified period, particularly in March. This finding highlights the importance of conducting further investigations to identify the sources, evaluate the environmental impact, and implement appropriate measures to address copper pollution.
Cadmium concentrations remained stable at 0.001±0.0 mg/L from November to April, indicating no significant changes (P < 0.05). between the months. Cadmium and arsenic concentrations remained stable and did not show significant changes across the sampled months. This suggests that these heavy metals might have a relatively consistent source or that the levels of contamination were relatively low during the study period (Padoan et al.,2019).
Arsenic concentrations remained constant at 0.001±0.0 mg/L from November to April. Similar to Cadmium, there were no significant changes (P < 0.05) in arsenic concentrations across the months. The arsenic concentrations remained relatively stable throughout the period from November to April. The average concentration was reported as 0.001±0.0 mg/L, indicating that there was no significant variation in the levels of arsenic during this time frame. The pattern observed for arsenic concentrations is similar to that of cadmium concentrations, as mentioned in the statement. This implies that both these elements exhibited comparable behaviour over the months under investigation. The result shows no significant changes in arsenic concentrations across the months. This implies that there were no notable fluctuations or trends observed during the specified period. The absence of significant changes indicates a relatively constant presence of arsenic in the sampled environment.
The stability of cadmium and arsenic concentrations across the sampled months suggests that these heavy metals may have a relatively consistent source or that the levels of contamination were relatively low during the study period (Qin et al., 2021). The consistent levels of both elements indicate that they might be influenced by similar pollution sources or processes operating throughout the study period (Achary et al., 2017). The lack of significant changes in cadmium concentrations, combined with the stable levels of arsenic, suggests that the overall contamination levels of these heavy metals were relatively low during the sampled months (Bosch et al., 2016). This implies that the studied environment may not have experienced substantial inputs of cadmium or arsenic during the study period.
Zinc concentrations exhibited variations, ranging from 0.59±0.0 mg/L in November to 0.93±0.0 mg/L in March. The highest value was observed in March, indicating a significant increase in zinc concentration during that month. However, zinc concentrations showed a significant increase in March, indicating a potential source of zinc pollution during that month. Bastakoti et al. (2019) reported that fluctuations in zinc and iron concentrations suggest temporal changes in their accumulation in the sediment. The higher levels of zinc and iron in March indicate potential sources or inputs during that period (Adeogun et al., 2012). The higher levels of zinc suggest an elevated input of zinc into the environment, potentially originating from anthropogenic activities or natural processes (Marrugo-Negrete et al., 2017; Wang et al., 2019).
The fluctuations in both zinc and iron concentrations indicate potential correlations between these two elements (Adeogun et al., 2012). The higher levels of zinc and iron in March suggest potential sources or inputs during that specific period. The findings are consistent with Gilbert (2015) who noted that a variety of elements, including seasonal changes, pollution sources, and sediment dynamics, might have an impact on swings in ambient concentrations of metals like zinc. This was consistent with Ali et al. (2019) who stated that it is crucial to investigate the potential sources of zinc contamination, evaluate the associated environmental risks, and determine the extent of the impact on the ecosystem. These findings highlight the need for further investigation to identify the specific sources, evaluate the environmental impact, and better understand the factors driving the observed variations in zinc concentrations.
Iron concentrations ranged from 0.31±0.0 mg/L in November to 1.17±0.0 mg/L in March and April. This indicates a significant increase in iron concentration during March and April compared to November. WHO has recommended a value of 0.3 mg/L as the permissible limit for drinking water, for freshwater aquatic life, the limit is 1 mg/L. The value in March was above the permissible value WHO has recommended (value of 0.3 mg/L) as the limit for drinking water, for freshwater aquatic life, the limit is 1 mg/L. Chronic excessive intake of iron may lead to hemochromatosis. Iron concentrations exhibited a significant increase in March and April compared to November. This could be attributed to seasonal factors or external influences (Ustaoğlu and Islam, 2020).
These variations may be attributed to factors such as seasonal influences, hydrological conditions, or anthropogenic activities that can affect the inputs and transport of heavy metals in the environment (Khatri and Tyagi, 2015; Pandey and Singh, 2017). On the other hand, cadmium and arsenic concentrations did not show significant changes across the months, suggesting relatively stable contamination levels (Marković et al., 2019; Tanvir et al., 2021). However, further assessment against relevant guidelines is necessary to evaluate the potential risks associated with these metals.
CONCLUSION
The study investigated the temporal variations in heavy metal concentrations in four fish species (Redbelly Tilapia, Periwinkle, Swimming Crab, and Flathead grey mullet), sediments, and surface water collected from Ibaka Creek in Okrika over a six-month period. The findings revealed significant temporal fluctuations in the concentrations of certain heavy metals, indicating potential contamination sources during specific periods. While Pb, Cd and As concentrations remained stable, Cu, Fe, and Zn concentrations exhibited temporal variations. Cd and Fe concentrations in the four fish species exceeded recommended threshold values, indicating potential health and environmental risks. In contrast, Pb, Zn, As, and Cu concentrations remained within acceptable limits, suggesting lower risks to human health and the environment. Pb concentrations in the sediment samples show variations across months, exceeding EPA thresholds but were within the WHO guidelines. Cu concentrations varied significantly in March, suggesting elevated contamination sources. Cd concentrations remained stable, while Zn and Fe showed temporal fluctuations. Pb concentration in surface water samples was low throughout the study, while the Cu concentrations increased significantly in March. Cd and As remained constant, while Zn and Fe concentrations showed variations. Efforts should be made to mitigate the potential health risks and environmental hazards associated with heavy metal contamination in Ibaka Creek, Okrika, and safeguard the well-being of the local population and the ecosystem.
REFERENCE
- Abdel-Shafy, H. I., & Mansour, M. S. (2016). A review on polycyclic aromatic hydrocarbons: source, environmental impact, effect on human health and remediation. Egyptian journal of petroleum, 25(1), 107-123.
- Achary, M. S., Satpathy, K. K., Panigrahi, S., Mohanty, A. K., Padhi, R. K., Biswas, S., … & Panigrahy, R. C. (2017). Concentration of heavy metals in the food chain components of the nearshore coastal waters of Kalpakkam, southeast coast of India. Food Control, 72, 232-243.
- Adeogun, A. O., Babatunde, T. A., & Chukwuka, A. V. (2012). Spatial and temporal variations in water and sediment quality of Ona river, Ibadan, Southwest Nigeria. European Journal of Scientific Research, 74(2), 186-204.
- Akpotor, E. (2019). Crude oil exploration and exploitation in Niger Delta: A Christian Concern. International Journal of Innovative Development and Policy Studies, 7(2), 38-49.
- Ali, H., & Khan, E. (2019). Trophic transfer, bioaccumulation, and biomagnification of non-essential hazardous heavy metals and metalloids in food chains/webs—Concepts and implications for wildlife and human health. Human and Ecological Risk Assessment: An International Journal, 25(6), 1353-1376.
- Bacosa, H. P., Ancla, S. M. B., Arcadio, C. G. L. A., Dalogdog, J. R. A., Ellos, D. M. C., Hayag, H. D. A., … & Adhikari, P. L. (2022). From Surface Water to the Deep Sea: A Review on Factors Affecting the Biodegradation of Spilled Oil in Marine Environment. Journal of Marine Science and Engineering, 10(3), 426.
- Bashir, I., Lone, F. A., Bhat, R. A., Mir, S. A., Dar, Z. A., & Dar, S. A. (2020). Concerns and threats of contamination on aquatic ecosystems. Bioremediation and biotechnology: sustainable approaches to pollution degradation, 1-26.
- Bastakoti, U., Robertson, J., Bourgeois, C., Marchand, C., & Alfaro, A. C. (2019). Temporal variations of trace metals and a metalloid in temperate estuarine mangrove sediments. Environmental monitoring and assessment, 191, 1-18.
- Bat, L., & Arici, E. (2018). Heavy metal levels in fish, molluscs, and crustacea from Turkish seas and potential risk of human health. In Food Quality: Balancing Health and Disease(pp. 159-196). Academic Press.
- Bosch, A. C., O’Neill, B., Sigge, G. O., Kerwath, S. E., & Hoffman, L. C. (2016). Heavy metals in marine fish meat and consumer health: a review. Journal of the Science of Food and Agriculture, 96(1), 32-48.
- Caballero-Gallardo, K., Alcala-Orozco, M., Barraza-Quiroz, D., De la Rosa, J., & Olivero-Verbel, J. (2020). Environmental risks associated with trace elements in sediments from Cartagena Bay, an industrialized site at the Caribbean. Chemosphere, 242, 125173.
- Chakraborty, S. K. (2017). Ecological services of intertidal benthic fauna and the sustenance of coastal wetlands along the Midnapore (East) Coast, West Bengal, India. Coastal wetlands: Alteration and remediation, 777-866.
- Chang, C. Y., Yu, H. Y., Chen, J. J., Li, F. B., Zhang, H. H., & Liu, C. P. (2014). Accumulation of heavy metals in leaf vegetables from agricultural soils and associated potential health risks in the Pearl River Delta, South China. Environmental monitoring and assessment, 186, 1547-1560.
- Chang, C. Y., Yu, H. Y., Chen, J. J., Li, F. B., Zhang, H. H., & Liu, C. P. (2014). Accumulation of heavy metals in leaf vegetables from agricultural soils and associated potential health risks in the Pearl River Delta, South China. Environmental monitoring and assessment, 186, 1547-1560.
- Chi, Y., Li, F., Tam, N. F. Y., Liu, C., Ouyang, Y., Qi, X., … & Ye, Z. (2018). Variations in grain cadmium and arsenic concentrations and screening for stable low-accumulating rice cultivars from multi-environment trials. Science of the Total Environment, 643, 1314-1324.
- Chitmanat, C., & Traichaiyaporn, S. (2010). Spatial and temporal variations of physical-chemical water quality and some heavy metals in water, sediments and fish of the Mae Kuang River, Northern Thailand. International Journal of Agriculture and Biology, 12(6), 816-820.
- Chris, D. I., Onyena, A. P., & Sam, K. (2023). Evaluation of human health and ecological risk of heavy metals in water, sediment and shellfishes in typical artisanal oil mining areas of Nigeria. Environmental Science and Pollution Research, 1-15.
- Davies I. C and Ekperusi A. O. (2021). Evaluation of Heavy Metal Concentrations in Water, Sediment and Fishes of New Calabar River in Southern Nigeria. Journal of Limnology and Freshwater Fisheries Research 7(3): 207-218. https://doi.org/10.17216/LimnoFish.816030
- Davies I. C, and Efekemo O. (2022). Physico-chemical Parameters and Heavy Metals Distribution in Selected Shell Fishes along the Opuro-Ama Creek in Rivers State of Nigeria. Asian Journal of Fisheries and Aquatic Research. 17(1): 15-26.
- EPA 2020. United States Environmental Protection Agency. Accessed https://gispub.epa. gov/air/trendsreport/2020/#toxics
- Fu, Z., & Xi, S. (2020). The effects of heavy metals on human metabolism. Toxicology mechanisms and methods, 30(3), 167-176.
- Ganugapenta, S., Nadimikeri, J., Chinnapolla, S. R. R. B., Ballari, L., Madiga, R., Nirmala, K., & Tella, L. P. (2018). Assessment of heavy metal pollution from the sediment of Tupilipalem Coast, southeast coast of India. International Journal of Sediment Research, 33(3), 294-302.
- Gilbert, L. J. (2015). Heavy metal contamination in the Black River, Cape Town(Master’s thesis, University of Cape Town).
- Giri, S. S., Yun, S., Jun, J. W., Kim, H. J., Kim, S. G., Kang, J. W., … & Park, S. C. (2018). Therapeutic effect of intestinal autochthonous Lactobacillus reuteri P16 against waterborne lead toxicity in Cyprinus carpio. Frontiers in immunology, 9, 1824.
- Islam, M. S., Idris, A. M., Islam, A. R. M. T., Ali, M. M., & Rakib, M. R. J. (2021). Hydrological distribution of physicochemical parameters and heavy metals in surface water and their ecotoxicological implications in the Bay of Bengal coast of Bangladesh. Environmental science and pollution research, 28, 68585-68599.
- Ite, A. E., & Ibok, U. J. (2013). Gas flaring and venting associated with petroleum exploration and production in the Nigeria’s Niger Delta. American Journal of Environmental Protection, 1(4), 70-77.
- Kalu, K. I. (2018). Environmental Ethics and Responsibilities for Multinational Corporations-The Nigeria Niger Delta Case(Doctoral dissertation, Christian-Albrechts Universität Kiel).
- Khan, S., Cao, Q., Zheng, Y. M., Huang, Y. Z., & Zhu, Y. G. (2015). Health risks of heavy metals in contaminated soils and food crops irrigated with wastewater in Beijing, China. Environmental pollution, 208, 896-902.
- Khatri, N., & Tyagi, S. (2015). Influences of natural and anthropogenic factors on surface and groundwater quality in rural and urban areas. Frontiers in life science, 8(1), 23-39.
- Liu, H., Zhang, K., Chai, L., Yang, Z., Yang, W., Liao, Q., … & Liu, Y. (2017). A comparative evaluation of different sediment quality guidelines for metal and metalloid pollution in the Xiangjiang River, Hunan, China. Archives of environmental contamination and toxicology, 73, 593-606.
- Marković, J., Jović, M., Smičiklas, I., Šljivić-Ivanović, M., Onjia, A., Trivunac, K., & Popović, A. (2019). Cadmium retention and distribution in contaminated soil: effects and interactions of soil properties, contamination level, aging time and in situ immobilization agents. Ecotoxicology and environmental safety, 174, 305-314.
- Ndimele, P. E., & Kumolu-Johnson, C. A. (2012). Some aspects of the physicochemistry and heavy metal content of water, sediment and Cynothrissa mento (Regan, 1917) from Badagry Creek, Lagos, Nigeria. Trends in Applied Sciences Research, 7(9), 724.
- NNPC Oil Production (2019) http:// nnpcgroup.com/ nnpcbusiness/ upstreamventures, Accessed 10th March 2023.
- Obida, C. B., Blackburn, G. A., Whyatt, J. D., & Semple, K. T. (2021). Counting the cost of the Niger Delta’s largest oil spills: Satellite remote sensing reveals extensive environmental damage with> 1million people in the impact zone. Science of the Total Environment, 775, 145854.
- Odekina, M. U., Davies, I. C., Akoko, S., & Vincent-Akpu, I. F. (2021). Bioaccumulation of Heavy Metals in Periophthalmus papillio, Sediment and Interstitial Water from Isaka-Bundu Water Front in Rivers State. Academic Journal of Current Research, 8(11), 19-38.
- Okoyen, E., Raimi, M. O., Oluwatoyin, O. A., & Williams, E. A. (2020). Governing the environmental impact of dredging: Consequences for marine biodiversity in the niger delta region of Nigeria. Okoyen E, Raimi MO, Omidiji AO, Ebuete A W. Governing the Environmental Impact of Dredging: Consequences for Marine Biodiversity in the Niger Delta Region of Nigeria. Insights Mining Science and Technology, 2(3), 555586.
- Oluniyi, A. E. (2017). Nigeria’s oil and gas production and Niger Delta militant: The need of oil resource to stop oil reliance for sustainable development. Global Journal of Human Social Science, 17(5), 22-34.
- Omoregie, U. (2019). Nigeria’s petroleum sector and GDP: The missing oil refining link. Journal of Advances in Economics and Finance, 4(1), 1-8.
- Onyena, A. P., & Sam, K. (2020). A review of the threat of oil exploitation to mangrove ecosystem: Insights from Niger Delta, Nigeria. Global ecology and conservation, 22, e00961.
- Opete, O. S. E., Osuji, L. C. & Hart, A. I. (2019). Bioaccumulation of Heavy Metals and Hydrocarbon by Clibanarius africanus (Hermit Crab) Exposed to Produced Water. Annals of Ecology and Environmental Science 3 (3) : 25 – 32.
- Osman, A. G. M., & Kloas, W. (2010). Water Quality and Heavy Metal Monitoring in Water, Sediments and Tissues of the African Catfish Clarias gariepinus (Burchell, 1822) from the River Nile, Egypt. Journal of Environmental Protection, 1, 389-400.
- Padoan, E., Couto, A. H., & Ajmone Marsan, F. (2019). Potential release of zinc and cadmium in soils contaminated by heavy metals under flooding. In Natural and Human-induced Impacts on the Critical Zone and Food Production(pp. 50-50).
- Pandey, J., & Singh, R. (2017). Heavy metals in sediments of Ganga River: up-and downstream urban influences. Applied Water Science, 7, 1669-1678.
- Qin, G., Niu, Z., Yu, J., Li, Z., Ma, J., & Xiang, P. (2021). Soil heavy metal pollution and food safety in China: Effects, sources and removing technology. Chemosphere, 267, 129205.
- Raju, K. V., Somashekar, R. K., & Prakash, K. L. (2013). Spatio-temporal variation of heavy metals in Cauvery River basin. Proceedings of the International Academy of Ecology and Environmental Sciences, 3(1), 59.
- Sakib, S. M. (2021). The impact of Oil and Gas Development on the landscape and surface in Nigeria. Asian Pacific Journal of Environment and Cancer.
- Sall, M. L., Diaw, A. K. D., Gningue-Sall, D., Efremova Aaron, S., & Aaron, J. J. (2020). Toxic heavy metals: impact on the environment and human health, and treatment with conducting organic polymers, a review. Environmental Science and Pollution Research, 27, 29927-29942.
- Sam, K., and Zabbey, N., 2018. Contaminated Land and Wetland Remediation in Nigeria: Opportunities for Sustainable Livelihood Creation, Science of the Total Environment. Elsevier B.V. https://doi.org/10.1016/j.scitotenv.2018.05.266.
- Sayed, E. T., Wilberforce, T., Elsaid, K., Rabaia, M. K. H., Abdelkareem, M. A., Chae, K. J., & Olabi, A. G. (2021). A critical review on environmental impacts of renewable energy systems and mitigation strategies: Wind, hydro, biomass and geothermal. Science of the total environment, 766, 144505.
- Sonone, S. S., Jadhav, S., Sankhla, M. S., & Kumar, R. (2020). Water contamination by heavy metals and their toxic effect on aquaculture and human health through food Chain. Appl. NanoBioScience, 10(2), 2148-2166.
- Tanvir, E. M., Komarova, T., Comino, E., Sumner, R., Whitfield, K. M., & Shaw, P. N. (2021). Effects of storage conditions on the stability and distribution of clinical trace elements in whole blood and plasma: Application of ICP-MS. Journal of Trace Elements in Medicine and Biology, 68, 126804.
- US Fish and Wildlife Services, 2013. Mangroves. Retrieved 11 November, 2022 from. http://www.fws.gov/verobeach/msrppdfs/mangroves.pdf.
- Ustaoğlu, F., & Islam, M. S. (2020). Potential toxic elements in the sediment of some rivers at Giresun, Northeast Turkey: A preliminary assessment for ecotoxicological status and health risk. Ecological indicators, 113, 106237.
- Wang, S., Cai, L. M., Wen, H. H., Luo, J., Wang, Q. S., & Liu, X. (2019). Spatial distribution and source apportionment of heavy metals in soil from a typical county-level city of Guangdong Province, China. Science of the Total Environment, 655, 92-101.
- WHO, Guidelines for Drinking Water Quality, World Health Organization, Geneva, 2011.
- Xiao, R., Bai, J., Huang, L., Zhang, H., Cui, B., & Liu, X. (2013). Distribution and pollution, toxicity and risk assessment of heavy metals in sediments from urban and rural rivers of the Pearl River delta in southern China. Ecotoxicology, 22, 1564-1575.
- Yang, Y., He, Z., Wang, Y., Fan, J., Liang, Z., & Stoffella, P. J. (2013). Dissolved organic matter in relation to nutrients (N and P) and heavy metals in surface runoff water as affected by temporal variation and land uses–A case study from Indian River Area, south Florida, USA. Agricultural Water Management, 118, 38-49.
- Yin, D., Peng, F., He, T., Xu, Y., & Wang, Y. (2020). Ecological risks of heavy metals as influenced by water-level fluctuations in a polluted plateau wetland, southwest China. Science of The Total Environment, 742, 140319.
- Yu, B., Wang, X., Dong, K. F., Xiao, G., & Ma, D. (2020). Heavy metal concentrations in aquatic organisms (fishes, shrimp and crabs) and health risk assessment in China. Marine Pollution Bulletin, 159, 111505.
- Zhang, H., Zhang, F., Song, J., Tan, M. L., & Johnson, V. C. (2021). Pollutant source, ecological and human health risks assessment of heavy metals in soils from coal mining areas in Xinjiang, China. Environmental research, 202, 111702.
- Zhang, Y., Hu, X., & Yu, T. (2012). Distribution and risk assessment of metals in sediments from Taihu Lake, China using multivariate statistics and multiple tools. Bulletin of environmental contamination and toxicology, 89, 1009-1015.
- Zhang, Z., Zhang, N., Li, H., Lu, Y., Wang, Q., & Yang, Z. (2019). Risk assessment, spatial distribution, and source identification of heavy metal (loid) s in paddy soils along the Zijiang River basin, in Hunan Province, China. Journal of Soils and Sediments, 19, 4042-4051.
- Zhou, H., Yang, W. T., Zhou, X., Liu, L., Gu, J. F., Wang, W. L., … & Liao, B. H. (2016). Accumulation of heavy metals in vegetable species planted in contaminated soils and the health risk assessment. International journal of environmental research and public health, 13(3), 289.
- Zhou, W., Yan, F., Fan, Y., Zhang, C., Yang, F., Liu, Q., … & Ren, W. (2023). Accumulated temperature and allocation of photo-thermal resources are key meteorological factors affecting rice ca