
Petroleum Revenue and Gross Domestic Product in Nigeria
- Joseph Ojo EKIRAN (PhD)
- 141-153
- Jan 30, 2024
- Management
Petroleum Revenue and Gross Domestic Product in Nigeria
Joseph Ojo EKIRAN (PhD)
Department of Economics, Bamidele Olumilua University of Education, Science and Technology, Ikere-Ekiti
DOI: https://doi.org/10.51244/IJRSI.2024.1101012
Received: 19 December 2023; Revised: 30 December 2023; Accepted: 03 January 2024; Published: 29 January 2024
ABSTRACT
Nigeria is the most populous country in Africa, it maintains the second largest oil reserve in the continent. The question on whether the oil natural resource endowment is a blessing or a curse is still not adequately answered in the literature. This study therefore examines the interrelationships between petroleum revenue and gross domestic product in Nigeria from 1985-2020. The data used for the analysis of the study was obtained from World Bank and Central Bank of Nigeria data base. Augmented Dickey Fuller (ADF) unit root test was used to test for the presence of stationarity in the variables, autoregressive distributed Lag (ARDL) co-integration test was employed to test for long run relationship and error correction model (ECM) was employed to test the short-run relationship among variables. The variables used for the research work are Gross Domestic Product (GDP), Oil Revenue (OIR), Inflation (INF), Effective Exchange Rate (EEXR), Labour (LAB) and Gross Capital Formation (GCFC). The study showed that oil revenue and labour force exhibit significant positive impacts on gross domestic product (economic growth). This study recommends that government should establish annual spending limits in order to reduce inflation, the government should engage in the rehabilitation of the old refineries and construction of new ones in order to stop the age long practice of exporting crude oil at a low price and purchasing the refined oil at a high price. Measures to reduce the high exchange rate of naira with other countries’ currencies should be put in place. Various government policies should be put in place and diligently enforced to ensure that the diversion of revenue gotten from the oil sector are duly handled to further meet the economic growth objective in the country.
Keywords: Petroleum Revenue, Gross Domestic Product, ARDL co-integration, Unit Root Test, Error Correction Model
INTRODUCTION
Oil is a fundamental energy source and has become vital to the world economy since its discovery in 1859, it has overtaken coal as the prominent source of energy. The discovery of petroleum led to the oil rush which made oil one of the most valuable commodities in the world.
In Nigeria, oil was reportedly first discovered in Bayelsa State, in Niger Delta, in 1956. Currently according to the Organisation of the Petroleum Export Countries (OPEC), Nigeria has the tenth largest crude oil reserves and is the the thirteenth largest producer of crude oil the world. Nigeria’s economy did not rely on oil as its primary source of revenue prior to the discovery of oil; agriculture was the backbone of the Nigerian economy. Agriculture was, in fact, the largest source of revenue between 1960 and 1966, and it employed more than 90% of the country’s labor force. However, following the discovery of oil and the subsequent oil boom in the 1970s, agribusiness lost its prominent place to mining, notably oil. In 1970, oil export profits accounted for nearly 59 percent of Nigeria’s GDP (Nuhu, 2018). Volatility in oil prices has played a crucial role in leading undeveloped countries into recession and has led to the downfall of governments and countries. An irregular rise and fall in the price of crude oil is always strongly affected by trembles in oil demand and supply arising from political instability, economic and non-economic crisis or progress.
One of the macroeconomic objectives of a country is to reduce the rate of inflation in a country. Inflation is the persistent rise in the general price level. It shows the continuous increasing levels of the prices of goods and services in a nation’s economy (Jhingan, 2009). This depicts that as the inflation rate rises the value of money drops, reducing the amount of goods and services that can be purchased.
Inflation rate can play a great role in reducing the GDP rate. If the inflation rate is high, government may take action by implementing stabilization policies to reduce the money in circulation, fiscal policy which involves contractionary methods like increasing tax and reducing government expenditure, this reduces the citizen’s disposable income, which may reduce demand and ultimately lead to reduction of productive activities, and this leads to a fall in the GDP. According to Ogiri et al (2013), the likelihood of oil prices to rise or fall sharply over a short period of time, is measured by volatility.
There have been significant price increases and declines, representing a significant increase in the volatility of the real oil price, which has created market uncertainty, causing corporations to postpone their investment (Sauter and Awerbush, 2006). According to Englama, et al (2010), the Nigerian economy’s full reliance on oil export revenue has rendered it more vulnerable to unexpected oil price fluctuations. That is, when oil prices fall, there will be a reduction in spending as the government tries to keep spending under control so that it does not exceed revenue, and there will be upward resistance to wage reductions at such times, primarily because the population believes it has a right to the oil revenue.
External shocks can be seen as an unexpected event that has a massive impact on the direction of the whole economy, it could be upward or downward and may include job creation, growth or massive unemployment and recession. An unexpected rise in the inflation rate or oil price can lead to an external shock, which may lead to an economic boom or failure. The impact of oil fluctuation on Nigeria’s economy is difficult to assess because oil has long been the lifeblood of the country’s economy. Nigeria’s total reliance on oil production for income has obvious negative consequences for the economy. Oil became Nigeria’s main source of revenue once agriculture was abandoned for oil, and it was expected to bring significant economic growth and progress.
When the oil price rises, leading to an increase in liquidity, this increases the money in circulation and an increase in inflation (Lim and Sek, 2016). Oil price and inflation are often seen as being related due to oils vital role in the Nigerian economy, it is used for transportation, manufacturing and so much more. With an increase in oil price, the cost of production and transportation will rise and this leads to a drop in the value of money, this can be referred to as a cost push inflation which is different from inflation which is caused by an increase in aggregate demand.
Adenuga et al (2012) are of the opinion that inflation has both internal and foreign causes, however given the extent of government spending in Nigeria, the causes of inflation may be primarily external. Internal causes of inflation include increases in wages, prices of raw materials and taxes. External causes include increased prices of imported goods that lead to higher prices in domestic market and when the country’s currency falls relative to other currencies, imported goods become more expensive and thereby contribute to inflation in the host countries. This can be seen in Nigeria during the first oil boom, when high government spending on projects, inability to meet the growing demand for goods due to the extraordinary renaissance that was taking place in Nigeria, and a high rate of money supply were all factors contributing to high inflation rates.
As a consequence, we may say that inflation will affect the revenue gotten from oil and, as a result, economic growth, either positively or negatively.
Many studies have reported on the impact of petroleum revenue on economic growth in Nigeria. The question whether the oil revenue motivates economic progress positively or negatively in the country is inconclusive in the literature. While Dauda et al (2023), Farzanegan et al (2021), Manasseh et al (2022), and Muhammed et al (2021) reported positive and long run relationships between oil revenue and growth in the Nigeria economy, other studies such as Ebimobowei (2022), and Akinleye et al (2021) reported contrary associations between the research variables in the country. These studies confirmed the existence of mixed results in literature.
1.1 Objective of the Study
The main objective of this study is to examine the interrelationship between petroleum revenue and gross domestic product in Nigeria.
LITERATURE REVIEW
2.1 Theoretical Framework
There are many theories concerning the growth of an economy. This study uses the neoclassical growth model generally called Solow-Swan model. This theory was propounded in 1956 by Robert Solow and Trevor Swan. The neoclassical growth theory is an economic growth model that describes how the three major economic factors which are labour, capital and technology determine growth. It argues that an economy’s total production is determined by the relationship between capital and labor, given the level of technology.
The production function can be represented as:
Y= Af(K,L ) ————————————————————————– (1)
Where;
Y = Income or Gross Domestic Product
K= Capital
L= Amount of unskilled labor in the economy
A = Determinant level of technology
2.2 Conceptual Literature
(a) Petroleum/ Crude oil
Petroleum, commonly known as crude oil, is a naturally occurring fossil fuel derived from ancient martine organisms. It consists of hydrocarbons, which are organic compounds made up of hydrogen and carbon atoms. Petroleum is a crucial energy source and is refined to produce various products such as gasoline, diesel, jet fuel, and various petrochemicals used in the manufacturing of plastics, lubricants, and other materials.
Crude oil is typically obtained through drilling, where it is usually found alongside other resources, such as natural gas (which is lighter and therefore sits above the crude oil) and saline water (which is denser, and sinks below). It is then refined and processed into a variety of forms, such as gasoline, kerosene and asphalt, and sold to consumers.
(b) Oil Revenue
Oil revenue refers to the income generated by a country through the extraction, production, and sale of crude oil and related products. Nations rich in oil reserves often rely heavily on oil revenue as a significant source of income and foreign exchange.
The Nigerian National Petroleum Corporation (NNPC) sells about 445, 000 barrels per day on an intercompany basis to the Pipeline Product Marketing Company (PPMC), its main downstream subsidiary. The nation’s NNPC-owned refineries are expected to process 445, 000 barrels per day if they run at full capacity. PPMC is meant to pay NNPC for the crude, and then NNPC is supposed to send the funds to the Federation Account for appropriation.
(c) Economic Growth
Economic growth means an increase in the value of goods and services produced in a country over a given period of time usually a year. It is the sustained increase in per capita national output. The rate of increase in the total output of the nation is expected to be higher than the rate of growth of the population to attain higher standard of living of the citizen. There are different proxies used for measuring economic growth but the most acceptable is gross domestic product (GDP).
Several factors that contribute to economic growth include technological advancements, increased productivity, population growth, and investments in infrastructure. A growing economy generally leads to higher employment rates, improved living standards, and increased opportunities for businesses.
(d) Gross Domestic Product (GDP)
Gross Domestic Product (GDP) is a key indicator used to measure the economic performance of a country. It represents the total value of all goods and services produced within a country’s borders over a specific period, usually a year.
GDP can be calculated using three approaches:
- Production Approach (GDP by Industry): Measures the value of goods and services produced in different industries.
- Expenditure Approach (GDP by Spending): Calculates GDP by summing up consumption, investment, government spending, and net exports (exports minus imports).
- Income Approach (GDP by Income): Calculate GDP by summing up the incomes earned by individuals and businesses, including wages, profits, and taxes
(e) Inflation
Inflation is the rate at which the general level of prices for goods and services rises, resulting in a decrease in the purchasing power of a currency. It is commonly expressed as an annual percentage, indicating the average price increase over time.
Inflation can be caused by various factors, including increased demand for goods and services, supply chain disruptions, changes in production costs, or monetary factors such as excessive money supply.
Two common measures of inflation are the Consumer Price Index (CPI) and the Producer Price Index (PPI), which track changes in the prices of a basket of goods and services consumed by households or used in production, respectively.
(f) Gross Capital Formation (GCF)
Gross Capital Formation (GCF), also known as Gross Fixed Capital Formation (GFCF), represents the total value of new physical assets (such as buildings, machinery, and infrastructure) produced within a country over a specific period. It is a key economic indicator used to assess the level of investment in a nation’s economy.
GCF includes both private and public sector investments in fixed assets and is expressed as a percentage of Gross Domestic Product (GDP). It indicates the amount of resources dedicated to expanding and maintaining a country’s capital stock, which contributes to future economic productivity.
(g) Exchange Rate
An exchange rate is the value of one currency in terms of another currency. It represents the rate at which one currency can be exchanged for another. Exchange rates are influenced by various factors, including economic indicators, interest rates, inflation, and geopolitical events.
Exchange rates can be quoted in different ways, such as direct or indirect, and they can be either fixed or floating. In a fixed exchange rate system, a country’s currency value is tied to another major currency or a basket of currencies, while in a floating exchange rate system, the currency value is determined by market forces.
Exchange rates play a crucial role in international trade and finance, affecting the cost of imports and exports, influencing tourism, and impacting foreign investment. Governments and central banks may intervene in the foreign exchange market to stabilize or adjust their currency’s value.
(h) Labour Force
In macroeconomics, the Labour force is the sum of those either working (that is, the employed) or looking for work (that is, the unemployed). Specifically in economic terms, labour is the efforts exerted to produce any goods or services. It includes all types of human efforts like physical exertion, mental exercise and use of intellect, done in exchange for an economic reward. It is one of the factors of production. In Nigeria, people within ages 15-64, who are able and willing to work constitutes the labour force.
2.3 Empirical Litature
Dauda et al (2023) investigated oil revenue effects on the Nigeria economy for the period between 1981 and 2021. The study made use of real gross domestic product (RGDP), petroleum profit tax (PPT), manufacturing output (MANU), exchange rate (EXR), interest rate (INTR) and government expenditure (GOVEX). The study employed Johansen co-integration test, granger causality technique and error correction mechanism to analyse the research data. The autors found out that the generated oil revenue had long run and short run positive impacts on growth in Nigeria. The study recommended efficient utilization of generated oil revenue in the country.
Farzanegan et al (2021) investigates the effect of oil revenue on the middle-class size and income in Iran. The study employs oil income, international non-oil ttrade, service sector and economic development. It uses annual time series data for 1965-2017 and a Vector Autoregressive (VAR) model. The study confirmed that the response of the middle class to oil-income shocks in Iran was positive and significant.
Akinleye, et al (2021) used autoregressive distributed lag (ARDL) model to examine the impact of oil revenue on economic growth in Nigeria between 1981 and 1918. The study made use of the following variables: economic growth (RGDP), oil revenue (OREV), inflation rate (INF) and exchange rate (EXCR). The result revealed that petroleum profit tax has inverse effect on economic growth in both the short and long run periods.
Ebimobowei (2022) analyses the connection between oil revenue and economic expansion in Nigeria for the period between 1990 and 2019. The study specified real gross national product (RGDP), crude oil/gas export (COES), petroleum profit tax/royalty (PPTR), domestic crude oil sales (DMOS) and oil licensing fees (LICF) variables. The study used multiple regression technique and Pearson moment correlation method and established significant negative nexus between oil revenue and GDP growth in Nigeria.
Muhammed et al (2021) studied the impact of the revenue generated from oil on economic growth in Nigeria between 1981 and 2019. The variables used in the study are: gross domestic product (GDP), oil revenue (OILR), foreign direct investment (FDI) and exchange rate (EXR). The study used autoregressive distributed Lag (ARDL) model. The outcome of the study showed that oil revenue impacted positively well on the economic progress of the country within the period under review.
Using the Auto Regressive Distributive Lag (ARDL), Motunrayo and Nicholas (2020) investigated the impact of oil prices on economic growth in seven low-income Sub-Saharan African (SSA) oil-importing nations, namely Ethiopia, Gambia, Mali, Mozambique, Senegal, Tanzania, and Uganda. The variables employed are real gross domestic product (RGDPC), real oil price (ROP), oil consumption (OC), gross fixed capital formation (GFC), labour force (NLF), real exchange rate (REER), inflation (INF) and trade openness (TOP). In the short run, the oil price has little impact on the Group’s economic growth, but it has a considerable negative impact in the long run. Short-run country coefficients, on the other hand, show that oil prices have a significant but uneven impact on economic development in all seven nations. The study presents an insignificant positive relationship between the GFC and RGDPC. It further confirmed a positive significant nexus between NLF and economic growth in low income countries.
Sunday (2019) used a co-integration and error correction modeling strategy to study the relationship between oil price volatility and infrastructural growth in Nigeria from 1981 to 2015. During the period, the study specified oil price (OP), infrastructure investment (INV), real exchange rate (RER), interest rate (INR) and inflation rate (INFR). His findings revealed that both oil price volatility and inflation rate have a negative influence on infrastructure growth, whereas real exchange rate appreciation had a positive impact on infrastructure investment. The study’s findings revealed that oil price volatility is negative and statistically significant, whereas interest rate volatility is likewise negative but statistically insignificant. Inflation also has a significant negative impact on infrastructure growth.
Nuhu (2018) using a Vector error Correction model considered the impact of oil price instability on Economic growth in Nigeria, using the time span of 1981-2015. The study variables are oil price, economic growth, real effective exchange rate, inflation and government expenditure. Oil price and real effective exchange rate were positively related to economic growth, whereas government expenditure and inflation showed a negative relationship. It was also seen that oil price Granger caused economic growth and exchange rate, while exchange rate Granger caused inflation. The variance decomposition result indicates that oil price instability is the largest source of variation in economic growth and exchange rates, while the largest source of variation in the inflation rate is exchange rate followed by oil price.
Ogege and Boloupremo (2020) examines the uncertainty of oil price and its influence on the economic and non-economic activities of Nigerian economy. The research made use of the annual time series data spanning between the year 1981 and 2018. The study employed the following variables: crude oil price, life expectancy, consumption per capita, education expenditure and economic development. A unit root test was carried out to test for the level of stationarity of the observed variables, most of the variables were identified as stationary at first difference. The data employed were analyzed with the aid of least square technique of data analysis to adequately examine the link between the observed variables. It was discovered that crude oil price positively and insignificantly influences life expectancy, but significantly influences consumption per capita and contrarily, it revealed negative and insignificant influence on physical quality of life and education index. It was deduced by the study that, there is existence of a comparative association of oil price with the indicators of Nigerian economic development.
Using Generalized Auto-Regressive Conditional Heteroskedasticity GARCH model to estimate effect of oil price fluctuation on economic growth in Nigeria, Ogu and Ojimadu (2020) examined the impact of oil price fluctuations on the economic growth in Nigeria. The data used was Quarterly data and had coverage from the period 1984 – 2017. The variables used in the analysis are gross domestic product (GDP), exchange rate, oil price and interest rate. The results show that Oil price has positive and significant effect on the economic growth in Nigeria.
Chen (2021) carried out a study to explain the correlation between the dwindling oil price and the Taiwan economy. He carried out the study using a 35year time span (1984-2018). The study made use of oil price, real gross domestic product (GDP) growth rate, consumer price index (CPI), exchange rate and wages variables for research analysis. He used Augmented Dickey Fuller and co-integration and impulse response techniques and confirmed that an increase in oil price leads to an increase in the consumer price index (CPI) in Taiwan economy during the study period.
METHODOLOGY
This study uses Augmented Dickey-Fuller (ADF) technique to test the stationarity of the data employed. Autoregressive Distributed Lag (ARDL) method was used to estimate the research model. For the model specification, gross domestic product (GDP) is expressed as a function of oil revenue (OIR), inflation rate (INF), effective exchange rate (EEXR), gross capital formation (GCFC) and Labour (LAB). Data for the study were sourced from Central Bank of Nigeria (CBN) statistical bulletin (various issues) and World Bank data base.
The model is specified as:
GDPt=, f(OIRt, INFt, EEXRt, GCFCt, LABt) ——————————————- (2)
Explicitly,
GDPt= β0 + β1OIRt + β2INFt + β3EEXRt + β4GCFCt + β5LABt+ µt —————- (3)
In a standard format, the ARDL estimation is shown thus;
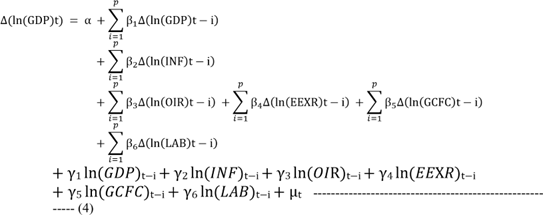
Where;
GDPt = growth in gross domestic product at time t
OIRt = oil revenue at time t
INFt =inflation rate at time t
EEXRt = effective exchange rate at time t
GCFCt= gross capital formation at time t.
LABt= labor force at time t, µt= the error term at time t, β0= the intercept and β1, β2, β3, β4, β5, β6 = estimated coefficients of variables.
RESULTS AND INTERPRETATION
Descriptive Statistics
Table 1: Descriptive Statistics, using the observations for Nigeria
| GDP | GCFC | OIR | LAB | INF | EEXR | |
| Mean | 11.10390 | 32.07768 | 12.67921 | 17.61580 | 19.34767 | 104.8232 |
| Median | 10.97948 | 29.39886 | 12.93036 | 17.59203 | 12.21778 | 118.5667 |
| Maximum | 11.73773 | 54.95059 | 26.42849 | 17.94509 | 72.83550 | 306.9210 |
| Minimum | 10.44330 | 14.95883 | 2.800011 | 17.27459 | 5.388008 | 0.893774 |
| Std. Dev. | 0.429668 | 12.63374 | 5.574634 | 0.190652 | 17.91300 | 92.11279 |
| Skewness | 0.181217 | 0.199844 | 0.219246 | -0.017131 | 1.698687 | 0.698063 |
| Kurtosis | 1.389102 | 1.789948 | 2.620022 | 1.880516 | 4.528878 | 2.759744 |
| Jarque-Bera | 3.975925 | 2.368297 | 0.490959 | 1.829361 | 20.24111 | 2.926717 |
| Probability | 0.136974 | 0.306007 | 0.782329 | 0.400645 | 0.000040 | 0.231458 |
| Sum | 388.6366 | 1122.719 | 443.7725 | 616.5531 | 677.1685 | 3668.813 |
| Sum Sq. Dev. | 6.276893 | 5426.787 | 1056.603 | 1.235836 | 10909.77 | 288482.0 |
| Observations | 35 | 35 | 35 | 35 | 35 | 35 |
Source: Author’s computation using E-Views 9.
The descriptive statistics of the research work were carried out and the outcomes are as shown in Table 1. From the table, the mean values ranged from 11.10390 (GDP) to 104.8232 (EEXR), Standard deviation has positive values for all research variables and based on the Jarque-Bera probability, all the variables (GDP, GCFC, OIR, LAB and EEXR) are normally distributed except INF (0.000040) as they have p-values greater than 5% level of significance. Jarque-Bera (J-B) is an error test normality of the residuals. If the J-B test statistic is large and the P-value is less than 0.05, the data does not follow a normal distribution. From Table 1, INF does not follow normal distribution since the J-B statistic value of 20.24111 is very large, with P-value of 0.000040 < 0.05. The J-B test statistic for GDP, GCFC, OIR, LAB and EEXR are 3.975925, 2.368297, 0.490959, 1.829361 and 2.926717 with P-values 0.136974, 0.306007, 0.782329, 0.400645 and 0.231458 respectively greater than 0.05 critical value. Based on the results, the study relied of the research variables for further analysis.
Stationarity Test
Table 2: Augmented Dickey Fuller (ADF) Unit root Test Results
| Variable | ADF Test | Critical Value | Integration level | Remark | |
| Level | 1st Diff | 5% | |||
| GDP | 0.019353 | -4.917439 | -2.951125 | I (1) | Stationary |
| OIR | -3.083303 | -5.321916 | -2.951125 | I (0) | Stationary |
| INF | -3.423989 | -4.724821 | -2.951125 | I (0) | Stationary |
| EEXR | 1.813206 | -3.988345 | -2.951125 | I (1) | Stationary |
| GCFC | -2.363407 | -4.896831 | -2.951125 | I (1) | Stationary |
| LAB | -2.896831 | -5.806736 | -2.951125 | I (1) | Stationary |
Source: Author’s Computation using E-views 9.
Table 2 above represents a summary of the Unit Root Test results for the series in both at a level and at first difference. Variables at I(0) are stationary at a level while variables that are non-stationary at a level are stationary after the first difference and are represented by I(1). From the table it is shown that the variables OIR and INF are stationary at a level I(0), while all remaining variables GDP, EEXR,LAB, GCFC are stationary after the first difference I(1). This indicates the need to make use of Auto-Regressive Distributed Lags (ARDL) test, a model that is very efficient in analyzing mixed levels of integration of research properties.
ARDL Bounds Test for Co-integration
Table 3: ARDL Bounds Test Results
| Significance Level | Critical Bounds | F-Stat Value | Kmax | Hypothesis Testing | |
| I (0) | I (1) | ||||
| At 10 Percent | 2.26 | 3.35 | 14.77381 | 5 | Co-integration exists |
| At 5 Percent | 2.62 | 3.79 | 14.77381 | 5 | Co-integration exists |
| At 2.5 Percent | 2.96 | 4.18 | 14.77381 | 5 | Co-integration exists |
| At 1 Percent | 3.41 | 4.68 | 14.77381 | 5 | Co-integration exists |
Source: Author’s Computation using E-views 9.
Table 3 shows the ARDL bounds test result using GDP as the dependent variable. From the table, the F-statistic value is 14.77381, this is greater than the upper bound values of 3.35, 3.79, 4.18, 4.68 at 10%, 5%, 2.5% and 1% respectively. This means that there is a long run relationship between the variables and co-integration exists at all levels of existence.
Co-integrating ARDL Model Estimates
After existence of stationarity and co-integration have been established, Auto-Regressive Distributed Lag (ARDL) was used to show the long run relationship between the dependent and independent variables. The result below:
Table 4: Long-Run ARDL regression Result
| Variables | Coefficient | Standard Error | T stat | Probability |
| OIR | 0.029571 | 0.010170 | 2.907528 | 0.0084** |
| INF | -0.001992 | 0.002062 | -0.965978 | 0.0350** |
| GCFC | -0.009965 | 0.007915 | -1.259024 | 0.2218 |
| EEXR | -0.000579 | 0.000826 | -0.690044 | 0.4977 |
| LAB | 2.326692 | 0.378936 | 6.140064 | 0.0000** |
Source: Author’s Computation using E-views 9.
Note: ** indicate significance at the level of 1%.
The long-run form of the ARDL result are presented in Table 4. It is found that in the long-run, oil revenue and labour force exhibit significant positive effects on economic growth in Nigeria respectively.
The result confirmed that a unit change in oil revenue will lead to about 0.0296 unit growth rate in the gross domestic product (economic growth) in Nigeria during the period under review. The result complied with the a priori expectation of positive correlation between the research variables. The result is in agreement with the report of Dauda et al (2023) and Muhammed et al (2021), but contrary to the negative impact relationship report of Ebimobowei (2022).
Table 5: Short Run Coefficients using ECM Approach
| Co-integrating Form | ||||
| Variable | Coefficient | Std. Error | t-Statistic | Prob. |
| D(OIR) | 0.004985 | 0.002572 | 1.938439 | 0.0661 |
| D (OIR (-1)) | -0.008170 | 0.002792 | -2.925901 | 0.0081 |
| D(INF) | -0.000180 | 0.000941 | -0.191492 | 0.8500 |
| D(INF) | -0.001504 | 0.000911 | -1.651393 | 0.1135 |
| D(EEXR) | -0.000262 | 0.000389 | -0.671788 | 0.5090 |
| D(GCFC) | -0.004573 | 0.003922 | -1.165896 | 0.2567 |
| D(LAB) | 0.161949 | 0.236699 | 0.684200 | 0.5013 |
| ECM (-1) | -0.458918 | 0.089082 | -5.151613 | 0.0000 |
Source: Author’s Computation using E-views 9.
Table 5 displays the short-run co-integrating estimates. From the table, the negative coefficient value of the error correction model (ECM) of -0.458918 with the probability value of 0.0000 meets the required condition for long-run convergence of the research model.
The result implies that about 45.9% of any disequilibrium in the gross domestic product (GDP) in Nigeria during the investigating period is corrected by oil revenue and other control variables of the research model within one period. That is, about 45.9% of disequilibria from the previous year’s shock converge back to the long-run equilibrium in the current year. The report verifies the existence of a long-run equilibrium relationship among the research variables as predicted in the co-integrating bound test as shown in Table 3. The ECM linked the co-integrating equations’ short-run dynamics to their long-run stationary dispositions. ECM (-1) is the speed of adjustment, it must be negative and significant. The coefficient of -0.458919 means any disequilibrium in the system adjust to long-run equilibrium at a speed of 45%.
Diagnostic Tests
Table 6: Diagnostic Test Results
| Variables | Coefficient | Standard Error | T-Statistic | Prob. | |
| GDP (-1) | 0.692060 | 0.086719 | 7.980463 | 0.0000 | |
| OIR | 0.003263 | 0.002423 | 1.346409 | 0.0094 | |
| INF | -0.001428 | 0.000745 | -1.916820 | 0.0459 | |
| LAB | 0.419388 | 0.202218 | 2.073943 | 0.0477 | |
| GCFC | -0.009474 | 0.002921 | -3.243177 | 0.0031 | |
| EEXR | -0.000656 | 0.000360 | -1.822308 | 0.0795 | |
| Diagnostics Check | Probability | Hypothesis Testing | |||
| Serial Correlation | 0.5045 | Cannot reject | |||
| Heteroskedasticity Test | 0.3315 | Cannot reject | |||
| Histogram Normality Test | 0.7365 | Rejectable | |||
Source: Author’s computation using E-Views 9.
The diagnostic tests performed include; the Breusch-Godfrey serial correlation between the correlation LM with a probability value of 0.5045 shows there is no serial correlation between the variables. Also, the null hypothesis of no heteroskedasticity is accepted since the probability level of 0.3315 is greater than the critical 0.05 p-value. This implies that there is no existence of heteroskedasticity in the research model’s series. The P-value of the Jarque Bera normality test is 0.7365. The hypothesis of no normal distribution is accepted (0.7365 > 0.05) based on Jarque Bera normality test. However, the serial correlation and heteroskedasticity tests results satisfied the diagnostic check analysis of the study.
DISCUSSION OF RESULTS OF FINDINGS
The findings of the study showed that oil revenue has a positive impact on economic growth in the long run in Nigeria and this conforms to the a priori expectation which indicates that with an increase in the revenue acquired from the production and sale of oil, there is an increase in the economic growth in the long run. The result is in line with the positions of Dauda et al (2023) and Muhammed et al (2021) on positive correlation, but contrary to Ebimobowei (2022) which predicted negative trend relationship between oil revenue and economic growth in Nigeria, contrary to a prior expectation. This study concludes that oil revenue is a major driver of the Nigerian economic growth.
Inflation has a negative effect on economic growth of Nigeria in the long run and this is in line with the a priori expectation. With a rapid increase in inflation, the value of money continues to drop and so does income from exchange and this leads to a situation of disequilibrium in balance of payment and this also leads to reduction in the economic growth. The result concur with Sunday (2019) which revealed negative significant impact of inflation on growth. This concludes the validity of the negative relationship between the research variables for government policy attention.
Effective exchange rate has a negative relationship with economic growth in the long run and this conforms to the a priori expectation. A high exchange rate makes import cheaper which discourages demand for domestic goods and also reduces production which eventually leads to a fall in the economic growth. The result is at variance with the position of Muhammed et al (2021) that a percentage in exchange rate would bring about a 5.8 percent increase in real gross domestic product in Nigeria. This concludes the existence of the trend volatility of exchange rates and its effect on economic variables like oil revenue in Nigeria.
Gross capital formation has a negative relationship with economic growth in the long run which does not conform to the a priori expectation. The result is consistent with Motunrayo and Nicholas (2020) which confirmed an insignificant relationship between gross capital formation and growth in the low income countries. In conclusion, the result confirms the poor saving habit for investment in the country.
Labour has a positive relationship with economic growth in the long run, which is in line with the a priori expectation. The findings of the study confirm with Motunrayo and Nicholas (2020) whose result indicated a positive and statistical significant relationship between labour force and growth. Conclusively, with an increase in labour productivity there is an increase in available products for exports and consumption which leads to an overall growth in the GDP.
RECOMMENDATIONS
Government should restrain maximum amount of annual spending, in order to limit the rapid increase in government unproductive expenditure that encourages inflation.
The government should engage in the rehabilitation of the old refineries and construction of new refineries in order to stop the age long practice of exporting unrefined oil at a low price and purchasing the refined oil at a high price. Reconstruction of refineries is necessary as the exportation of crude oil and importation of refined oil eat out of oil revenue and adversely affect growth.
Government should prioritize measures to reduce high exchange rate of naira with other countries’ currencies to strengthen international trade with the country.
The government should invest in other sectors of the economy, the over dependence of the Nigerian economy on the oil sector has led to massive macroeconomic fluctuations like unemployment, declining growth etc. The development and functionality of other sectors aside from oil is not only necessary to speed up the growth rate but also to increase overall production which can help reduce fluctuations in the economy.
Various procedures and protocols should be set up and diligently enforced to ensure that the diversion of revenue gotten from a leading sector like the oil sector are duly handled to attain the set macroeconomic objectives in Nigeria.
REFERENCES
- Adenuga, A. O., Hilili, M. J., & Evbuomwan, O. O. (2012). Oil Price Pass–Through into Inflation: Empirical Evidence from Nigeria. Economic and Financial Review, 50(1), 1-30.
- Akinleye, G. T., Olowookere, J. K., & Fajuyagbe S. B. (2021). The Impact of Oil Revenue on Economic Growth in Nigeria. Acta Universitatis Danubius Economica, 17(3), 317-329.
- Chen, K. C. (2021). The Impact of Oil Price Shocks on Economic Growth: The Case of Taiwan. International Journal of Economics and Financial Issues, 11(5), 96-103.
- Dauda, M., Alege, P. O., Ewetan, O. O., & Asemota, F. F. (2023). Oil Revenue and Sustainable Economic Growth in Nigeria: Empirical Analysis. International Journal of Energy Economics and Policy, 13(4), 150-155.
- Ebimobowei, A. (2022). Oil revenue and economic growth of Nigeria: 1990-2019. African Journal of Economics and Sustainable Development, 5(1), 17-46.
- Englama, A., Duke, O. O., Ogunleye, T. S., & Isma’il, F. U. (2010). Oil prices and exchange rate volatility in Nigeria: An empirical investigation. Central Bank of Nigeria Economic and Financial Review, 48(3), 31-48.
- Farzanegan, M. R., Alaedini, P., Azizimehr, K., & Habibpour, M. M. (2021). Effect of oil revenues on sizes and income of Iranian middle class. Middle East Development Journal, 13(1), 27-58.
- Jhingan, M. (2009). Money, Banking, International trade and public finance 7 th edition. Trends in tax revenue and expenditure of centre and state Government in India, Delhi, Nisha Enterprises. 837-838.
- Lim, Y. C., & Sek, S. K. (2016). An examination on the determinants of inflation. Journal of Economics, Business and Management, 3(7), 678-682.
- Manasseh, C. O., Nwonye, N. G., Abada, F. C., Okanya, O., Ogbuagu, A. R., Eze-Dike, F. U., Okonwo, O. N., Samson, O., Akamike, O. J., & Okon, J. O. (2022). Evaluating oil price movement and revenue generation in Nigeria during COVID-19 pandemic: Experience from pre and post era. International Journal of Energy Economics and Policy, 12(3), 57-65.
- Motunrayo, O. A., & Nicholas M. O. (2020). Asymmetric effect of oil price on economic growth: Panel analysis of low-income oil-importing countries Published by Elsevier Ltd. Contents lists available at Science Direct. elsevier.com/locate/egyr
- Muhammed, A. A., Ojotu, A. F., & Udi, J. (2021). Oil Revenue and Economic Growth in Nigeria: An Empirical Analysis. Journal of Economics and Allied Research, 6(1), 248-263.
- Nuhu, A. B. (2018). Impact of Oil Price Instability on Economic Growth (A Case of Nigeria). A master’s thesis presentation at Near East University, Northern Cyprus, Turkey. 1-89.
- Ogege, S., & Boloupremo, T. (2020). The Influence of Oil Price Uncertainty on Economic Activities in Nigeria. EMAJ: Emerging Markets Journal, 10(2), 18-24
- Ogiri, H. I., Amadi, S. N., Uddin, M. M., & Dubon, P. (2013). Oil Prices and Stock Market Performance in Nigeria: An Empirical Analysis. American Journal of Social and Management Sciences, 4, 20-41.
- Ogu, J. O. I. C., & Ojimadu, P. K. (2020). Impact of Oil Price Fluctuation on Economic Growth in Nigeria. IOSR Journal of Economics and Finance (IOSR-JEF, 11(6), 43– 54. https://doi.org/10.9790/5933-1106034354.
- Sauter R., & Awerbush S. (2006). Exploiting the Oil-GDP effect to support renewable development. Energy Policy, 34(17), 2805-2819.
- Sunday O. I. (2019). Oil Price Volatility and Infrastructural Growth: Evidence from an Oil Dependent Economy. Oradea Journal of Business and Economics, 4(1), 17-28.