
Physico-Chemical and Bacteriological Quality of Household Drinking Water from Source to Point of Use in Akewu Community in Ibadan, Oyo State, Southwest, Nigeria
- Babalola Toyin
- Oluwatuyi Mayowa
- Sam-Ijadele Kemi
- 106-122
- Apr 27, 2024
- Health
Physico-Chemical and Bacteriological Quality of Household Drinking Water from Source to Point of Use in Akewu Community in Ibadan, Oyo State, Southwest, Nigeria
Babalola Toyin1, Oluwatuyi Mayowa2 & Sam-Ijadele Kemi1
1Department of Environmental Health
2Department of Health Information Management
Ekiti State College of Health Sciences and Technology, Ijero, Nigeria
DOI: https://doi.org/10.51244/IJRSI.2024.1104008
Received: 07 March 2024; Revised: 04 April 2024; Accepted: 09 April 2024; Published: 27 April 2024
ABSTRACT
Poor household water storage is one of the major factors contributing to contamination of drinking water in Nigeria. Studies have shown that sizes of containers opening can affect water quality, but little has been documented on comparative effect of storage containers with different opening sizes in improving drinking water quality in Ibadan. This study was designed to assess the effect of different storage containers on household drinking water quality in selected communities in Ibadan. A quasi-experimental design was adopted. Four communities in Ibadan North Local Government namely; Akewu using protected springs as household drinking water sources were purposively selected. Forty-four households (11 from each community) were selected and randomly assigned to four treatment groups; those with Covered Buckets with Taps (CBT), Covered Buckets without Tap (CB), Covered Kegs with Taps (CKT) and Covered Kegs without Tap (CK). Prior to introducing the treatment containers, water samples were collected from their Regular Storage Containers (RSC) and springs for physicochemical and bacteriological analysis using standard methods. Participants were thereafter encouraged to store drinking water in the treatment containers provided for them. Water samples were later collected from CBT, CB, CKT and CK containers twice daily for 3 alternate days over two weeks for bacteriological analysis. In addition, oldest female of selected households were interviewed using a pre-tested semi-structured questionnaire to elicit information on their socio-demographic characteristics, storage container cleaning and handwashing practices. Results of physicochemical and bacteriological findings were compared with Standard Organisation of Nigeria (SON) guidelines. Data were analysed using descriptive statistics, t- test and ANOVA at p=0.05.
At baseline, mean pH values of water samples from the springs and RSC were 6.4±0.6 and 7.1±0.7 respectively compared with 6.5-8.5 limits recommended by SON. Mean chloride concentration of springs (14.3±7.4mg/l) and RSC (19.3±10.0 mg/l) samples were below 250mg/l limit recommended by SON. Mean Total Coliform Count (TCC) of the springs in the four communities was 18.0±4.0 and mean TCC of RSC was 12.7±4.9 which exceeded the SON standard of 10MPN/100ml. Five percent of water samples from RSC had mean E.coli count of 100/100ml compared with SON guidelines of 0/100ml. The mean TCC after introducing CB, CBT, CK and CKT in all the communities were 10.0±4.0, 8.5±4.2, 6.9±2.8 and 7.3±3.7 respectively (p<0.05). No E.coli was found in the samples collected from the treatment storage containers. The percentage difference of coliform count in water from springs and RSC was 29.4% while percentage difference from RSC and CB, CBT, CK and CKT were 21.5%, 33.2%, 45.5% and 42.5% respectively. Mean age of the 44 respondents interviewed was 37.9±10.7years. Seventy-three percent washed their hands with only water after defecation and 95.0% stored water for cooking and drinking in the same container. Sixty-eight percent cleaned their containers weekly while 32.0% cleaned twice weekly.
Keywords: Drinking water, Storage containers, Total coliform count, Water quality.
INTRODUCTION
Water is a common chemical substance that is essential for the survival of all known forms of life. Water is capable of existing in three states: liquid, solid (ice) or gaseous (water vapor or steam). Water covers 71% of the Earth’s surface. On Earth, it is found mostly in oceans and other large water bodies, with 1.6% of water below ground in aquifers and 0.001% in the air as vapor, clouds and precipitation. The oceans hold 97% of surface water, glaciers and polar ice caps 2.4% and other land surface water such as rivers, lakes and ponds 0.6%. A very small amount of the Earth’s water is contained within biological bodies and manufactured products (Pollack, 2011). Clean, fresh drinking water is essential to human, animals and plants. Access to safe drinking water has improved steadily and substantially over the last decades in almost every part of the world. However, Kulshreshtha (1998) have estimated that by 2025 more than half of the world population will be facing water-based vulnerability, a situation which has been called a water crisis by the United Nations. Water plays an important role in the world economy, as it functions as a solvent for a wide variety of chemical substances and facilitates industrial cooling and transportation (Baroni et. al., 2007).
In the United States, the U.S. Environmental Protection Agency (EPA) limits the amounts of certain contaminants in tap water provided by public water systems. The Safe Drinking Water Act authorizes EPA to issue two types of standards: primary standards regulating substances that potentially affect human health and secondary standards that prescribe aesthetic qualities, those that affect taste, odor, or appearance (USEPA, 2002).
Household water treatment is any activity to improve water quality undertaken at the household level. Safe water storage is the use of clean containers with covers and good hygiene behaviours that prevent contamination during water collection, transport, and storage in the home (WHO, 2010). It is being increasingly recognized that drinking water from protected sources is not always free from faecal contamination and that the collection, storage and use of water in the home can frequently lead to contamination. Household water treatment and safe storage (HWTS) are being promoted to deal with these concerns, as well as to potentially enable water from unprotected sources to be consumed safely (WHO, 2009).
Provision of safe household water includes the conditions and practice of water collection, storage, handling and the choice of storage containers (Nala et al, 2003). The use of contaminated water containing excessive faecal bacteria load poses health risks to consumers, regardless of where or how the water became contaminated. In some cases water is collected from a contaminated source. In other cases water is obtained from a source of high microbiological quality, including treated supplies containing residual chlorine, but it becomes contaminated in the home due to inadequate and unsanitary storage conditions that allow for the introduction or proliferation of disease-causing microbes. In either case, the microbially contaminated water poses health risks that can be reduced by improved storage conditions and household treatment (Tambekar and Mahore, 2005).
Household water treatment can be carried out using effective, simple, and inexpensive methods. It is especially applicable to populations recovering from a disaster situation who often lack facilities and the general population. For example, if household bleach is available, a dilute chlorine solution can be used to disinfect water. Water can also be safely treated by exposing it to sunlight; all that is required is a clear plastic bottle. Another option to treat water at home is the use of simple ceramic pot filters molded by local artisans. If available, commercially produced tablets containing chlorine, or sachets with combined flocculation and disinfection properties, can also effectively re
Statement of Problem
Studies have documented inadequate storage conditions and vulnerable water storage containers as factors contributing to decrease microbial quality compared to either source waters or water stored in improved vessels. There are cases of documented increased risks of water-borne infectious diseases from inadequately stored water compared to water treated and stored in an improved vessel (safe storage) in the home to improve microbial quality. Higher levels of microbial contamination are associated with storage vessels having wide openings (e.g., buckets and pots), vulnerability to introduction of hands, cups and dippers that can carry faecal matter, and lack of a narrow opening for dispensing water. In Nigeria, the bacteriological quality of drinking water at source and that stored in containers by urban households in Ibadan were found to be contaminated as a result of poor handling. Unsafe drinking water, along with poor sanitation and hygiene are the main contributors to an estimated 4 billion cases of diarrhea disease annually, causing 1.8 million deaths mostly among children < 5 years of age. Contaminated water is also an important contributor to other potentially waterborne diseases, including typhoid, hepatitis A and E, and poliomyelitis.
Objective of the study
To Determine the physico-chemical and bacteriological quality of household drinking water from source to point of use in selected communities in Ibadan.
METHODOLOGY
Study Area
Ibadan is the largest indigenous urban centre in Africa South of the Sahara with a projected population of four million. Ibadan is located in south-western Nigeria, 128 km inland northeast of Lagos and 530 km southwest of Abuja, the federal capital, and is a prominent transit point between the coastal region and the areas to the north. The study was carried out in akewu community in Ibadan North Local Government in Oyo State of Nigeria. Ibadan North LGA is one of the five metropolitan LGAs in Ibadan city with its headquarter at Agodi. It was created out of the defunct Ibadan Municipal Government by the Federal Military Government of Nigeria on September 27, 1991. Ibadan north is a multi-ethnic community dominated mainly by the Yoruba’s. Majority of the inhabitants works with the private sector. It has an area of 27 km² and populations of 306,795 at the 2006 census. They are mainly traders and artisans (Federal Republic of Nigeria Official Gazette, 2007). The map of Ibadan is attached in Appendix 1.
Study Design
A quasi-experimental design was adopted for the study. It involved both quantitative (survey, water quality assessment from protected spring sources to household) and qualitative (Focus Group Discussions) methods.
Study Population
The study involved adult females of the four selected communities. Few adult males were as well interviewed. Only those who gave their informed consent were included in the study.
Sample size calculation for water analysis.
Bucket with taps, buckets without taps, kegs with taps and kegs without tap were provided to the communities with the aim of reducing the impurities in the households’ drinking water storage containers by at least 20% while other household storage containers served as control. A pilot study was done prior to the main study, water samples collected from regular storage containers were taken to the laboratory for microbial analysis. It was discovered that 70% of the households’ domestic storage system had unacceptable levels of impurities (coliform count greater than 10/100ml).
Based on this information a sample size was calculated using the formula by Lwanga and Lemeshow (1991).
N = (Z1-α/2 + Z1-ß)2 (P1q1+P2q2)
(P1-P2)2
Where
Z1-α/2 = Standard normal deviate corresponding to 5% level of significance =1.96
Z1-ß =Standard normal deviate corresponding to power of 80% = 0.84
P1= percentage greater than 10 in the coliform count of household containers=0.7
P2=expected percentage level of reduction/ effectiveness=0.2
N= (1.96+0.84)2*(0.7*0.3) + (0.2*0.8)
(0.70-0.20)2
=11
A total of 44 households were used for the intervention.
Sampling Procedure
Four communities in the Ibadan North Local Government (Agbadagbudu, Akewu, Onipasan and Kube) that used spring as source of drinking water were selected for the study. In the communities a three stage sampling procedure was adopted.
A list of enumeration areas in the selected communities was obtained from the National Population Commission. From the enumeration areas, one enumeration area was randomly selected. The households in the enumeration areas were numbered and the desired numbers of respondents were selected using systematic random sampling method. In the absence of the female head that was selected in each household the male head was interviewed.
Methods of Data Collection
The methods used for the study is:
Laboratory analysis (Bacteriological and Physico-chemical analysis of water samples)
Collection of water samples for physico-chemical and bacteriological analysis
The environmental field sampling that was carried out in this study was collection of water samples from the source of water supply (protected springs), household regular storage containers and introduced containers for determination of physico-chemical and bacteriological quality.
Sample collection for physico-chemical analysis.
Water samples were collected according to recommended standard methods described by the American Public Health Association (APHA, 1998). New plastic kegs of 2-liter capacity were used to collect samples for physico-chemical parameters directly from the taps/hand-pump connected to the spring box of the protected spring while plastic bottles of 60mls capacity were also used to collect samples for heavy metal analysis. The samples were used to rinse the new plastic kegs and bottles before collection from the taps of the springs and also with the aid of a cup from their regular storage containers for physico-chemical analysis.
Sample collection for bacteriological analysis.
Sterile sample bottles that were used for sample collection were properly washed, rinsed with distilled water, dried and sterilized in an oven at a temperature of 1600C for 1 hour. All the containers were closed until the point of sample collection. Samples were collected from springs, regular storage containers, covered buckets with and without taps and covered kegs with and without taps. Samples were collected under aseptic condition. Samples were immediately placed in a lightproof insulated box containing melting ice with water to ensure rapid cooling and the analysis were commenced immediately the samples got to the laboratory.
Physico-chemical Analysis
The pH
pH is a measure of the concentration of hydrogen ions in solution, and therefore of its acidity or alkalinity. A pH of 7 indicates neutral solution; a pH below 7 indicates acidity and a pH in excess of 7 indicates alkalinity. The pH meter used was calibrated using buffer solution of pH 4.0 and 7.0 at temperature of 250C.
The pH of the samples was read using a calibrated pH meter, HANNA S358236 model. A volume of 200 ml of the water samples were measured into a beaker. The pH meter probe and the temperature probe were then inserted making sure it did not touch the beaker. The pH reading was then taken from the Liquid Crystal Display (LCD) after it had stabilized. In between readings, the electrode of the pH meter was rinsed with distilled water to avoid contamination.
Conductivity
The ability of water to conduct an electric current is known as conductivity and depends on the concentration of ions in solution. Conductivity is measured in millisiemens per metre (1 mS m-1 = 10 μS cm-1 = 10 μmhos cm-1). Electrical conductivity was measured using Jenway electric conductivity TDS /meter, Model 470. 200mls of the sample was measured into sterile beaker and the calibrated conductivity meter was inserted into the beaker with the tip containing the electrode touching the water for approximately 3minutes until the conductivity reading became stable. The measurement was taken and recorded immediately. The electrode of the conductivity meter was rinsed with distilled water, dried with tissue and then a portion of the sample and the rinse water was discarded before another measurement.
Total dissolved solids (TDS)
Total dissolved solids are the amount of dissolved solid materials present in an aqueous solution. Dissolved solids refer to the minerals, salts, metals, cations, anions dissolved in water. TDS comprise of inorganic salts such as magnesium, potassium, sodium, calcium, chlorides, sulphates and bicarbonates. TDS is used as an indicator test to determine the general quality of water whether it is corrosive, salty or has brackish taste. TDS in drinking water may originate from natural sources, sewage, industrial waste-water and chemicals used in water treatment process, and the nature of the piping used to convey the water to the household (APHA,1995). The TDS of the water samples was measured with a Jenway, model 470 conductivity/ TDS meter.
Total alkalinity
The alkalinity of water may be defined as its capacity to neutralize acid. Alkali substances in water include hydroxides or bases. They can be detected by their acrid taste and by the fact that they cause red litmus paper to turn blue. The alkalinity of water is the capacity of that water to accept protons. It is usually imparted by the bicarbonate, carbonate and hydroxide compound of a natural or treated water supply. It is determined by titration with a standard solution of a strong mineral acid to the successive bicarbonate and carbonic acid equivalence points, indicated electrometrically or by means of color change with an indicator methyl orange (APHA, 1998).
Procedure
One hundred millilitre of water sample was put into a clean conical flask. Two drops of methyl orange indicator was added to the water sample. Then the solution was titrated with 0.02M standard HCl solution until the colours changes from orange to pink.
The conversion obtained in this step corresponds to the equation:-
2 HCO3—+ H2SO4 → SO42- + 2H2CO3
The volume of the acid used was noted (Vp ml)
Calculation
Total alkalinity
As mg/l CaCO3 = (Vp×M×10)/mlsample
Where M is the molarity of the acid used and
Vp is the volume of sample used.
Chloride
Chloride is one of the major inorganic anions in water. In potable water, the salty taste produced by Cl– concentration varies and is dependent on the chemical composition of the water. Some water containing 250mg/L Cl– may have a detectable salty taste if sodium Na+ is the cation, while the typical salt taste may be absent in water containing as much as 1000 mg/L Cl– when the predominant cations are calcium Ca2+and magnesium Mg2+.
Procedure
Preparation of reddish- brown colour comparison blank 100ml of distilled water was put in a clean conical flask and 1ml K2CrO4 solution was added and then 0.2ml of 0.0141m AgNO3 solution. The mixture was shaked gently and leaved to stand.
100ml sample was pipetted into a clean conical flask and 1ml K2CrO4 indicator was added and titrated with constant stirring with 0.2ml of 0.0282M AgNO3 solution to the colour of the comparison blank.
Calculation
Cl(mg/L) = ((A-B) ×M×70,900)/mlsample
Where A= ml AgNO3 used for titrating sample
B= ml AgNO3 used for titrating blank= 0.2ml
M= molarity of AgNO3
Total Hardness
Hardness is defined as a characteristic of water that represents the total concentration of calcium (Ca2+) and magnesium (Mg2+) ions expressed as calcium carbonate (CaCO3) (APHA, 1998). Ca2+ and Mg2+ salts, the principal mineral constituents, consume soap and precipitate as insoluble compounds or soap curds. Until all the Ca2+ and Mg2+are precipitated, no lather or washing action is obtained from the soap. The soap consuming power of water is therefore a measure of its hardness. Calcium and magnesium generally are dissolved as soluble bicarbonate (HCO3–), but may change owing to heating to the less soluble carbonate (CO32-) which precipitates as one of the sources of scales in distributing systems and hot water heaters.
Procedure
Twenty-five millilitre of water sample was diluted to about 50ml with distilled water in an Erlenmeyer flask. Iml buffer solution was added. The solution was titrated with 0.01 M EDTA. Erichrome Black T was used as indicator. A sharp end point was obtained by adding 5mls of 0.1M NaOH which gave a wine red colour. 1ml was used and the titration was continued slowly with continuous shaking until the colour changed to blue.
Calculation
Hardness (mg/l CaCO3) = (V×A×1000)/mlsample
Where V= ml titration for sample
A= mg CaCO3 equivalent to 1ml titrant
Total solids
Procedure: A clean petri dish was dried at 1050C in an oven until constant weights was achieved and cooled to room temperature in a dessicator. The weight was noted. Fifty (50ml) of the water sample was pipetted into the petri dish and evaporated to dryness on a steam bath. The outside of the dish was wiped and the residue was dried in an oven for about 1 hour at 1050C. The dish was quickly transferred into a dessicator, cooled to room temperature and weighed. The dish was returned into the oven, dried further for 10-20minutes and weighed after cooling at room temperature.
% Total solids = (wt.ofpetridish+Drymatter-wtofpetridish×100)/wtofwater
Determination of heavy metals
Heavy metals analysed for included lead, iron cadmium and manganese using Atomic Absorption Spectrophotometer Varian 200 spectra made by Buck scientific and using specific elemental lamp for each metal tested for.
Procedure
The Atomic Absorption Spectrophotometer (Varian 200 spectra manufactured in the year 2004) was used to determine the level of iron, lead, manganese and cadmium in the water samples by following the method described by APHA (1995). The samples used were aspirated through the nebulizer into the air-acetylene flame where the atomization took place. A source lamp for each element was used and the amount of energy absorbed in the flame was proportional to the concentration of the element in the sample over a limited concentration range
Method of Bacteriological Analysis of Water
Two methods of bacteriological analysis were used in this study. They weremultiple tube fermentation technique or Most Probable Number (MPN) for estimation of coliform count and pour plate technique for heterotrophic plate count of bacteria in the water samples.
Preparation of media
Nutrient Agar– twenty eight grams of nutrient agar powder manufactured by micro master was weighed and added to 1 litre of distilled water. It was allowed to soak for 10minutes and swirled to mix. It was then autoclaved at 1210C for 15 minutes. The medium was cooled to 470C after autoclaving before pouring into plates and used for the bacterial plating.
MacConkey agar– 52g of MacConkey agar manufactured by oxoid cm007 was homogenized in 1 litre of distilled water using water bath at 1000C. This was then autoclaved at 1210C for 15 minutes. The medium was cooled to 450C after autoclaving before pouring into plates and used for the bacterial plating.
MacConkey broth– Two different concentrations of the culture medium were prepared: the double strength and the single strength. Double strength was prepared by carefully weighing seventy (70) gramof the powdered MacConkey broth and dissolved in one (1) liter of distilled water. The single strength was prepared by dissolving thirty-five (35) gram of the powdered media in one (1) liter distilled water. Twenty (20) fermentation tubes with inverted Durham tubes were prepared (the tubes were properly washed, rinsed with distilled water and labelled with the sample reference number) for each sample. 10 ml Double strength culture medium was dispensed into five (5) of the tubes while 5 ml single strength culture medium was dispensed into the remaining fifteen (15) tubes. Then the culture medium was sterilised using an autoclave at 1210C for 15minutes.
Multiple Tube Fermentation Technique (MPN) Method
MPN is the most common method for detection of coliform bacteria in water.It is convenient to express the result in replicate tubes and dilutions in terms of the Most Probable Number (MPN). This term is actually an estimate based on certain probability formula. The presumptive test for coliforms was used (APHA 1998).
Water sample preparation
Two serial dilution of the sample water was prepared: 1:10 sample and 1:100 samples. The 1:10 dilution series was prepared by pipetting 1ml from the original sample and diluted to 10ml with 9ml distilled water while 1:100 dilution series was prepared by diluting 1ml of sample from 1:10 serial dilution and diluted to 10ml with 9ml distilled water. The dilution (distilled) of water used was sterilised by autoclaving at temperature of 1210C for 15 minutes. An undiluted sample (the sample without any dilution) was also used.
Detection and Enumeration of the Coliform Oganisms
10 ml of the original sample was measured into each of the five (5) tubes containing 10 ml of the double strength media already prepared. 1ml of the original sample was pipetted into each of the five tubes containing 5ml of the prepared single strength medium. One (1ml) of the 1:10 sample already prepared was measured into each of the five tubes containing 5mls of the prepared single strength medium while 1ml of 1:100 sample prepared was pipette into each of the five tubes containing 5mls of the single strength media already prepared. Different pipette was used for each of the measurement during inoculation. Then the tubes were incubated for a period of 24 to 48 hours at 370C.
After 24 hours, the incubator was opened to note which tubes showed growth. Tubes that showed colour change, turbidity and gas production were regarded as positive. The numbers of positive tubes were recorded for each dilution. Then the tubes were returned into the incubator and re-examined after a total of 48 hours of incubation. Then the pattern of positive results was read from McCrandy’s statistical table. The tabulated value was reported as MPN per 100 ml of sample.
Heterotrophic plate count of organisms on the media
This was done using pour plate method .A sterile pipette was used to measure 1ml of the 1:10 diluted sample into a sterile petri-dish and molten nutrient agar at 450C was poured on it aseptically. It was swirled gently for even distribution of the inoculums in the agar. After solidification the plates were inverted and incubated at 370C in an incubator for 24 hours. This was also done for MacConkey agar which is a differential medium.
Identification of Isolates
Isolates were identified on nutrient and MacConkey agar after examining the cultural, morphological and microscopic examination of the various isolates on the plates using the shape, size, elevation, edges, colour and pigmentation.
Data Analysis
All the data collected was analyzed using SPSS (Statistical Package for the Social Sciences). The analysis included descriptive statistics such as frequencies, percentages, and means. Also, inferential statistics such as chi-square test, t-test and ANOVA at 5% level of significance were also used to analyze data. The results obtained from the study were presented in charts, tables and graphs.
Ethical consideration
The recruitment of respondents was based strictly on informed consent. The aims and objective of the study was fully explained to the participants. The study participants were also assured of the confidentiality of the information supplied. Study participants were duly informed of their right to withdraw from the study at anytime.
RESULT
Physico-Chemical and Bacteriological Quality
This section presents the results of water analysis from the four communities studied. Water samples from Spring sources, Regular storage containers and four different treatment containers introduced- Covered buckets with taps, Covered buckets without taps, Covered kegs with taps and Covered kegs without taps were collected and analyzed for physico-chemical and bacteriological quality parameters. The results were compared with World Health Organization (WHO) guidelines and standard for drinking water quality by Standard Organization (SON) of Nigeria.
Quality of water samples from springs, Regular storage containers and samples from the four treatment methods- Covered buckets with taps, Covered buckets without taps, Covered kegs with taps and Covered kegs without taps were compared with WHO and SON standard.
Physico-Chemical Analysis of Akewu Spring Water and Water Stored in Regular Storage Container Analysis.
The physico-chemical quality of Akewu raw water samples from spring and Regular storage containers. It also shows a comparison of the results with recommended limits as supported by the WHO.
The mean pH of the water samples was from spring was 6.77±0.07 while it was 7.35±0.54 from their regular storage containers. This falls within the range of WHO guideline limit of 6.5-8.5. The mean total solids of the water samples from spring and regular storage container was 1500.00±200.00 and1803.75±96.40mg/L respectively while the mean total dissolved solid of the water samples from spring and regular storage containers was 350.00±50.00 and 372.50±89.66mg/L respectively which was within the WHO guideline of 500mg/L. The mean conductivity of the water samples for spring and household storage containers was 581.00±31.00 and 676.50± 228.43 µs/cm respectively which was in line with the WHO standard of1000µs/cm. The mean Total hardness of water samples from spring and regular storage container was 75.00±5.00 and 75.88±7.45mg/l respectively. The mean alkalinity for water samples from spring and regular storage container was 1.40±0.03 and 1.68±0.55mg/L respectively, while the mean chloride was 12.00±2.00 and 16.75±8.33mg/L for spring and regular storage container respectively. The heavy metal analysis that was done included Iron, Lead, Manganese and Cadmium. The mean value for Iron from spring and regular storage container was 0.20±0.00 mg/L and 0.25±0.09 mg/L, lead concentration was 0.20±0.00 for spring and 0.028±0.014mg/L for regular storage container, cadmium level not detected in both source, while manganese concentration was 0.20±0.00 mg/L from spring sample and 0.028±0.014mg/L for regular storage containers.
Table 1: Physico-chemical quality of water samples from Akewu spring source and participants’ Regular Storage Containers
| Physico-chemical Quality | |||||
| Parameter (Unit) | Spring sample | Household container sample | WHO | SON | |
| pH | 6.77±0.07 | 7.35±0.54 | 6.5-8.5 | 6.5-8.5 | |
| Total solids (mg/L) | 1500.00±200.00 | 1803.95±96.40 | 1500 | 500 | |
| Total Dissolved solid (mg/L) | 350.00±50.00 | 372.50±89.66 | 500 | 500 | |
| Conductivity (µS/cm) | 581.00±31.00 | 676.50±228.43 | 1000 | 1000 | |
| Total Hardness (mg/L) | 75.00±5.00 | 75.88±7.45 | 100-150 | 150 | |
| Alkalinity (mg/L) | 1.40±0.03 | 1.68±0.55 | 120 | 120 | |
| Chloride (mg/L) | 12.00±2.00 | 16.75±8.33 | 250 | 250 | |
| Iron (mg/L) | 0.20±0.00 | 0.250±0.091 | 0.3 | 0.3 | |
| Lead (mg/L) | 0.20±0.00 | 0.028±0.014 | 0.1 | 0.1 | |
| Cadmium (mg/L) | 0.00±0.00 | 0.00±0.00 | 0.1 | 0.1 | |
| Manganese(mg/L) | 0.20±0.00 | 0.028±0.014 | 0.1 | 0.2 | |
Bacteriological Quality of Water Samples from Spring Sources, Regular Storage Containers and Covered Buckets in Akewu.
The results of bacteriological analysis of the water samples from spring source, regular storage containers and the covered containers bucket that were provided in Akewu community are shown in Table 4.22. The mean total coliform count/100ml of water samples from spring source was 12.00±2.00/100ml, regular storage containers was10.50±3.83/100ml while samples from the covered buckets introduced had a mean value of 10.00±3.61/100ml. The mean total viable count (TVC) of the water sample from spring source was 3.0×10⁴±2.0×10³ cfu/ml, regular storage containers samples was 5.6×10⁴±2.9×10³cfu/ml while the mean of the sample from covered buckets was 1.4×10⁴±7.6×10³ cfu/ml. The mean total coliform count (TCC) of the water sample from spring source was 2.7×10⁴±2.0×10³cfu/ml, regular storage containers was 3.9×10³±4.1×10³ cfu/ml while the mean of the sample from covered bucket was 6.9×10³±3.9×10³ cfu/ml. The difference observed between total coliform count of water samples from regular storage containers and covered buckets were not statistically significant (Table 4.23).
The aerobic organisms detected in the Akewu spring source were Bacillus, Pseudomonas and Flavobacterium while that of regular storage containers water sample included Bacillus, Staphylococcus, Micrococcus and Flavobacterium. The organisms found in the water samples in the covered buckets containers included Bacillus, Staphylococcus, Pseudomonas and Micrococcus. The coliform organisms that were found in the samples from spring source was Enterobacter and Proteus while that of regular storage containers included Aeromonas, Enterobacter, Klebsiella and Proteus. The organisms found in the water samples in the covered buckets containers included Aeromonas, Enterobacter, Klebsiella and Proteus.
Bacteriological quality of Water Samples from spring source, Regular Storage Containers and Covered Buckets with Taps in Akewu.
The results of bacteriological analysis of the water samples from spring source, regular storage containers and the covered buckets with taps containers that were introduced in Akewu community. The mean total coliform count/100ml of water samples from spring source was 12.00±2.00/100ml, regular storage containers was 14.75±3.41/100ml while samples from the covered buckets with taps was 8.75±3.38/100ml. The mean total viable count (TVC) of the water sample from spring source was 3.0×10⁴±2.0×10³ cfu/ml, regular storage containers samples was 7.0×10³±4.2×10³ cfu/ml while the mean of the sample from covered buckets with taps was 1.3×10⁴±1.2×10³ cfu/ml. The mean total coliform count (TCC) of the water sample from spring source was 2.7×10⁴±2.0×10³ cfu/ml, regular storage containers and the mean was 5.3×10³±1.6 ×10³cfu/ml while that of the sample from covered buckets with taps for was1.1×104± 5.4×10³ cfu/ml. The difference observed between total coliform count of water samples from regular storage containers and covered bucket with tap was not statistically significant.
The aerobic organisms detected in the Akewu spring source were Flavobacterium, Pseudomonas and Bacillus while that of regular storage containers water sample included Bacillus, Staphylococcus and Micrococcus. The organisms found in the water samples in the covered buckets with tap containers included Bacillus, Staphylococcus and Micrococcus.The coliform organism that were found in the samples from spring source was Enterobacter and Proteus while that of regular storage containers included Aeromonas, Enterobacter, and Klebsiella. The organisms found in the water samples in the covered buckets with tap containers included Aeromonas,Enterobacter, Klebsiella and Proteus.
Table 2: Bacteriological quality of water samples from Akewu spring source, regular storage containers, covered buckets and covered buckets with taps
| Bacteriological quality | WHO | SON | |||||
| Parameter (Unit) | Spring source | regular storage container sample | Covered bucket
sample |
regular storage container sample | Covered bucket with Tap | ||
| Total Coliform count (MPN/100ml) | 12.00±2.00 | 10.50±3.83 | 10.00±3.61 | 14.75±3.41 | 8.75±3.38 | 10/100ml | 10/100ml |
| Total Viable Count (cfu/ml) | 3.0×10⁴±2.0×10³ | 5.6×10⁴±2.9×10³ | 1.4×10⁴±7.6×10³ | 7.0×10³±4.2×10³ | 1.3×10⁴±1.2×10³ | 1×10² | 1×10² |
| Total Coliform Count (cfu/ml) | 2.7×10⁴±2.0×10³ | 3.9×10³±4.1×10³ | 6.9×10³±3.9×10³ | 5.3×10³±1.6 ×10³ | 1.1×10⁴± 5.4×10³ | 0/100ml | 0/100ml |
Table 3: Comparison using coliform count from water samples from regular storage containers (RSC), covered buckets (CB) and covered buckets with tap (CBT) in Akewu
| Treatment | Coliform count | F-value | p-value |
| Samples from RSC
Samples from CB |
10.50±3.83
10.00±3.61 |
0.44 | 0.51 |
| Samples from RSC
Samples from CBT |
14.75±3.41
8.75±3.38 |
0.26 | 0.61 |
Table 4: Bacteria detected from water samples in spring, regular storage containers, covered buckets and covered buckets with taps in Akewu
| Aerobic organisms | Coliform organisms | |
| Spring | Flavobacterium, Pseudomonas and Bacillus | Enterobacter and Proteus |
| Regular storage container | Bacillus, Staphylococcus, Micrococcus and Flavobacterium | Aeromonas, Enterobacter,Klebsiella and Proteus |
| Covered bucket | Bacillus, Staphylococcus, Micrococcus and Flavobacterium | Aeromonas,Enterobacter,Klebsiella and Proteus |
| Spring | Flavobacterium, Pseudomonas and Bacillus | Enterobacter and Proteus |
| Regular storage container | Bacillus, Staphylococcus and Micrococcus | Aeromonas, Enterobacter, and Klebsiella. |
| Covered buckets with taps | Bacillus, Staphylococcus and Micrococcus | Aeromonas,Enterobacter,Klebsiella and Proteus |
Bacteriological quality of Water Samples from spring source, Regular Storage Containers and Covered Kegs in Akewu
The results of bacteriological analysis of the water samples from spring source, regular storage containers and covered kegs that were introduced in Akewu community. The mean total coliform count/100ml of water samples from spring source was 12.00±2.00/100ml, regular storage containers was 12.33±1.51/100ml while samples from the covered kegs were 7.33±3.14/100ml. The mean total viable count (TVC) of the water sample from spring source was 3.0×10⁴±2.0×10³ cfu/ml, regular storage containers samples was 8.2×10⁴±1.7×10³ cfu/ml while the mean of the sample from covered kegs was 1.2×10⁴±7.5×10³ cfu/ml. The mean total coliform count (TCC) of the water sample from spring source was 2.7×10⁴±2.0×10³cfu/ml, regular storage containers was 3.0×10²±1.3×10² cfu/ml while the mean of the sample from covered kegs was 1.0×10⁴±7.2×10³ cfu/ml. There was a statistically significant association between the mean of Total Coliform Count of water samples from regular storage containers and covered kegs.
The aerobic organisms detected in the spring source were Flavobacterium, Pseudomonas and Bacillus while that of regular storage container included Bacillus, Staphylococcus and Micrococcus. The organisms found in the water samples in the covered kegs containers included Bacillus, Staphylococcus,Pseudomonas,Flavobacterium and Micrococcus. The coliform organisms that were found in the spring source was Enterobacter and Proteus while that of regular storage water sample containers included Aeromonas, Enterobacter and Proteus. The organisms found in the water samples in the covered kegs containers were Aeromonas, Enterobacter and Proteus.
Bacteriological quality of Water Samples from spring source, Regular Storage Containers and Covered Kegs with Taps in Akewu
The results of bacteriological analysis of the water samples from spring source, regular storage containers and the covered kegs with taps that were introduced in Akewu community. The mean total coliform count/100ml of water samples from spring source was 12.00±2.00/100ml, regular storage containers was10.00±4.00/100ml while samples from the covered kegs with tap introduced was 7.00±3.36/100ml. The mean total viable count (TVC) of the water sample from spring source was 3.0×10⁴±2.0×10³ cfu/ml,regular storage containers samples was analysed and given as 1.4×10⁴±3.1×10³cfu/ml while the mean of the sample from covered kegs with tap introduced was 1.7×10⁴±8.1×10³cfu/ml. The mean total coliform count (TCC) of the water sample from spring source was 2.7×10⁴±2.0×10³cfu/ml, regular storage containers and the mean was 4.3×10³±1.6×10³cfu/ml while the mean of the sample from covered kegs with tap was1.3×104±6.3×10³ cfu/ml. There was no significant association between the mean of Total Coliform Count of water samples from regular storage containers and covered keg with tap.
The aerobic organisms that were found in the spring sample was Flavobacterium, Pseudomonas and Bacillus while that of regular storage water sample containers included Staphylococcus, Micrococcus and Pseudomonas. The organisms found in the water samples in the covered kegs with tap containers included Bacillus, Staphylococcus and Pseudomonas. The coliform organisms that were found in the samples from spring source was Enterobacter and Proteus while that of regular storage containers included Aeromonas, Enterobacter and Proteus. The organisms found in the water samples in the covered kegs with tap containers included Aeromonas, Enterobacter and Klebsiella. Plate 1 shows the type of storage containers that were provided for water storage in the community.
Table 5: Bacteriological findings of water samples from Akewu spring source, regular storage containers, covered kegs and covered kegs with taps
| Bacteriological Findings | WHO | SON | ||||||
| Parameter (Unit) | Spring source | Regular storage container sample | covered kegs sample | Regular storage container sample | covered kegs with Tap | |||
| Total Coliform Count (MPN/100ml) | 12.00±2.00 | 12.33±1.51 | 7.33±3.14 | 10.00±4.00 | 7.00±3.36 | 10/100ml | 10/100ml | |
| Total Viable Count (cfu/ml) | 3.0×10⁴±2.0×10³ | 8.2×10⁴±1.7×10³ | 1.2×10⁴±7.5×10³ | 1.4×10⁴±3.1×10³ | 1.7×10⁴±8.1×10³ | 1×10² | 1×10² | |
| Total Coliform Count (cfu/ml) | 2.7×10⁴±2.0×10³ | 3.0×10²±1.3×10² | 1.0×10⁴±7.2×10³ | 4.3×10³±1.6×10³ | 1.3×10⁴±6.3×10³ | 0/100ml | 0/100ml | |
Table 6: Comparison using coliform count from water samples from regular storage containers (RSC), covered kegs (CK) and covered kegs with taps (CKT) in Akewu
| Treatments | Coliform count | F-value | P value |
| Samples from RSC
Samples from CK |
12.33±1.51
7.33±3.14 |
2.78 | 0.12 |
| Samples from RSC
Samples from CKT |
10.00±4.00
7.00±3.35 |
0.39 | 0.54 |
Table 7: Bacteria detected from water samples in spring, regular storage containers, covered kegs and covered kegs with taps in Akewu
| Source | Aerobic organisms | Coliform organisms |
| Spring | Flavobacterium, Pseudomonas and Bacillus | Enterobacter and Proteus |
| Regular storage container | Bacillus, Staphylococcus and Micrococcus. | Aeromonas, Enterobacter and Proteus. |
| Covered kegs | Bacillus, Staphylococcus, Pseudomonas, Flavobacterium and Micrococcus. | Aeromonas, Enterobacter and Proteus |
| Spring | Flavobacterium, Pseudomonas and Bacillus | Enterobacter and Proteus |
| Regular storage container | Staphylococcus, Micrococcus and Pseudomonas | Aeromonas, Enterobacter and Proteus |
| Covered kegs with taps | Bacillus, Staphylococcus, and Pseudomonas. | Aeromonas, Enterobacter and Klebsiella |
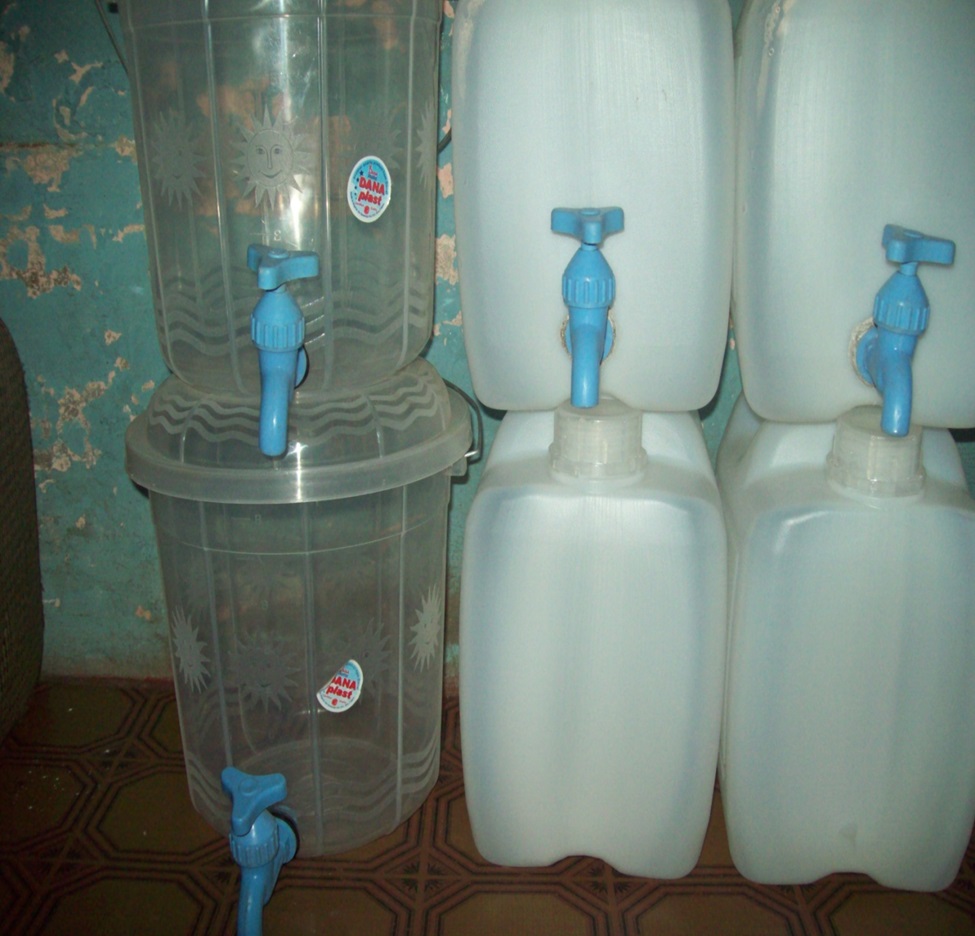
Plate 1: Storage containers used for intervention in the communities participants’ households
Physico-chemical Water Quality Assessment
The pH of water is extremely important. The fluctuations in optimum pH ranges may lead to an increase or decrease in the toxicity of poisons in water bodies (Ali, 1991). The mean pH of the water samples from the spring was 6.42±0.58 while the regular storage containers had a mean pH of 7.09±0.65. However, the range of the pH values for the spring sources had values lower than 6.5 recommended by the WHO. The acidic nature of the samples agrees with the assertion that the pH changes in water quality may be as a result of introduction of contaminants (Oloruntoba et al, 2006). The generally low pH values obtained in the water samples might also be due to the high levels of free CO2, in the water samples, which may consequently affect the bacterial counts (Edema et al, 2001). The mean electrical conductivity of springs and regular storage containers were within the WHO guideline which is in conformity with another study in Nigeria (Onianwa et al, 1999). The mean alkalinity for both springs and regular storage containers were within the WHO guideline for drinking. Mean alkalinity of drinking water reflects the presence of bicarbonate ion which provides buffering action against acidic effects (Sarapata, 1994). The mean chloride levels in the springs and regular storage containers were within the WHO permissible limit which implies that contamination was minimal. Presence of chloride may be an indication of pollution from sea water or industrial and domestic wastes. The mean Total Dissolved Solids values for both spring (198.00±103.40) and regular storage containers (196.00±107.27) were also within the WHO permissible limit. A household water quality survey by Ross et al.(2000) in Accomack , Northampton and Virginia respectively revealed that average TDS concentrations were 275 and 291mg/l for raw and tap water groups. The mean total hardness of both springs (72.50±9.57) and household storage containers (64.88±15.03) were within the WHO standard of drinking water and could be classified as moderately soft water. Although hard water is beneficial to health in reducing cardiovascular risk, however, high hardness causes scaling in pipes and water heaters or kettles. It also reacts with soap to form scum which decreases soap cleaning ability (Mechenich and Andrews, 2005)
CONCLUSION
The study revealed that:
Contamination of drinking water during storage in household vessels may contribute to disease transmission, and that improvement in the design of household water storage vessels coupled with water treatment before storage can reduce this risk. When source water quality is poor, safe water storage vessels alone cannot make water potable, but they can help to preserve water quality after treatment.
The presence of E. coli in their regular drinking water storage containers is as a result of faecal contamination which could be due to unhygienic water handling and practices. According to WHO specification, water fit for drinking should not contain E.coli. There is therefore a need for urgent attention.
There was poor water quality and inadequate water supply in the communities. Almost all the water samples were contaminated with coliforms. Poor water handling was found to be major source of contamination of stored water. This condition will increase the risk of transmission of water-borne diseases.
The cups and ladles introduced into the drinking water containers was also a factor that contributed to the contamination of drinking water. Proper hand washing agents could be effective in reducing the microbial flora from the hand. Although the special water vessel used in this study was well accepted and used for several months by all but two families due to leakages on the spigot, it was by itself not sufficient to improve water quality because the source water used to fill the vessels was contaminated. Water disinfection needs to be added at the household level.
This study has shown the need for adequate training of participants on water storage, handling and treatment.
RECOMMENDATIONS
- There should be proper water quality monitoring and adequate water supply by the ministry of water resources and Water Corporation to supplement inadequate supply from other sources.
- Water should be adequately treated at source and household level
- Use of storage facilities that will minimize contact with hands during collection should be encouraged.
- There should also be provision of adequate sanitary facilities such as toilets and potties for children.
- There should be regular training of participants on water storage, handling and treatment to ensure improvement in water quality.
- Non-Governmental Organizations (NGOs) and Philanthropist should assist in providing storage containers and treatment materials through financial and material donations especially in the low socio-economic zone where hygiene practices and sanitary conditions are poor.
REFERENCES
- Abadie, R.M.G. 2007. Re-assessing boiling as a means of treating drinking water: an analysis in relation to alternative available options. M.Sc. dissertation, London School of Hygiene & Tropical Medicine, London, UK.
- Ali, J. 1991. An Assessment of the water quality of Ogunpariver Ibadan, Nigeria. M.Sc. Dissertation. University of Ibadan, I badan, Nigeria
- American Public Health Association (APHA). 1998. American Water Works Association and Water Environment Federation. Standard Methods for the Examination of Water and Waste water. American Public Health Association, Washington, D.C.
- 1995. American Water Works Association and Water Environment Federation. Standard methods. 19th Edition. American Public Health Association, Washington, DC.
- Ankersmith, W. 1998. Water supply and sanitation in developing countries, Publicity materials division and International development department, social policy division (DS115B). Published by NEDA, Ministry of Foreign Affairs.
- Apantaku,S.O.,Apantaku,F.S.andUzo,C.S.A.1998.NigeriaInstituteofSciencesandTechnology.22ndProceedings1:156-157.
- Barua,D.andMerson,M.H.1992.Preventionandcontrolofcholera.In:BaruaD,GreenboughWB,eds.Cholera.2ndEd.NewYork,NY:PlenumMedicalBookCo;329-349
- Baroni, L., Cenci, L., Tettamanti, M. and Berati, M. 2007. Evaluating the environmental impact of various dietary patterns combined with different food production systems. European Journal of Clinical Nutrition61: 279-286.
- Blake, P. A., Ramos, S. and MacDonald, K. L., 1993. Pathogen-specific risk factors and protective factors for acute diarrhea disease in urban Brazilian infants. Journal of Infectious Disease: 167:627-632.
- Brick, T., Primrose, B., Chandrasekhar, R., Roy, S., Muliyil, J. and Kang, G. 2004. Water contamination in urban south India: household storage practices and their implications for water safety and enteric infections. International Journal of Environmental Health: 207: 1-8
- Cairncross, S., Blumenthal, U., Kolsky, P., Moraes, L., and Tayeh, A. 1996. Domestic hygiene and diarrhoea. The public and domestic Clean Water Act, section 502(14), S.C. § 1362 (14). CWA section 402(p), 33 U.S.C. § 1342(p)
- Camper, A. K. 2000. Biofilms in drinking water treatment and distribution. 1stAmsterdam; Harwood Academic Publishers. pp. 311-332.
- Clasen, T. F. and Bastable, A. 2003. Faecal contamination of drinking water during collection and household storage: the need to extend protection to the point of use, Journal of Water and Health 3; 109-155.