
Impact of Social Media Marketing on Customer Engagement in an Apparel Brand, Sri Lanka.
- W. Isuru Dananjana
- D. L. Isuri Yasara
- Nalin Abeysekera
- 968-987
- May 23, 2024
- Business Management
Impact of Social Media Marketing on Customer Engagement in an Apparel Brand, Sri Lanka.
W. Isuru Dananjana1, D. L. Isuri Yasara*2, Nalin Abeysekera3
1Mister., Institute of Chemistry Ceylon, Rajagiriya
2Miss., Institute of Chemistry Ceylon, Rajagiriya
3Professor, Dean, Faculty of Management Studies, Open University, Nawala, Sri Lanka
*Corresponding author
DOI: https://doi.org/10.51244/IJRSI.2024.1104069
Received: 20 April 2024; Accepted: 27 April 2024; Published: 23 May 2024
ABSTRACT
The fashion industry is highly competitive and ever-evolving to align with shifting customer trends, posing challenges for marketers. The widespread adoption of social media among customers has intensified this competition, offering new possibilities for marketers but also enhancing customer knowledge and influence. This study explores the impact of social media marketing on customer engagement in a Sri Lankan apparel brand. The data was obtained through an online questionnaire distributed randomly to customers of specific apparel brand following its social media sites. The statistical results indicated positive and significant correlations between Perceived Value, Percieved Quality, Service Quality, Surveillance, and Customer Engagement. The findings highlighted that social media marketing activities significantly increase customer engagement. Social media posts and activities have the potential to extend beyond immediate followers and influence sales suggesting the potential for increased sales through a broader reach. Therefore, companies should focus on maintaining the social media context and ensuring the quality of services, values, and trust of customers through social network sites. The findings of this study can be used in planning business strategies, marketing, and development plans in order of priority by following their resources, promoting customer engagement, and building and nurturing relationships with customers.
Keywords: Customer Engagement, Social Media Marketing, Perceived Value, Perceived Quality, Service Quality, Remuneration, Surveillance
INTRODUCTION
Social media has become a fundamental aspect of modern life and communication, connecting people through various technologies that facilitate the sharing of information and reducing the potential for market exploitation. These technologies include social networking sites, blogs, wikis, instant messaging, video-sharing sites, and more, which billions of people use to connect, learn, entertain, and broaden their knowledge. Additionally, professionals employ social media to develop their careers by connecting with others in their industry and expanding their knowledge base. At the company level, social media can provide a platform for communication with customers and receiving feedback, contributing to the company’s brand elevation (Muchardie, Yudiana, and Gunawan 2016). Social media has revolutionized conventional media by allowing marketing and advertising activities to take place on a platform. In today’s world, social media offers the opportunity to create a connection between brands and customers. The strategic utilization of social media marketing holds great significance for both customers and marketers.
Social media is regarded as an invaluable resource by customers and marketers and the use of social media has increased recently in Sri Lanka (SL). An estimated 7.4 million people in the nation are active social media users as of 2022, making up roughly 33% of the total population. The most widely used social media networks in SL are Instagram, YouTube, WhatsApp, and Facebook. Individuals, companies, and organizations use these platforms extensively for marketing, communication, and information sharing. The growth of social media in SL has had a significant impact on the way people interact and consume content, and it has become an integral part of the country’s digital landscape[1]
Facebook is particularly popular for customer engagement in Sri Lanka, with many businesses setting up dedicated pages to interact with their customers. These pages allow businesses to share information about their products or services, post updates and promotions, and respond to customer inquiries and feedback. Facebook also offers advertising options that businesses can use to target specific audiences based on factors like age, location, and interests. Instagram is also gaining popularity for customer engagement in Sri Lanka, especially among the younger age groups. It is a popular platform for businesses to share visually appealing content that highlights the products or services they offer. Businesses can creatively connect with their audience and enhance brand promotion through Instagram’s features like Stories and Reels. Overall, Facebook and Instagram are effective channels for customer engagement in Sri Lanka, and businesses that leverage these platforms can create meaningful connections with their audience and drive growth for their brand.
When talking about the fashion industry, brands can attract new followers and gain visibility among potential customers through social media. Social media allows fashion brands to communicate directly with their customers, whether through comments, direct messages, or live chats. This provides an opportunity to gather feedback, answer questions, and build a relationship with customers. Many fashion brands in Sri Lanka use social media influencers to extend their product reach to a broader audience. Influencers can help to create buzz around a brand and provide social proof that can help to increase sales. With the rise of social commerce, fashion brands can now sell their products directly through social media platforms. This eliminates the need for customers to visit a physical store or e-commerce website to make a purchase, making it easier for brands to reach customers and generate sales.
This chosen apparel brand stands as a prominent active and lifestyle clothing label in Sri Lanka. Their diverse product range encompasses T-shirts, leggings, high-quality joggers, graphic tees, shorts, vests, athletic accessories, innerwear, and more. Originating as an online store, it swiftly gained popularity among Sri Lankans as one of the few well-known brands. Notably, the rapid growth—from an online store to a flagship location is attributed to its effective utilization of Facebook and Instagram as primary social media platforms.
Research Problem
Social media marketing is the practice of promoting and directing traffic to your website using platforms like Facebook, Threads, Instagram, TikTok, Twitter, YouTube, Blogs, LinkedIn, etc. These avenues serve as effective tools for businesses to both attract new customers and maintain relationships with existing ones. Despite challenges faced by Sri Lankan companies in achieving successful results, Facebook remains the primary social media platform for businesses in the country. (Dmr 2019) As the count of mobile broadband and fixed Internet connections continues to rise, an increasing number of Sri Lankan businesses are putting resources into social media marketing. This trend is fueled by the presence of over 23 million mobile connections in Sri Lanka, with a social media user base exceeding 4.5 million among the over 5 million registered internet users. With a growing population spending more time on their mobile devices, both small and large enterprises are recognizing the opportunities presented by social media marketing in Sri Lanka. Researchers, such as van Doorn et al. (2010), emphasize the importance of exploring the interaction and evaluation of channels employed in customer engagement as a crucial aspect for future research. Vivek et al. (2012), suggest the evaluation of a commitment scale in different contexts to better understand the dynamics of engagement. However, there is a gap in understanding how social media platforms engage with brands and their supporters, as well as the behavioral outcomes linked to a brand’s profile. Existing literature on participation and relationship marketing is mostly confined to consumer product transactions, with limited exploration into the potential involvement of consumers interacting with an online brand. (Vivek, Beatty, and Morgan 2012)
There is a need for more research to gain a comprehensive understanding of the interaction between brands and social media users. The existing gap in marketing practices involves the proactive management of online brand engagement, and additional empirical studies are necessary to understand how online marketing strategies, particularly those involving social media, can be employed to actively engage consumers and boost brand promotion. In conclusion, there is a need for a deeper understanding of the functioning of online marketing strategies and their impact on consumer engagement.(Dmr 2019; Hollebeek and Chen 2014) Therefore, this study questions whether social media marketing through platforms, such as Facebook and Instagram, significantly increases customer engagement in an apparel brand SL.
Research Objectives
This study aims:
- To investigate the impact of social media marketing practices on customer engagement in an apparel brand SL.
- To analyze the demographic features of customers engaged through social media networks.
- To determine the effect of independent variables such as perceived value, perceived quality, service quality, remuneration, and surveillance on the dependent variable, customer engagement.
Theoretical Background
Social Media Marketing
Social media originated from the World Wide Web as an online service that facilitates the sharing of user-generated content. (Chen, Hou, and Zhao 2016) Computer-based technology that shares information, ideas, and thoughts through online networks and communities, is referred to as “Social Media”. Constantinides & Fountain (2008) identified social media as social networks, content communities, blogs, and forums, naming it as Web 2.0. Kaplan & Haenlein (2010) described social media as “a community of internet-based applications that build on Web 2.0’s political and technological foundations, enabling user-generated content to be produced and shared.” Social media marketing is the process of advertising goods and services via different online social media platforms. This sort of marketing involves sharing content online, blogging, and posting pictures (Yazdanparast, Joseph, and Muniz 2016) and various platforms, applications, and tools that enable the connection and communication of customers with each other. (Pinto and Yagnik 2017)
Marketing is an important factor in crucial business decisions considering public relations, brand development, product innovation, communications, pricing strategies, creative direction, customer relationship management, etc. Social media platforms provide an interactive and constantly updated space for active social involvement, unlike traditional media where viewers are passive recipients. As a result, social media has transformed the way information is transmitted and received. (Austin and Jin 2017; Cunningham and Craig 2019; Shabbir and Qiu 2023) Social media networks serve as an excellent platform for product and brand-related advocacy, enabling clients to create content and customer product innovations. These features have changed users from passive viewers to active participants. (Mohammed,2020.) Social media is now widely acknowledged as a useful tool for helping companies and enterprises meet their marketing goals and strategies, particularly in areas like customer relationship management, collaboration, and consumer engagement. (Jacinto et al. 2021)
Involvement, commitment, passion, enthusiasm, focused effort, zeal, dedication, and energy are common definitions of engagement. Similar to this, the Merriam-Webster dictionary defines the state of being engaged as “being in gear” and “emotional involvement or commitment.” (Truss et al. 2013) Customer engagement is a relatively new concept that emerged in the digital era. A company builds relationships with its customer base through customer engagement, which promotes brand awareness and loyalty. This can be accomplished via marketing campaigns, new content created for and posted to websites, and outreach via social media and mobile and wearable devices, among other methods. It is proposed that in interactive and dynamic business landscapes, prioritizing customer engagement becomes a strategic necessity to drive improved corporate performance, such as sales expansion, a stronger competitive advantage, and profitability (Brodie et al. 2011)
These claims are supported by the argument that loyal consumers are essential to viral marketing campaigns because they recommend and/or refer particular goods, services, and/or brands to others. The creation of new goods and services can also benefit greatly from the involvement of engaged consumers. (Hoyer et al. 2010) Customer engagement extends beyond mere purchase behavior, as indicated by van Doorn et al. (2010). It is demonstrated through the sustained use of social media and is anticipated to take place when customers hold a favorable attitude toward social media. (Hussein and Hassan 2017)
Relationship Between Social Media Marketing and Customer Engagement
The combination of social media marketing and customer engagement has rarely been explored in marketing literature. Loyalty to social networking sites contributes to the cultivation of relationships. The active participation of users on a brand’s social media platforms, including sharing content about the brand and its products, expressing both support and criticism and engaging in knowledge exchange with their social connections, has a direct positive impact on the business and benefits other customers. Marketing relationships include the relationships established between buyers and sellers, potential and real customers, other consumers, society as a whole, and sellers. Social media platforms provide incentives that promote engagement and foster relationships between people and brands based on mutual respect, trust, and loyalty, whether or not users become customers. (Vivek, Beatty, and Morgan 2012)
Customer engagement can be assessed by customer satisfaction, customer trust, customer involvement, customer commitment, customer retention, purchase intention, etc. (Vinerean and Opreana 2021) Customer satisfaction serves as an effective catalyst for normative behavior based on exchange, while attachment represents a psychologically active state that engages in beneficial activities. (Ray, Kim, and Morris 2014) Consequently, long-term customer behavior is often influenced fundamentally by their satisfaction. (Oliver 2018) The cornerstone of interactions between individuals and businesses lies in customer trust (Hsu et al. 2007; van Tonder and Petzer 2018) Trust plays a crucial role in dealings between stakeholders, especially when customers are expected to make payments for services they have not yet received or experienced. Moorman, Deshpandé, and Zaltman 2018; Morgan and Hunt 2018 have defined trust as the willingness to depend on an exchange partner that instills confidence.
Factors Influencing Customer Engagement
Researchers have stated many factors influencing customer engagement. According to existing literature, those people who are fans of brands will tend to like and adore the content posted by their favorite brands on social media such as by reacting (liking), sharing, and commenting (Araujo and Neijens 2012; Lin and Lu 2011a; Ruiz-Mafe, Martí-Parreño, and Sanz-Blas 2014). Vividness (Coyle and Thorson 2013; Fortin and Dholakia 2005), description of a product (Coyle and Thorson 2013; De Vries, Gensler, and Leeflang 2012a), interactivity (Fortin and Dholakia 2005; Liu and Shrum 2013), Entertainment (Lin & Lu, 2011b; Sledgianowski, D., & Kulviwat, S., 2009), , surveillance, remuneration (Mohammed, 2020), content novelty (Mendelson 2001), perceived value (Parasuraman 1997) and Product/Service Quality (Kalla, Sharma, and Sondhi 2017; Krishnamoorthy, Karthikeyan, and Prakash 2016) are some factors reported in the literature, that influence the customer engagement through social media platforms.
Following is an explanation of the variables that will be studied in this research.
Perceived value is the comprehensive assessment made by the customer regarding the usefulness or benefits they receive from a product or service in exchange for what they have paid (Zeithaml 1988). Hollebeek (2013) recognized perceived value as a critical element in establishing long-term relationships. The success or failure of a business hinges on how well perceived value is integrated with customer engagement. Previous research in mobile commerce has shown that perceived value has a strong impact on user satisfaction (Lin and Wang 2006). In addition, studies have also found that the perceived value of online platforms can significantly affect user satisfaction (Carlson et al. 2015). Some researchers have also focused on the social aspect of consumption and have suggested that social value plays a role in explaining user behavior in information systems (Rintamäki et al. 2006). Several research studies have used brand perceived value as a mediator to indirectly influence customer satisfaction or purchase intention on social media platforms (S. C. Chen & Lin, 2019; Gan & Wang, 2017; Prebensen & Xie, 2017).
H1: Perceived Value from social media networks significantly increases Customer Engagement in an Apparel Brand.
Perceived quality is the way customers assess the quality of a product or service, shaped by their expectations, perceptions, and actual experiences. It is an important factor in customer engagement as it can influence their level of satisfaction, loyalty, and willingness to engage with the brand. Customers are more likely to engage with brands that offer high-quality products or services that meet or exceed their expectations. Therefore, perceived quality can be seen as a key driver of customer engagement in marketing relationships. According to Ahire et al. (1996) product quality is determined by customers’ evaluations of the actual quality in comparison to their expectations, particularly concerning performance, reliability, durability, and suitability. Yang et al. (2015) suggest that while positive perceptions of product quality may initiate brand engagement, long-term engagement is important for overall customer engagement. Quality generally is a factor contributing to the establishment of competitive advantage through enhancements in quality performance and customer satisfaction. (Benson, Saraph, and Schroeder 1991). van Tonder and Petzer (2018) show a direct relationship between perceived product quality and customer engagement, indicating that higher perceived product quality leads to greater customer engagement.
H2: Percieved Quality obtained through social media networks significantly increases Customer Engagement in an Apparel Brand.
For businesses, offering qualified service, accurate information, and customer satisfaction are all parts of providing high-quality customer service. From the customer’s perspective, service quality is measured by their level of satisfaction during the consumption of products or services offered by businesses. Customers experience the benefits and value provided by the supplier, leading to contentment with their expected needs being met in proportion to the costs incurred in the consumption of the product or service. In service marketing, the connection between customer engagement and service quality has been investigated. Numerous research studies have indicated that customer engagement is significantly impacted by service quality, with different levels. (Kalla, Sharma, and Sondhi 2017; Krishnamoorthy, Karthikeyan, and Prakash 2016). According to Pathak et al. (2018) behavioral intention, overall satisfaction, and overall service quality are primarily determined by service quality.
H3: Service Quality obtained through social media networks significantly increases Customer Engagement in an Apparel Brand.
Remuneration refers to the rewards or compensation that consumers may receive for their engagement with a brand or its content on social media. This could involve monetary incentives like coupons or discounts or social incentives like status or recognition. (Adapa et al. 2018). Some studies have found that remuneration can be a motivating factor for engagement. According to Rohm et al. (2013), brands are now placing greater emphasis on using incentives and promotions as a strategic approach on social media platforms. Enginkaya & Yılmaz, 2014 discovered that the desire for economic incentives played a significant role in determining customer engagement with a brand. However, Muntinga et al. (2011) found that while consumers expect some compensation for engaging with brand-related content online, offering remuneration was linked to reduced engagement levels. In contrast, Vale & Fernandes (2018) discovered that providing compensation was linked to higher levels of engagement, as demonstrated by users’ contributions and content production on sports Facebook pages. Rachmah & Mayangsari, (2020) have found out that remuneration posts boost customer engagement in the fashion industry.
H4: Remuneration through social media networks significantly increases Customer Engagement in an Apparel Brand.
Surveillance
Surveillance refers to the practice of monitoring and collecting information about consumers’ behavior, preferences, and interactions with a brand or its content on social media. This may include tracking users’ online activity, collecting data on their demographics and interests, and analyzing their engagement patterns to inform marketing strategies and improve customer experience (Kumar et al. 2010). Brodie et al. (2013) suggest that social media satisfies consumers’ information needs. The availability of information on social media has created opportunities for surveillance and engagement. Humphreys & Wilken 2015). Posting brand content that contains the latest information not only contributes to the knowledge of followers but also encourages interaction and responses (Pletikosa Cvijikj and Michahelles 2013; De Vries, Gensler, and Leeflang 2012b).
H5: Surveillance of social media networks significantly increases Customer Engagement in an Apparel Brand.
H6: Social Media Marketing activities significantly increase Customer Engagement in an Apparel Brand.
The following conceptual model represented in Figure 1 summarizes the theoretical background and the hypotheses for this study.
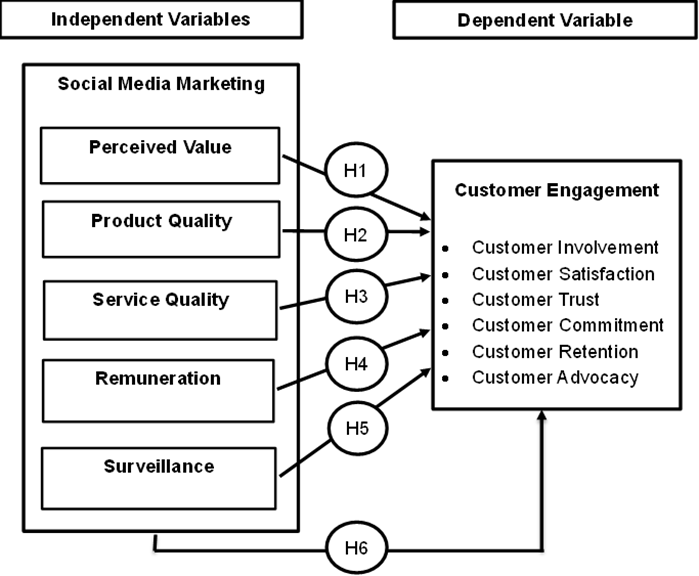
Figure 1. Conceptual Framework of the Study
Notes: The conceptual framework in Figure 1 is generated with the support of a literature review and the hypotheses of this study by the author.
METHODOLOGY
Research Approach and Design
The purpose of this research is to examine the impact of social media in enhancing customer engagement in an Apparel Brand clothing brand SL. The impact of social media includes social media network site following, usage frequency, perceived value, and quality through social media brand pages, service quality, etc. These factors have a significant impact on customer engagement and can influence their purchasing decisions, satisfaction levels, and attitudes toward products, brands, or companies. Therefore, they can provide valuable insights for developing strategies to improve customer engagement using social media.
A descriptive research design and quantitative approach were used to explore the role of social media in enhancing customer engagement. The descriptive research design is ideal for understanding the characteristics of the phenomenon being studied, which in this case is social media activities among customers. It allows for the collection of data on the demographic segment and accurately describes customers’ views or perceptions. The quantitative approach was selected to collect data from the target population and answer the research questions. Primary data collected through a survey questionnaire was used to interpret the results. The use of survey methods necessitated the descriptive research design due to the large sample size. The collected data will be analyzed to achieve the study’s objectives and answer the research questions.
The primary data was collected using a survey tool. A descriptive survey using an online questionnaire was employed to collect primary data to examine the role of social media on customer engagement. The questionnaire consisted of three parts. The first part of the questionnaire contained questions about the demographic profiles of the customers and the second part of the questionnaire consisted of questions representing items to assess independent variables which are perceived value, perceived quality, service quality, remuneration, and surveillance received through social media pages. The third part of the questionnaire consisted of questions to assess the dependent variable customer engagement. A 5-point Likert scale questionnaire which provides a range from strongly disagree to strongly agree was used to measure the impact between variables. The target population for the study is comprised of customers of the selected apparel brand, who are following at least one of its social media pages (Facebook/Instagram). The time horizon used was cross-sectional. A convenience sampling technique was employed in this study.
Data Collection and Analysis
Social media has a qualitative impact on consumer engagement. Therefore, a five-point Likert scale, ranging from strongly disagree to strongly agree, was used to record the answers to these qualitative questions. Initially, ten participants participated in a pilot test of the questionnaire. Then the questionnaire was constructed as a Google form and it was randomly distributed among various age groups, in different parts of the countries, through online surfaces including email, WhatsApp, and Facebook. Responses were collected for a week. A total of 140 acceptable responses were chosen for the data analysis.
The survey data was transferred to Excel Spreadsheets and subsequently exported to IBM SPSS version 26 for analysis and visualization. Statistical analysis and interpretations were made using the IBM SPSS statistics software. Multiple Regression was used to evaluate the hypothesis constructed to investigate the impact of social media marketing on customer engagement. A reliability test using Cronbach’s Alpha and a factor analysis using KMO Bartlett’s test were used to evaluate the measurement model.
RESULTS AND DISCUSSION
Survey Demographics
A total number of 200 participants (63% male, 37% female) participated in the survey. This shows that there is a greater tendency to engage male customers in in an Apparel Brand through social media. Age demographics of the survey participants (72.1% 18-25 years, 16.4% 26-30 years, 4.3% <18 years, 3.6% 31-35 years, 2.1% 36-40 years, 1.4% >40 years) demonstrate that most of the participants in the study were born between the years 1998-2005. This age group is considered to be the driving force of the young generation due to their high energy levels and the fact that they are starting to earn their own money. The research indicates that nearly three-fourths of the survey respondents fall into this age bracket, suggesting that young adults between 18-25 are more likely to interact through social media networks. The age group below 18 years old is an energetic and youthful customer segment who enjoys discovering new things and is receptive to novel experiences. However, since they are not yet self-sufficient, their financial capability is limited. The research indicates that only a small proportion of this age group participated in the survey. The age group between 26 to 30 years old is the second-largest group of survey participants. They are financially independent and belong to the early days of social media. Customers aged 31 to 40 are most likely to have financial independence and stay abreast of technology and trends, although not to the same extent as the younger age groups. In contrast, customers above 40 years old may not be as interested in selected apparel brand products since they are less likely to use fashionable sportswear and did not grow up during the social media era. Consequently, they spend less time on social media networks. The variation in generational demographics among the respondents may be due to the timing of the introduction of social media apps or technologies. For instance, individuals aged 18 to 30, who grew up with the internet and social media, play a crucial role in this research.
Monthly income of the survey participants (<20,000 LKR 56.6%, 20,000 – 50,000 LKR 21.2%, 50,000 – 100,000 LKR 14.2%, 100,000 – 200,000 LKR 4.4%, >200,000 3.5%) showed that most of the respondents with an income above 100,000 LKR belonged to the age group above 30 years. Additionally, the majority of the age group between 18-25 years had a monthly income below 20,000 LKR. The social media platforms employed by this apparel brand for marketing and business purposes are Facebook and Instagram. A substantial number of participants (Facebook & Instagram 42.8%, Instagram Only 40.7%, Facebook Only 16.4%) use both Facebook and Instagram and have a significant impact on customer engagement. However, Instagram has a higher usage rate among participants compared to Facebook, suggesting that customer engagement is more widespread on Instagram. The results of the social media usage time of the respondents (Thrice a week 37.1%, Monthly 26.4%, Daily 15%, Hourly 5.0%) show that many respondents visit the sites three times a week. These results indicate that a significant portion of the study participants spend a considerable amount of time on social media, which is important for this study as it investigates the impact of social media marketing activities on customer engagement. This group of participants can be considered heavy social media users who have been exposed to various products advertised or sold on social media platforms. Preferred details by customers in social media network sites of the apparel brand (Discounts/Offers/Deals 68.2%, Product Purchase 42.5%, Events/Community Services 23.0%, Other 17.7%, Celebrity Engagements 15.9%, Games 11.5%) demonstrate a significant percentage of respondents on discounts, offers, and deals. The second highest percentage of respondents reported that they use social media to make product purchases. A considerable percentage of respondents also showed interest in celebrity engagement and obtaining information on celebrity models.
Reliability Analysis
The internal consistency of the data gathered using the questionnaire was tested using reliability analysis, and the degree of consistency was tested using Cronbach Alpha.
Table 1. Results of the Reliability Test.
| Constructs | No. of Items | Cronbach Alpha |
| Perceived Value | 4 | 0.797 |
| Percieved Quality | 3 | 0.890 |
| Service Quality | 2 | 0.870 |
| Remuneration | 2 | 0.783 |
| Surveillance | 3 | 0.816 |
| Customer Engagement | 6 | 0.918 |
Notes: Table 1 was developed by the author from the obtained survey data and presents the results of the reliability analysis.
The threshold value of Cronbach’s alpha is 0.7 and values above 0.6 are also accepted (van Griethuijsen et al. 2014; Pallant 2020). As Table 1 shows, the Cronbach Alpha values obtained for all items were greater than the threshold value which is 0.7. Therefore, it can be inferred that the items effectively measure the specified constructs and variables, making them suitable for further analyses. The positive Cronbach’s alpha values suggest a high level of internal consistency, indicating high reliability in the data obtained from the survey participants.
Factor Analysis
The internal validity of a study is based on its research design, while the external validity is based on how well the sampling techniques used in the study allow the research results to be generalized to the larger population. (Creswell, 2009; Rubin & Babbie, 2011) Validity assesses how accurately a questionnaire measures the targeted concept in a study. In this research, the Kaiser-Meyer-Olkin (KMO) and Bartlett’s Test were employed to examine whether the data collection instrument, specifically the questionnaire, precisely measures the intended concept. A higher KMO value suggests that factor analysis is a better fit for the data where values below 0.5 are not acceptable, and values closer to 1.0 are ideal.[2] The coefficient KMO > 0.5 shows that the factor analysis is consistent with the research data (see Table 2).
Table 2. Results of the KMO and Bartlett’s Test.
| Constructs | KMO Measure of Sampling Adequacy | Bartlett’s Test of Sphericity – Significant level |
| Perceived Value | 0.727 | 0.000 |
| Perceived Quality | 0.747 | 0.000 |
| Service Quality | 0.500 | 0.000 |
| Remuneration | 0.500 | 0.003 |
| Surveillance | 0.706 | 0.000 |
| Customer Engagement | 0.898 | 0.000 |
Notes: Table 2 was developed by the author from the obtained survey data and presents the results of the factor analysis.
Bartlett’s test of Sphericity was utilized in this research to examine whether the correlation matrix of the observed variables is significantly different from an identity matrix. If the statistical test shows a significant result, usually less than 0.05, it means that the correlation matrix is not an identity matrix, and there are significant correlations among the variables. [3] Bartlett’s Test: Sig. = 0.000 < 0.05 indicating that the observed variables in the factor analysis have an overall correlation with each other (see Table 2).
Correlation Analysis
Correlation analysis can reveal significant relationships between various metrics or groups of metrics can be identified, providing new insights, and revealing interdependencies even if the metrics are from different business areas.[4] One objective of this study was to examine the correlation between the independent variables which are Perceived Value (PV), Perceived Quality (PQ), Service Quality (SQ), Remuneration (RM), and Surveillance (SV), and the dependent variable, which is Customer Engagement (CE). In addition, the correlation between customer engagement and social media marketing, considering all independent variables (SMM) together, was examined. In this study, since there was more than 1 independent variable, a bivariate Pearson Correlation Test was performed (see Table 3).
Table 3. Correlation between the Independent Variables and Dependent Variable.
| PV | PQ | SQ | RM | SV | SMM | CE | ||
| PV | Pearson Correlation | 1 | .807** | .394** | .427** | .776** | .846** | .828** |
| Sig. (2-tailed) | .000 | .000 | .000 | .000 | .000 | .000 | ||
| N | 140 | 140 | 140 | 140 | 140 | 140 | 140 | |
| PQ | Pearson Correlation | .807** | 1 | .363** | .401** | .794** | .841** | .873** |
| Sig. (2-tailed) | .000 | .000 | .000 | .000 | .000 | .000 | ||
| N | 140 | 140 | 140 | 140 | 140 | 140 | 140 | |
| SQ | Pearson Correlation | .394** | .363** | 1 | .649** | .382** | .712** | .328** |
| Sig. (2-tailed) | .000 | .000 | .000 | .000 | .000 | .000 | ||
| N | 140 | 140 | 140 | 140 | 140 | 140 | 140 | |
| RM | Pearson Correlation | .427** | .401** | .649** | 1 | .442** | .740** | .419** |
| Sig. (2-tailed) | .000 | .000 | .000 | .000 | .000 | .000 | ||
| N | 140 | 140 | 140 | 140 | 140 | 140 | 140 | |
| SV | Pearson Correlation | .776** | .794** | .382** | .442** | 1 | .844** | .893** |
| Sig. (2-tailed) | .000 | .000 | .000 | .000 | .000 | .000 | ||
| N | 140 | 140 | 140 | 140 | 140 | 140 | 140 | |
| SMM | Pearson Correlation | .846** | .841** | .712** | .740** | .844** | 1 | .831** |
| Sig. (2-tailed) | .000 | .000 | .000 | .000 | .000 | .000 | ||
| N | 140 | 140 | 140 | 140 | 140 | 140 | 140 | |
| CE | Pearson Correlation | .828** | .873** | .328** | .419** | .893** | .831** | 1 |
| Sig. (2-tailed) | .000 | .000 | .000 | .000 | .000 | .000 | ||
| N | 140 | 140 | 140 | 140 | 140 | 140 | 140 | |
**p < .01.
Notes: Table 3 was developed by the author from the obtained survey data and presents the results of the correlation analysis (“PV” = Perceived Value, “PQ” = Perceived Quality, “SQ” = Service Quality, “RM” = Remuneration, “SV” = Surveillance, “CE” = Customer Engagement, “SMM”= Social Media Marketing)
According to the above results, Pearson’s (bivariate correlation) analysis shows a positive correlation between all independent variables including, Perceived Value (PV), Perceived Quality (PQ), Service Quality (SQ), Remuneration (RM), and Surveillance (SV) with the dependent variable Customer Engagement (CE). The correlation is significant at the 0.01 level, for all variables. Furthermore, the overall impact of Social Media Marketing (SMM) demonstrates a positive correlation with customer engagement, and this correlation holds statistical significance at the 0.01 level. The significant connection between social media marketing and customer engagement is evidenced by a strong correlation coefficient of 0.831 (see Table 3).
The independent variables of surveillance, perceived quality, and perceived value show a strong correlation with the dependent variable, with slightly varied coefficients of 0.893, 0.873, and 0.828, respectively. Among these variables, surveillance exhibits the highest correlation. On the other hand, remuneration has a relatively low correlation (0.419) with customer engagement, while service quality demonstrates the least correlation (0.328) with customer engagement. The positive correlation coefficient suggests that social media marketing and customer engagement are positively correlated. This suggests that if social media marketing increases, customer engagement also tends to increase, and vice versa. The magnitude of the association between social media marketing and customer engagement is very high (| r | >0 .4) (see Table 3). The observed close correlation aligns with expectations in the research, as it is the strong linear relationships among variables that elucidate the impact of factors in the research model. Consequently, all these independent variables can be incorporated into the regression analysis.
Regression Analysis
An analysis of variance (ANOVA) was carried out to examine the variation between groups and determine the significance of the impact of social media marketing on customer engagement. The results of hypothesis testing were derived through the execution of the ANOVA test.
Table 4. Model Summary of Regression Analysis
| Model | R | R Square | Adjusted R Square | Std. Error of the Estimate |
| 1 | .939a | .883 | .878 | .25702 |
aPredictors: (Constant), SV, SQ, RM, PV, PQ.
Notes: Table 4 was developed by the author from the obtained survey data and presents the results of the model summary of regression analysis.
The R-value denotes a strong correlation, with a value of approximately 94% (see Table 4). This indicates a high level of correlation between social media marketing and customer engagement. The R-square value indicates the proportion of variance in the dependent variable (customer engagement) that can be accounted for by the independent variable (social media marketing). The regression model in this study revealed an adjusted R-square value of 0.883, which means that 88.3% of the variation in customer engagement can be explained by the independent variables in the model. This percentage is considered a high level of goodness-of-fit in theory. While a high R-squared value is generally desirable in regression analysis, it is important to note that customer engagement involves complex psychological processes and is therefore more difficult to predict accurately. Therefore, a lower R-squared value is not necessarily a negative outcome.
Table 5. ANOVA Table of Regression Analysis for Independent Variables
| Model | Sum of Squares | df | Mean Square | F | Sig. | |
| 1 | Regression | 66.509 | 5 | 13.302 | 201.364 | .000b |
| Residual | 8.852 | 134 | .066 | |||
| Total | 75.360 | 139 | ||||
aDependent Variable: CE
bPredictors: (Constant), SV, SQ, RM, PV, PQ.
Notes: Table 5 was developed by the author from the obtained survey data and presents the results of the ANOVA test of regression analysis.
The F-ratio, which compares two mean square values, serves as an indicator of whether the variation among group means exceeds what would be expected by chance. A higher F-ratio indicates a more pronounced relationship between the variables. In this study, the F-value of 201.364, with 5 and 134 degrees of freedom (df), and a probability of occurrence by chance of less than 0.001 (F = 201.364, P < 0.001), indicates a statistically significant relationship between social media marketing and customer engagement (see Table 5). Consequently, the findings suggest that social media marketing positively and significantly influences the enhancement of customer engagement.
Table 6. Coefficients Table of Regression Analysis for Independent Variables
| Model | Unstandardized Coefficients | Standardized Coefficients | t | Sig. | ||
| B | Std. Error | Beta | ||||
| 1 | (Constant) | -.160 | .141 | -1.136 | .258 | |
| PV | .195 | .059 | .180 | 3.292 | .001 | |
| PQ | .344 | .054 | .357 | 6.348 | .000 | |
| SQ | -.079 | .038 | -.083 | -2.097 | .038 | |
| RM | .038 | .040 | .038 | .947 | .346 | |
| SV | .524 | .058 | .485 | 9.094 | .000 | |
aDependent Variable: CE
Notes: Table 6 was developed by the author from the obtained survey data and presents the results of the coefficients of regression analysis.
The constant “B” value, which is -0.160 in this case (see Table 6), indicates the expression of the dependent variable when there are no independent variables considered. Hence, it implies that in the absence of the independent variables, customer engagement is influenced by a factor of minus 0.160. The corresponding “B” values for the independent variables (perceived value, perceived quality, service quality, surveillance, and remuneration) depict how each of these factors can impact the dependent variable, which is customer engagement (CE). The independent variable surveillance has the highest B value, indicating that it has the most significant impact on customer engagement. Conversely, the independent variable service quality has the lowest B value, suggesting that it has the least influence on customer engagement. When the value of “Constant sig” is less than 0.05, it indicates a good result. In this case, the obtained value is 0.001, which is considered good.
The results of the regression can be presented in mathematical form as follows:
Only the variable remuneration is not statistically significant (sig. > 0.05). All other variables including perceived value, perceived quality, service quality, and surveillance are statistically significant (sig. < 0.05). When the significance level is less than 0.05, the null hypothesis is not accepted, while if it is greater than 0.05, the null hypothesis is accepted, indicating no statistically significant impact. Hence, hypotheses H1, H2, H3, and H5 are accepted while hypothesis H4 is not accepted.
Bai et al., 2016 have also shown that customers’ perceived value increases customer engagement in Chinese online clothing brands. Aakko & Niinimäki (2022) have shown that perceived quality and product quality increase customer engagement and purchase intention of garments. Service quality has increased customer satisfaction, and thus has increased customer engagement in retail clothing company in Malaysia (Chan and Goh 2019). The findings of Gupta et al. (2020) revealed that the interactivity of the communication medium used, release dates by brands, brand reviews, and comments, and website design and interface were major factors influencing customer engagement in the online clothing sector. Hoang et al. (2022) have shown that increased customer engagement due to surveillance in the luxury fashion industry. The results of this study were also confirmed and in line with previous studies.
Another regression analysis was conducted by considering all independent variables under the comprehensive variable of “social media marketing.”
Table 7. ANOVA Table of Regression Analysis for Social Media Marketing
| Model | Sum of Squares | df | Mean Square | F | Sig. | |
| 1 | Regression | 52.048 | 1 | 52.048 | 308.103 | .000b |
| Residual | 23.312 | 138 | .169 | |||
| Total | 75.360 | 139 | ||||
aDependent Variable: CE
bPredictors: (Constant), SMM
Notes: Table 7 was developed by the author from the obtained survey data and presents the results of the ANOVA of regression analysis.
Table 8. Coefficients Table of Regression Analysis for Social Media Marketing
| Model | Unstandardized Coefficients | Standardized Coefficients | t | Sig. | ||
| B | Std. Error | Beta | ||||
| 1 | (Constant) | -.198 | .222 | -.890 | .375 | |
| SMM | 1.058 | .060 | .831 | 17.553 | .000 | |
Dependent Variable: CE
Notes: Table 8 was developed by the author from the obtained survey data and presents the results of the Coefficients of regression analysis.
The constant B value from the findings (see Table 7) suggests that in the absence of social media marketing, customer engagement is influenced by a factor of -0.198. Notably, the variable Social Media Marketing exhibits the highest B value, suggesting a significant positive impact on customer engagement. This is evidenced by a significance level of less than 0.05, and hence hypothesis H6 is accepted. The regression results can be expressed in mathematical form as follows:
In summary, based on the results of the regression analysis (see Table 4 and Table 5), it is concluded that 4 factors can significantly increase customer engagement in the apparel brand. Those factors are perceived value, perceived quality, service quality, and surveillance. Among them, surveillance has the greatest impact on customer engagement with a regression coefficient of 0.524, and the factor with the smallest impact is service quality with a regression coefficient of -0.079. Social media marketing as a whole significantly increases customer engagement and has a regression coefficient of 1.058 indicating a huge impact on customer engagement.
CONCLUSION
The present study aimed to investigate the influence of social media on customer engagement in an apparel brand SL. The study examined various factors affecting social media marketing strategies that can enhance customer engagement, such as perceived value, perceived quality, service quality, remuneration, and surveillance. The study found that social media marketing activities have a significant positive impact on customer engagement in the respective brand, with all independent variables showing a positive correlation at a significant level of 0.01. Therefore, it can be concluded that there is a positive relationship between social media marketing activities and customer engagement. The testing of hypotheses showed that all of the variables including perceived value, perceived quality, service quality, surveillance, and social media marketing as a whole, except remuneration, significantly increase customer engagement.
The speed of interaction with the brand, as well as the user-friendly interface and flexibility of its social network sites, determine the perceived value through social media and significantly affect customer engagement. Providing quality and up-to-date information, promptly attending to customer inquiries and feedback through social media sites, and offering prize drawings, discounts, giveaways, and customized items also increase customer engagement. These social media activities play a crucial role in influencing customer engagement and can impact their attitudes and decisions toward certain products, brands, or companies. Thus, they can provide valuable insights on strategies for enhancing customer engagement through social media. This study provides evidence-based findings that demonstrate the role of social media in customer engagement.
Managerial Implications
Buyers consider both the price they pay and the quality of the product or service they receive when making a purchase. However, the perceived value of the same product or service can vary from customer to customer due to their individual attitudes and experiences. The level of customer engagement can also influence their perception of value. Emotions can also affect how customers view the benefits they receive from a service. Thus, stronger customer engagement leads to a higher perceived value of the brand. It is important for businesses to focus on increasing their customers’ perceived value.
Providing customers with high-quality products and services along with a positive user experience is crucial for their satisfaction. Customers who are willing to make an effort to buy a brand tend to be more satisfied with it. The level of customer satisfaction determines whether they will have a positive or negative perception of the company and whether they will continue doing business with it. If a business consistently offers good service quality and a positive experience to customers, it can create a stable and active mental state in customers, which is referred to as a cognitive component of customer engagement.
Although there have been improvements in the availability of information, customers still feel vulnerable when companies refer instead of resolving complaints related to product quality. When customers are more engaged, they are more likely to have greater trust in the emotional security of meeting tangibles, safety, and trust. This shifts the focus to future conditions, and customers want to perceive the service provider as trustworthy and believe that they will continue to maintain that trust in the future.
RECOMMENDATIONS & FUTURE SCOPE
Based on the research findings, the study offers several recommendations to improve customer satisfaction and engagement through social media. One key priority is to focus on improving social response time, as it has been found to have a significant positive impact on customer satisfaction. Additionally, it is suggested that online retailers or companies should regularly post on social media platforms and ensure clear, appropriate, and polite language when responding to customers’ queries. These practices can contribute to enhancing customer satisfaction and trust, while also fostering increased customer engagement on social media platforms. By consistently posting and actively responding to customers, companies can create a positive and engaging online presence that encourages customer interaction and loyalty.
The study proposes several areas for further research about social media marketing and customer engagement. Firstly, it suggests using a larger sample size and incorporating more variables to effectively test and predict the influence of social media marketing on customer engagement. Additionally, it recommends assessing different social media pages individually to understand user motivations and explore how they contribute to unique engagement with the brand. The study also suggests exploring alternative sampling techniques, such as consequence sampling, to enhance the sampling process. Furthermore, it highlights the need to study the effects of social media activities on customer behavior and engagement. Investigating the impact of social media on customer attitudes towards e-commerce and examining the role of social media activities in customer buying behavior are also proposed as areas of further research. By addressing these areas, a deeper understanding can be gained regarding the relationship between social media marketing and customer engagement.
AUTHOR(S) NOTE:
Nalin Abeysekera is Professor of Marketing Management, Dean, Faculty of Management Studies, The Open University of Sri Lanka (email: nabey@ou.ac.lk).
W. Isuru Dananjana is a Graduate Student of the Institute of Chemistry Ceylon, College of Chemical Science, Sri Lanka, and a Graduate Student at the Department of Polymer Science, University of Sri Jayewardenepura, Sri Lanka (email: isurudwanigasekara@gmail.com).
D.L. Isuri Yasara is a Graduate Student of the Institute of Chemistry Ceylon, College of Chemical Science, Sri Lanka, and a Graduate Teaching Assistant at the Department of Chemistry, University of Colombo, Sri Lanka (email: yasara@chem.cmb.ac.lk).
Acknowledgment: The authors are very grateful to the survey participants.
Declaration of conflicting interests: There are no potential conflicts of interest with respect to the research, authorship, and/or publication of this article.
Financial disclosure: This research received no specific grant from any funding agency in the public, commercial, or not-for-profit sectors.
Impact of Social Media Marketing on Customer Engagement in an Apparel Brand, Sri Lanka.
W. I. Dananjana1*, D. L. I. Yasara1, N. Abeysekera2
1Institute of Cgemistry Ceylon, College of Chemical Science, Sri Lanka
2The Open University of Sri Lanka
REFERENCES
- Aakko, Maarit, and Kirsi Niinimäki (2022), “Quality matters: reviewing the connections between perceived quality and clothing use time,” Journal of Fashion Marketing and Management, 26 (1), 107–25.
- Adapa, Apurva, Fiona Fui Hoon Nah, Richard H. Hall, Keng Siau, and Samuel N. Smith (2018), “Factors Influencing the Adoption of Smart Wearable Devices,” International Journal of Human-Computer Interaction, 34 (5), 399.
- Ahire, Sanjay L., Damodar Y. Golhar, and Matthew A. Waller (1996), “Development and Validation of TQM Implementation Constructs,” Decision Sciences, 27 (1), 23–56.
- Araujo, Theo and Peter Neijens (2012), “Friend me: Which factors influence top global brands participation in social network sites,” Internet Research, 22 (5), 626–40.
- Austin, Lucinda and Yan Jin (2017), Social Media and Crisis Communication, 1st ed. Routledge.
- Bai, Yuling, Cong Li, and Jishun Niu (2016), “Study on Customer-Perceived Value of Online Clothing Brands,” American Journal of Industrial and Business Management, 06 (08), 914–21.
- Benson, P. George, Jayant V. Saraph, and Roger G. Schroeder (1991), “The Effects of Organizational Context on Quality Management: An Empirical Investigation,” Management Science, 37 (9), 1107–24.
- Brodie, Roderick J., Linda D. Hollebeek, Biljana Jurić, and Ana Ilić (2011), “Customer engagement: Conceptual domain, fundamental propositions, and implications for research,” Journal of Service Research, 14 (3), 252–71.
- Brodie, Roderick J., Ana Ilic, Biljana Juric, and Linda Hollebeek (2013), “Consumer engagement in a virtual brand community: An exploratory analysis,” Journal of Business Research, 66 (1), 105–14.
- Carlson, Jordan A., Jessa K. Engelberg, Kelli L. Cain, Terry L. Conway, Alex M. Mignano, Edith A. Bonilla, Carrie Geremia, and James F. Sallis (2015), “Implementing classroom physical activity breaks: Associations with student physical activity and classroom behavior,” Preventive medicine, 81 (1), 67–72.
- Chan, T J and M L Goh (2019), “A Determinants of Service Quality and Customer Satisfaction of Retail Clothing Company,” Journal of Business and Social Review in Emerging Economies, 5 (2), 295–304.
- Chen, Juan, Xiaorong Hou, and Wenlong Zhao (2016), “Research on the Model of Consumer Health Information Seeking Behavior via Social Media,” International Journal of Communications, Network and System Sciences, 9 (8), 326–37.
- Chen, Shih Chih and Chieh Peng Lin (2019), “Understanding the effect of social media marketing activities: The mediation of social identification, perceived value, and satisfaction,” Technological Forecasting and Social Change, 140 (1), 22–32.
- Constantinides, Efthymios and Stefan J Fountain (2008), “Web 2.0: Conceptual foundations and marketing issues,” Journal of Direct, Data and Digital Marketing Practice, 9 (3), 231–44.
- Coyle, James R. and Esther Thorson (2013), “The Effects of Progressive Levels of Interactivity and Vividness in Web Marketing Sites,” Journal of Advertising, 30 (3), 65–77.
- Creswell, J W (2009), Research Desing: Qualitative, Quantitative and Mixed Methods Approaches, 3rd ed. SAGE Publications.
- Cunningham, Stuart and David Craig (2019), “Creator Governance in Social Media Entertainment,” Social Media + Society, 5 (4), 1-11.
- Dmr, Dissanayake (2019), “Social Media Marketing and Customer Engagement: A Review on Concepts and Empirical Contributions Background of the Study,” Kelaniya Journal of Management, 8 (1), 71.
- van Doorn, Jenny, Katherine N. Lemon, Vikas Mittal, Stephan Nass, Doreén Pick, Peter Pirner, and Peter C. Verhoef (2010), “Customer Engagement Behavior: Theoretical Foundations and Research Directions,”, 13 (3), 253–66.
- Enginkaya, Ebru and Hakan Yılmaz (2014), “What Drives Consumers to Interact with Brands through Social Media? A Motivation Scale Development Study,” Procedia – Social and Behavioral Sciences, 148, 219–26.
- Fortin, David R. and Ruby Roy Dholakia (2005), “Interactivity and vividness effects on social presence and involvement with a web-based advertisement,” Journal of Business Research, 58 (3 SPEC. ISS.), 387–96.
- Gan, Chunmei and Weijun Wang (2017), “The influence of perceived value on purchase intention in social commerce context,” Internet Research, 27 (4), 772–85.
- van Griethuijsen, Ralf A.L.F., Michiel W. van Eijck, Helen Haste, Perry J. den Brok, Nigel C. Skinner, Nasser Mansour, Ayse Savran Gencer, and Saouma BouJaoude (2014), “Global Patterns in Students’ Views of Science and Interest in Science,” Research in Science Education, 45 (4), 581–603.
- Gupta, Anushree, Akshat Suri, Alisha Bhargavan, and Anant Bhadani (2020), “CUSTOMER ENGAGEMENT IN THE ONLINE CLOTHING INDUSTRY,” International Journal of Creative Research Thoughts, 8 (7), 2320–2882.
- Hoang, Duc, Sofia Kousi, and Luis F. Martinez (2022), “Online customer engagement in the post-pandemic scenario: a hybrid thematic analysis of the luxury fashion industry,” Electronic Commerce Research, 23 (1), 1401–1428.
- Hollebeek, Linda D. (2013), “The Customer Engagement/Value Interface: An Exploratory Investigation,” Australasian Marketing Journal, 21 (1), 17–24.
- Hollebeek, Linda D. and Tom Chen (2014), “Exploring positively- versus negatively-valenced brand engagement: A conceptual model,” Journal of Product and Brand Management, 23 (1), 62–74.
- Hoyer, Wayne D., Rajesh Chandy, Matilda Dorotic, Manfred Krafft, and Siddharth S. Singh (2010), “Consumer cocreation in new product development,” Journal of Service Research, 13 (3), 283–96.
- Hsu, Meng-Hsiang, Teresa L Ju, Chia-Hui Yen, and Chun-Ming Chang (2007), “Knowledge sharing behavior in virtual communities: The relationship between trust, self-efficacy, and outcome expectations $,” Int. J. Human-Computer Studies, 65 (1), 153–69.
- Humphreys, Lee and Rowan Wilken (2015), “Social media, small businesses, and the control of information,” Information Communication and Society, 18 (3), 295–309.
- Hussein, Rania and Salah Hassan (2017), “Customer engagement on social media: How to enhance continuation of use,” Online Information Review, 41 (7), 1006–28.
- Jacinto, Jade Xuccheney N., Joylyn S. Pintado, Louie Jay M. Ibañez, Ronel G. Dagohoy, and Mark Van M. Buladaco (2021), “Social Media Marketing Towards Consumer Buying Behavior: A Case in Panabo City,” International Journal of Research and Innovation in Social Science, 5 (2), 22–30.
- Kalla, Supriya M., Baldev R. Sharma, and Neena Sondhi (2017), “Customer engagement in the Indian retail banking sector: an exploratory study,” International Journal of Business Innovation and Research, 12 (1), 41.
- Kaplan, Andreas M. and Michael Haenlein (2010), “Users of the world, unite! The challenges and opportunities of Social Media,” Business Horizons, 53 (1), 59–68.
- Krishnamoorthy, V., P. Karthikeyan, and N. Prakash (2016), “An Examination of the Relationship Between Service Quality and Patients’ Satisfaction in the Hospital Industry,” Indian Journal of Marketing, 46 (11), 21–35.
- Kumar, V., Lerzan Aksoy, Bas Donkers, Rajkumar Venkatesan, Thorsten Wiesel, and Sebastian Tillmanns (2010), “Undervalued or Overvalued Customers: Capturing Total Customer Engagement Value,” Journal of Service Research, 13 (3), 297–310.
- Lin, Hsin Hui and Yi Shun Wang (2006), “An examination of the determinants of customer loyalty in mobile commerce contexts,” Information and Management, 43 (3), 271–82.
- Lin, Kuan Yu and Hsi Peng Lu (2011a), “Why people use social networking sites: An empirical study integrating network externalities and motivation theory,” Computers in Human Behavior, 27 (3), 1152–61.
- Lin, Kuan Yu and Hsi Peng Lu (2011b), “Intention to continue using Facebook fan pages from the perspective of social capital theory,” Cyberpsychology, behavior and social networking, 14 (10), 565–70.
- Liu, Yuping and L. J. Shrum (2013), “What is Interactivity and is it Always Such a Good Thing? Implications of Definition, Person, and Situation for the Influence of Interactivity on Advertising Effectiveness,” Journal of Advertising, 31 (4), 53–64.
- Mendelson, Andrew (2001), “Effects of Novelty in News Photographs on Attention and Memory,” Media Psychology, 3 (2), 119–57.
- Mohammed, Majeed. (2020), “Exploring the Impact of Social Media on Customer Engagement.” International Journal of Advanced Science and Technology, 29 (9), 6766-6781.
- Moorman, Christine, Rohit Deshpandé, and Gerald Zaltman (2018), “Factors Affecting Trust in Market Research Relationships,” Journal of Marketing, 57 (1), 81–101.
- Morgan, Robert M. and Shelby D. Hunt (2018), “The Commitment-Trust Theory of Relationship Marketing,” Journal of Marketing, 58 (3), 20–38.
- Muchardie, Brian Garda, Nabila Hanindya Yudiana, and Annetta Gunawan (2016), “Effect of Social Media Marketing on Customer Engagement and its Impact on Brand Loyalty in Caring Colours Cosmetics, Martha Tilaar,” Binus Business Review, 7 (1), 83-87.
- Muntinga, Daniël G., Marjolein Moorman, and Edith G. Smit (2011), “Introducing COBRAs,” International Journal of Advertising, 30 (1), 13–46.
- Oliver, Richard L. (2018), “A Cognitive Model of the Antecedents and Consequences of Satisfaction Decisions:,” Journal of Marketing Research, 17 (4), 460–69.
- Pallant, Julie (2020), SPSS Survival Manual: A Step by Step Guide to Data Analysis Using IBM SPSS, 7th ed. Routledge.
- Parasuraman, A. (1997), “Reflections on gaining competitive advantage through customer value,” Journal of the Academy of Marketing Science, 25 (2), 154–61.
- Pathak, Vivek Kumar, Ashim Kumar Das, and Rajeev Kumar Panda (2018), “Application of RIDIT Analysis in Prioritizing Perceived Service Quality Dimensions of Management Graduates in Indian Universities,” Indian Journal of Marketing, 48 (2), 23–35.
- Pinto, Mary Beth and Arpan Yagnik (2017), “Fit for life: A content analysis of fitness tracker brands use of Facebook in social media marketing,” Journal of Brand Management, 24 (1), 49–67.
- Pletikosa Cvijikj, Irena and Florian Michahelles (2013), “Online engagement factors on Facebook brand pages,” Social Network Analysis and Mining, 3 (4), 843–61.
- Prebensen, Nina K. and Jinghua Xie (2017), “Efficacy of co-creation and mastering on perceived value and satisfaction in tourists’ consumption,” Tourism Management, 60, 166–76.
- Rachmah, Rima Raidah and Lidia Mayangsari (2020), “Online Engagement Factors on Instagram Local Fashion Brand Accounts,” KnE Social Sciences, 4 (6), 446–458.
- Ray, Soumya, Sung S. Kim, and James G. Morris (2014), “The central role of engagement in online communities,” Information Systems Research, 25 (3), 528–46.
- Rintamäki, Timo, Antti Kanto, Hannu Kuusela, and Mark T. Spence (2006), “Decomposing the value of department store shopping into utilitarian, hedonic and social dimensions: Evidence from Finland,” International Journal of Retail & Distribution Management, 34 (1), 6–24.
- Rohm, Andrew, Velitchka D. Kaltcheva, and George R. Milne (2013), “A mixed-method approach to examining brand-consumer interactions driven by social media,” Journal of Research in Interactive Marketing, 7 (4), 295–311.
- Rubin, Allen. and Earl R. Babbie (2011), Research methods for social work, 7th ed. Brooks/Cole Publisher.
- Ruiz-Mafe, Carla, Jose Martí-Parreño, and Silvia Sanz-Blas (2014), “Key drivers of consumer loyalty to Facebook fan pages,” Online Information Review, 38 (3), 362–80.
- Shabbir, Benish and Xiaodong Qiu (2023), “Digital Sales & Marketing Impact on Asian Market during Pandemic with the Effect of Creating Online Demand: Robust Optimization of Digital Marketing Intelligence,” American Journal of Industrial and Business Management, 13 (02), 13–28.
- “Sledgianowski, D., & Kulviwat, S. (2009). “Using social network sites: the effects of playfulness, critical mass and trust in a hedonic context,” Journal of Computer Information Systems, 49 (4), 74-83.
- van Tonder, Estelle and Daniël Johannes Petzer (2018), “The interrelationships between relationship marketing constructs and customer engagement dimensions,” The Service Industries Journal, 38 (13–14), 948–73.
- Truss, Catherine, Rick Delbridge, Kerstin Alfes, Amanda Shantz, and Emma Soane (2013), Employee Engagement in Theory and Practice, 1st ed. Routledge
- Vale, Leonor and Teresa Fernandes (2018), “Social media and sports: driving fan engagement with football clubs on Facebook,” Journal of Strategic Marketing, 26 (1), 37–55.
- Vinerean, Simona and Alin Opreana (2021), “Measuring customer engagement in social media marketing: A higher-order model,” Journal of Theoretical and Applied Electronic Commerce Research, 16 (7), 2633–54.
- Vivek, Shiri D., Sharon E. Beatty, and Robert M. Morgan (2012), “Customer engagement: Exploring customer relationships beyond purchase,” Journal of Marketing Theory and Practice, 20 (2), 122–46.
- De Vries, Lisette, Sonja Gensler, and Peter S.H. Leeflang (2012a), “Popularity of Brand Posts on Brand Fan Pages: An Investigation of the Effects of Social Media Marketing,” Journal of Interactive Marketing, 26 (2), 83–91.
- De Vries, Lisette, Sonja Gensler, and Peter S.H. Leeflang (2012b), “Popularity of Brand Posts on Brand Fan Pages: An Investigation of the Effects of Social Media Marketing,” Journal of Interactive Marketing, 26 (2), 83–91.
- Yazdanparast, Atefeh, Mathew Joseph, and Fernanda Muniz (2016), “Consumer based brand equity in the 21st century: an examination of the role of social media marketing,” Young Consumers, 17 (3), 243–55.
- Zeithaml, Valarie A. (1988), “Consumer Perceptions of Price, Quality, and Value: A Means-End Model and Synthesis of Evidence,” Journal of Marketing, 52 (3), 2–22.
FOOTNOTES
[1] https://gs.statcounter.com/social-media-stats
[2] https://www.analysisinn.com/post/kmo-and-bartlett-s-test-of-sphericity/
[3] https://www.ibm.com/docs/en/spss-statistics/23.0.0?topic=detection-kmo-bartletts-test
[4] https://www.anodot.com/learning-center/correlation-analysis/#:~:text= Correlation%20analysis%20can%20help%20reveal,get%20to%20addressing%20incidents%20faster.