
An Assessment on the Indoor Environment Quality (IEQ) of Hospital and Patient Satisfaction; A Case Study in Sylhet MAG Osmani Medical College Hospital, Sylhet, Bangladesh
- Md Raju Sheikh
- Shahnaj Shemul
- 725-740
- Aug 10, 2024
- Environmental Assessment
An Assessment on the Indoor Environment Quality (IEQ) of Hospital and Patient Satisfaction; A Case Study in Sylhet MAG Osmani Medical College Hospital, Sylhet, Bangladesh
*1Md Raju Sheikh & 2Shahnaj Shemul
1B. Sc Student, Department of Geography and Environment, Shahjalal University of Science and Technology, Sylhet, Bangladesh.
2Assistant professor, Department of Geography and Environment, Shahjalal University of Science and Technology, Sylhet, Bangladesh.
*Corresponding Author
DOI: https://doi.org/10.51244/IJRSI.2024.1107057
Received: 05 July 2024; Revised: 15 July 2024; Accepted: 20 July 2024; Published: 10 August 2024
ABSTRACT
To understand how patients felt about thermal comfort, indoor air quality (IAQ), lighting, and sound quality in hospital wards, this study set out to survey patients. The purpose of the study was to determine the factors influencing indoor environmental quality (IEQ) and look at how satisfied patients were with their health. In Sylhet MAG Osmani Medical College Hospital, the study was conducted over the winter months of November and December 2022, and January 2023 to evaluate the quality of the indoor environment (IEQ). For data analysis, structural equation modeling was used. Thermal comfort, illumination, indoor air quality, and noise characteristics were identified as the four IEQ elements that affected IEQ in the study. The Sylhet MAG Osmani Medical College Hospital’s average temperature has been recorded as being 24.91°C during the day and 22.01°C at night. According to the research, daytime humidity ranged from 56% to 88.9% while nighttime humidity ranged from 65.2% to 90.4%. Yet, the quality of the lighting changed significantly from day to night in various wards. In the daytime, there are 100 lux and 72 lux, respectively, of light. The Sylhet MAG Osmani Medical College Hospital has a noise level of 74.8 dB during the day and 71.77 dB at night. Yet, it exceeded governmental criteria. Particulate Matter (PM2.5 and PM10) indoor air quality changed significantly from day to night in different wards. PM2.5 is classified as unhealthy day and night, in contrast to PM10, which is tolerable during the day and unhealthy for sensitive populations at night.
Keywords: Thermal Comfort, Sound Quality, Light Quality, Indoor Air Quality, Medical College Hospital.
INTRODUCTION
Hospitals need doctors, employees, and patients to spend a lot of time indoors, where the level of indoor environmental toxins may affect them. The circumstances within a structure that have an impact on a person’s ability to live there are referred to as IEQ (indoor environmental quality) in general. The indoor environmental quality of a particular structure is influenced by physical, chemical, and biological aspects such as lighting, thermal comfort, acoustics, drinking water, ergonomics, electromagnetic radiation, and several other related issues (IEQ). The quality of life of building tenants, the building’s market value, and the financial burden on building owners can all be improved by improved environmental quality. Hospitals with high IEQ surely benefit patients’ health and mood. “Indoor air quality” (IAQ), which is reliant on airborne pollutants inside a building, is one of the crucial factors that define the quality of the interior environment (or, in a broader sense, any other enclosure such as a car or an animal housing). For buildings such as healthcare facilities, maintaining health and comfort is an issue that should not be ignored. It has been noted to have significant effects on patient health. This is consistent with the concept of Al Raji et al (2010) who describe hospitals as diagnostic human treatment. The environment where activities such as care promotion, health education, training, and Research are done. In order for a hospital setting to promote healing, it must also promote both patient and staff well-being hospital structures which Zborowsky and Kreitzer (2008) hypothesized consist of a suitable indoor setting that will draw people in, keep them there, and improve the healing process for the patient as well as the staff’s abilities. Thus a hospital facility should be planned to maximize comfort for all of its users, including patients, their families, visitors, and healthcare professionals. For instance, a hospital’s residents depend on its indoor environmental condition. Residents’ perceptions of their surroundings are strained by a poor guy (IEQ). Similarly, research has demonstrated that low IEQ has a detrimental impact on occupants’ physical and mental health (Mahbob et al., 2011; Sadek and Nofal, 2013). The impact of (IEQ) was also mentioned by Sadek and Nofal (2013). The level of patient satisfaction impacts both physical and emotional health. Therefore, the internal spaces of hospitals should be planned to support the emotional requirements of staff, patients, and their families (Salonen et al., 2013).
LITERATURE SUMMARY OF KEY TERMS
2.1 Thermal Comfort
The term “thermal comfort” refers to a state that is controlled by a variety of human and environmental variables, or more specifically, by physiological, physical, and socio-psychological variables. The main human components are clothing and metabolic heat, whereas the environmental elements include air temperature, air velocity, humidity, radiant temperature, and relative humidity. Physical and emotional health, the accessibility of food and drink, and acclimation are some of the additional aspects. A thermally comfortable and healthy indoor environment for patients is essential for their optimum recovery. Thermal comfort describes the condition of the mind in terms of temperature satisfaction in a defined environment (ASHRAE, 2004a). Two important schools of thought exist in thermal convenience research; the heat balance approach (Fanger, 1970) and the adaptive thermal comfort approach (de Dear et al., 2013). Fanger (1970) introduced the concepts of the predicted mean vote (PMV) and predicted percentage of dissatisfaction (PPD), which have been incorporated into the international standards (ISO, 2005) and ASHRAE (2004b). The adaptive principle opined that ‘humans react in such a way that tends to lean towards ensuring that their comfort is reestablished when changes which affect their comfort level’ occur (Nicol et al., 2012). Since most of this condition is subjective, it cannot be accurately measured. It has been determined that the thermal comfort level is considered adequate if at least 80% of the people inside it are at ease.
2.2 Light Quality
Indoor light quality refers to the characteristics of the light sources used indoors and how they affect the visual and non-visual aspects of human health and well–being. Indoor lighting quality is a crucial factor in hospital design and can have a big impact on staff and patient outcomes. Low light during the day and too much light at night may impact circadian rhythms and thus influence human mood and health, increasing the risk of hypertension and diabetes. Light also plays a significant effect in lowering sadness and weariness. Light has been related to fewer medication-dispensing errors in pharmacies and can be good for patients as well as the employees that work there. In addition to providing an appropriate soundscape, color, and illumination can significantly influence how patients view their health outcomes (Dalke, 2006; Mackrill et al., 2014). High window-to-wall ratios that improve daylighting characteristics and result in visual comfort and energy savings in patient rooms are used to accomplish this.
2.3 Sound Quality
Hospitals place a high priority on indoor sound quality because it can significantly affect patient comfort and recovery, staff productivity, and general well-being. Noise levels, voice clarity, and sound insulation are particularly important in hospital environments. Excessive noise in hospitals can stress patients out, disrupt their sleep, and even hinder their recovery. Loud noises can occur from a variety of things, including cleaning operations, medical equipment, alarms, and conversations. Hospital noise levels can be reduced via the use of sound-absorbing materials, appropriate equipment location and design, and the application of noise reduction strategies. The acoustic environment can cause hearing loss, stress, alter sleep patterns, and affect heart rate based on other IEQ co-factors (ASHRAE, 2016). According to Prakash (2005), indoor noise from lights, HVAC systems, and other sources can make individuals feel uneasy, agitated, and worn out. Pleasant sounds such as music or natural sounds can help reduce stress and anxiety for patients, while unpleasant sounds can have the opposite effect. Designing hospital environments with the acoustic comfort of patients in mind can promote healing and enhance the overall patient experience. Proper management of indoor sound quality is essential for creating a comfortable and healing environment in hospitals. Factors such as noise levels, speech intelligibility, sound insulation, and sound quality should all be considered when designing and managing hospital environments
2.4 Air Quality
Indoor air quality is particularly critical in hospitals, where patients are often more susceptible to airborne illnesses and infections. In hospitals, sources of indoor air pollution can include biological contaminants such as bacteria and viruses, as well as chemical pollutants from cleaning products, medical gases, and other materials. Proper ventilation and air filtration are crucial for maintaining good indoor air quality in hospitals. Ventilation systems should provide adequate fresh outdoor air and exhaust stale indoor air, while air filtration systems should be designed to remove biological and chemical pollutants from the air. Other strategies for improving indoor air quality in hospitals include implementing infection control measures, using low-emission building materials and cleaning products, and regular maintenance of HVAC systems. Good indoor air quality is essential for protecting the health and well-being of patients, staff, and visitors in hospital environments. To attain clean indoor air quality in hospitals, it is essential to have a complete understanding of how ventilation systems, indoor inhabitants, types of medical procedures, and building materials, as well as regional and seasonal fluctuations, affect indoor air pollution levels (Erdogan et al., 2010). Fenestration in the hospital structure could let contaminated air from the outside into the interior of the hospital. Also, the contamination of the indoor environment is a result of the radon and other gases that leak from the bedrock and soil below the surface as well as the evaporation of particulate matter from furniture, water, and other sources (John et al., 2010). Other factors that may contribute to poor IAQ include poor cleaning practices, poor moisture control (e.g., water leaks or persistent damp surfaces), human occupancy (e.g. odors), and poor building maintenance (Paevere et al., 2008).
2.4.1 Particulate Matter
Particulate matter (PM) refers to tiny particles of solid or liquid substances that are suspended in the air. These particles can come from natural sources such as dust and wildfires, as well as human-made sources such as emissions from vehicles, power plants, and industrial processes. PM is classified based on its size, with smaller particles being more harmful to human health as they can penetrate deeper into the lungs and bloodstream. PM can cause a range of health effects, including respiratory and cardiovascular problems, as well as contributing to climate change. To mitigate the impacts of PM on human health and the environment, regulations and standards have been established to limit emissions from various sources and promote the use of air filtration and other pollution control technologies. Monitoring of PM levels in the air is also important to identify and address areas of high pollution and potential health risks. The particle diameter is employed to control air quality. Those that are inhalable and have a diameter of 10 microns or less (PM10) can have a detrimental effect on health. Particles with a diameter of no more than 2.5 microns are fine particulate matter (PM2.5). Hence, a portion of PM10 is composed of PM2.5
METHODOLOGY
3.1 Study Area
The Sylhet MAG Osmani Medical College Hospital may be found at 24.9005°N and 91.8532°E using the geographic coordinates system. At the northwest corner of Sylhet City is where you’ll find the Sylhet M.A.G. Osmani Medical College Hospital.
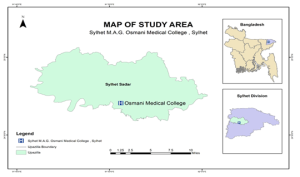
Fig.1 Map of the study area
3.2 Data Collection
In order to obtain an accurate understanding of the field, data was gathered from both primary and secondary sources, including both quantitative and qualitative data. Various types of methods are discussed which were used to collect desired data. Data will be collected in two levels.
- Primary Data Collection.
- Secondary Data Collection.
Primary Data Collection: Temperature, Humidity, Light, Air, and Noise all data are collected by field observation. There were 31 wards in Sylhet MAG Osmani Medical College Hospital where 5 words (word no. 02, 05, 21, 26, 31) are selected for collecting indoor environment parameters data. In situ measurements at selected hospital wards were conducted using digital PCE meter (temperature and humidity), light meter (light intensity), aeroqual 500base meter (Air Quality), and sound level meter (noise level) during daytime (12 pm -2 pm) and night (9 pm-10 pm).
Secondary Data Collection: The secondary data is accessed mainly from websites, previously published articles, satellite images, and GIS software.
3.3 Data Analysis
Various methods were used for the analysis of collected data. The software that will be used for analyzing data will be Microsoft Office Excel and SPSS. The data is going to be expressed in terms of descriptive statistics while the figures would present actual value.
3.3.1 Thermal Comfort Analysis: Temperature and Humidity All data are collected from field observation by PCE-PCO1 Air Meter. The software that will be used for analyzing data will be Microsoft Office Excel and SPSS. The data is going to be expressed in terms of descriptive statistics while the figures would present actual value.
3.3.2 Sound Quality Analysis: Noise levels were measured by a sound level meter. The intensity of the noise is most conveniently measured in dB decibels (dB) ranging from 30 to 120 dB Collected data was calculated by LAeq (dB) equation.
Equivalent Noise Level, LAeq(dB) = ![]()
They were grouped and tabulated, and finally, computer programs such as SPSS program and Microsoft Excel were used to process and analyze the data. The World Health Organization (WHO) and the International Noise Council have advised that hospitals should maintain noise levels of 35 to 40 dB(A) during the day and 30 to 40 dB(A) at night.
3.3.2 Light Quality Analysis: Light intensities were measured by Light Meter. The intensity of the light is most conveniently measured in lux ranges from 1 to 100000 lux. The data will be analyzed by using SPSS and Microsoft Office Excel software. The data is going to be expressed in terms of descriptive statistics while the figures would present actual value.
3.3.4 Air Quality Analysis: Aeroqual 500base Air Meter is used to collect data on particle counts in indoor air. An air quality index is a scale that is used to display the level of air pollution as well as the dangers related to each rating. Medical research-based parameters for the allowable levels of major air contaminants are used to produce an AQI. The average pollutant concentrations recorded for a full hour, a full eight hours, or a full day are used to calculate the air quality index. The equations for the parameters are used individually to determine the AQI. For instance, use the equation four times to determine the worst sub-index to determine the AQI based on four parameters. a linear function called a sub-index (two different yet related notions) of the concentration pollutants.
Ip = ![]()
Table.1 Air Quality Index
| AQI value of Index | Levels of Health concern | PM2.5 concentration(µg/m3) | PM10 concentration(µg/m3) | AQI color | Air Pollution Labels |
| 0-50 | Good | 0-30 | 0-50 | Green | Level 1 |
| 51-100 | Moderate | 31-60 | 51-100 | Yellow | Level 2 |
| 101-200 | Unhealthy for Sensitive Group | 61-90 | 101-250 | Orange | Level 3 |
| 201-300 | Unhealthy | 91-120 | 251-350 | Red | Level 4 |
| 301-400 | Very Unhealthy | 121-250 | 350-430 | Purple | Level 5 |
| 401 and higher | Hazardous | 250+ | 430+ | Maroon | Level 6 |
RESULT AND DISCUSSION
4.1 Thermal Comfort Analysis
4.1.1 Temperature
According to the analysis, the average daytime temperatures for the different hospital wards under investigation were Ward 02 (female medicine ward), 25.36 ° C, Ward 05 (female surgery ward), 24.19 ° C, Ward 31 (male surgery ward), 23.88 ° C, ward 26 (male medicine ward), 24.73 ° C, and ward 21 (pediatric ward), 26.38 ° C and at night were Ward 02 (female medicine ward) 25.36 °C, Ward 05 (female surgery ward) 24.19 °C, Ward 31 (male surgery ward) of 23.88 °C, Ward 26 (male medicine ward) of 24.73 °C, and ward 21 (pediatric ward) of 26.38 °C. The hospital’s indoor average day temperature during the seasons is 24.91°C, with the maximum temperature reaching 34°C and the lowest reaching 16°C At night temperature is 22 °C on average but might change from 12.9 °C to 30.1 °C. According to ASHRAE (2006), the ideal temperature ranges are between 23 and 26 °C and 24 and 33 °C (British Standards Institution, 2007). The temperature in the chosen wards is within the advised standard based on the data supplied. Observed were the city’s interior circumstances and the weather. The tested hospital wards’ ambient temperatures varied widely within the chosen month, recorded. This implies that these wards would need a single external input, such as artificial ventilation, to assist in generating the indoor environment. Hospital wards are suited for patients receiving treatment for a variety of medical illnesses.
Table 2 Measured Average Temperature (° C) of Hospital
| Month | November Temperature (° C) | December Temperature (° C) | January Temperature (° C) | The Season Temperature (° C) | ||||
| Ward | Day | Night | Day | Night | Day | Night | Day | Night |
| Medicine (Female): ward-02 | 28.42 | 27.45 | 24.17 | 24.07 | 23.57 | 22.57 | 25.4 | 24.67 |
| Surgery(female): ward-05 | 28.03 | 24.18 | 23.35 | 16.66 | 21.31 | 18.2 | 24.2 | 19.63 |
| Surgery(male): ward-31 | 26.86 | 24.18 | 22.33 | 16.65 | 22.54 | 18.2 | 23.9 | 19.63 |
| Medicine (male): ward-26 | 27.18 | 24.16 | 22.35 | 16.76 | 24.7 | 20.4 | ||
| Pediatric: ward-21 | 29.19 | 28.37 | 25.94 | 24.22 | 24.09 | 23.13 | 26.4 | 25.22 |
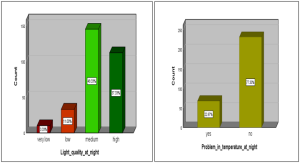
4.1.2 Patient Satisfaction with Indoor Temperature
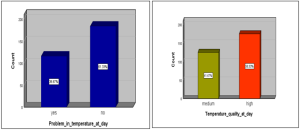
Though the temperature level of Sylhet MAG Osmani Medical College Hospital was acceptable majority of perceptions of thermal at day were high (58.33%) and medium (41.67%) and the night were high (9.67%), medium (53.67 %,) and Low (36.67). Where 38.67% of participants face problems at this indoor day temperature whereas 61.33% of participants have no problem at this temperature and 22.6% of participants face problems at this indoor night temperature whereas 77.33% of participants have no problem at this temperature. The participants who had faced problems stated that they mainly suffered from discomfort, sweating, and sleep problems.
A
B
Figure.2 Patients’ satisfaction with day temperatures (A) and Night temperature (B) of the Hospital
4.1.3 Humidity
The analysis shows that the average daily season’s humidity for the various hospital wards examined day humidity were Ward 02(female medicine ward) at 75.62%, Ward 05(female surgery ward) at 82.68%, Ward 31(male surgery ward) at 82.4%, ward 26(male medicine ward) 80.88%, ward 21(pediatric ward) 78.48%. And night were Ward 02(female medicine ward) at 83.26%, Ward 05(female surgery ward) at 83.80%, Ward 31(male surgery ward) at 82.82%, Ward 26(male medicine ward) 82.53%, ward 21(pediatric ward) 86.20%. The season’s indoor average daytime Humidity of the hospital was 79.94% where highest humidity at 89% and the lowest humidity at 56% and the night was 83.72% where highest humidity at 90.5% and the lowest humidity at 65.2%. When compared to ASHRAE Standards, humidity levels were considered acceptable for human occupancy in an indoor setting (ASHRAE Standard, 2016; ASHRAE Standard, 2013). In interior buildings, ASHRAE Standard (2016) advised a relative humidity range of 65% to 80%. Based on the data presented, average relative humidity in hospitals is within the recommended standard, whereas some wards exist with the recommended standard.
Table.3 Measured Average Relative Humidity (%) of Hospitals
| Month | November
Humidity (%) |
December
Humidity (%) |
January
Humidity (%) |
The Season
Humidity (%) |
||||
| Ward | Day | Night | Day | Night | Day | Night | Day | Night |
| Medicine (Female): ward-02 | 77.73 | 83.78 | 75.4 | 82.21 | 73.8 | 83.81 | 75.6 | 83.26 |
| Surgery(female): ward-05 | 79.67 | 82.65 | 85.72 | 84.09 | 82.55 | 84.63 | 82.7 | 83.8 |
| Surgery(male): ward-31 | 80.99 | 81.52 | 83.6 | 82.27 | 82.55 | 84.63 | 82.4 | 82.82 |
| Medicine (male): ward-26 | 76.55 | 82.3 | 85.07 | 83.26 | 80.9 | 82.53 | ||
| Pediatric: ward-21 | 79.35 | 86.94 | 79.43 | 85.25 | 76.69 | 86.43 | 78.5 | 86.2 |
4.2 Sound Quality Analysis
4.2.1 Sound Quality
Each ward’s internal noise levels are high during the day. The season’s average sound level is 74.8 decibels, with 82 decibels being the highest and 65 decibels being the lowest. The International Noise Council and the World Health Organization (WHO) recommend that hospital areas should have daytime noise levels of 35 to 40 dB(A). In this hospital, the pediatric unit (Ward 21) is the noisiest ward. The typical noise levels for the season in this hospital are 78.5 decibels in Ward 02, 72.16 decibels in Ward 5, 72.46 decibels in Ward 31, 74.19 decibels in Ward 26, and 78.97 decibels in Ward 21. The average sound pressure level for the season at night is 71.77 dB, with extremes of 80 decibels and extreme lows of 55 decibels. The World Health Organization (WHO) and the International Noise Council suggest that hospital settings have nighttime noise levels of 30 to 40 dB. (A). the loudest ward in this hospital is the pediatric unit (Ward 21). For the season, the average noise levels in words 02, 05, 31, 26, and 21 were 73.64 dB, 71.65 dB, 72.52 dB, and 71.31 dB, respectively. This shows that the hospital wards are uncomfortable and noisy for patients.
Table.4 Measured Average Sound Intensity (dB) of Hospitals
| Month | November Sound (dB) | December Sound (dB) | January Sound (dB) | The Season Sound (dB) | ||||
| Ward | Day | Night | Day | Night | Day | Night | Day | Night |
| Medicine (Female): ward-02 | 74.57 | 74.57 | 73.86 | 73.86 | 73.92 | 72.67 | 78.5 | 73.64 |
| Surgery(female): ward-05 | 74.4 | 73.38 | 73 | 70.27 | 73.4 | 70.68 | 72.2 | 71.65 |
| Surgery(male): ward-31 | 74.41 | 74.4 | 73.2 | 71.84 | 71.31 | 70.37 | 72.5 | 72.52 |
| Medicine (male): ward-26 | 75.34 | 71.21 | 72.19 | 71.42 | 74.2 | 71.31 | ||
| Pediatric: ward-21 | 74.45 | 75.81 | 79.02 | 75.07 | 79.08 | 73.2 | 79 | 74.81 |
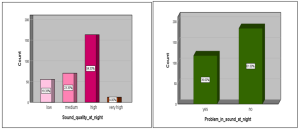
4.2.2 Patient Satisfaction with Sound Quality
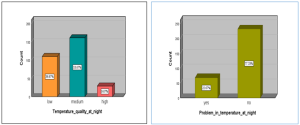
Sound quality is a subjective experience; even when noise levels are below acceptable limits, people might nevertheless become irritated by ambient noise. The average sound intensity of Sylhet MAG Osmani Medical College Hospital on the day was 74.8 dB, which is more than the permitted limit set by the International Noise Council and the World Health Organization (WHO) At Sylhet MAG Osmani Medical College Hospital. The majority of participants reported hearing sounds during the day that were high (58.33%), medium (19.63%), and very high (22%) in decibel levels, and during the night were high (54.33%), medium (23.33%), very high (4%), and low (18.33%) in decibel levels. Most sound intensities were correlated with the density of people. The source of the sound of Sylhet MAG Osmani Medical College Hospital from humans (86.67%), fans (4.67%), and construction (8.67%). 28% of patients stated the noise level of Sylhet MAG Osmani Medical College Hospital on the day was problematic and 72% was no problem with this sound label. Several people report a range of problems, including headaches, trouble sleeping, and irritation as a result of the loud noise.
A
B
Figure.3 Patient satisfaction label with Sound at day (A) and at Night (B)
4.3 Light Quality Analysis
4.3.1 Light Quality
Between November and January, the lighting conditions in the wards were also assessed. The analysis reveals that the pediatric ward (ward-21) is 95.92 lux, the male surgery ward (ward-31) is 79.67 lux, the male medicine ward (ward-26) is 71.79 lux, and the female surgical ward (ward-05) has an average daily light intensity of 77.57 lux. However, the advised range is 100–225 lux (CIBSE, 2008). This demonstrates that the majority of hospital wards are below the acceptable norm and are dark during the day. The female medical ward complies with the suggested standard label, in contrast to other wards. The effect of visual comfort on patients in the ward is not beneficial and not significant in this study. A ward’s ability to receive adequate natural light is influenced by the size, direction, and placement of a number of windows. At night time, the investigation reveals that the pediatric ward (ward-21) is 46.68 lux, the male surgery ward (ward-31) is 79.20 lux, the male medicine ward (ward-26) is 63.16 lux, and the female surgical ward (ward-05) has an average daily light intensity of 77.99 lux. However, the advised range is 100–225 lux (CIBSE, 2008). This demonstrates that most hospital wards are darker than recommended at night.
Table.5 Measured Average Light Intensity (Lux) of Hospitals
| Month | November Light Intensity (Lux) | December Light Intensity (Lux) | January Light Intensity (Lux) | The Season Light Intensity (Lux) | ||||
| Ward | Day | Night | Day | Night | Day | Night | Day | Night |
| Medicine (Female): ward-02 | 210.77 | 88.6 | 189.13 | 89.03 | 98.94 | 93.71 | 165.79 | 90.47 |
| Surgery(female): ward-05 | 94.69 | 87.75 | 73.37 | 77.61 | 65.26 | 68.94 | 77.59 | 77.99 |
| Surgery(male): ward-31 | 92.29 | 85.92 | 81.86 | 82.97 | 65.26 | 68.94 | 79.67 | 79.2 |
| Medicine (male): ward-26 | 74.31 | 53.25 | 69.26 | 72.74 | 71.79 | 63.16 | ||
| Pediatric: ward-21 | 101.77 | 44.5 | 95.03 | 47.77 | 91.16 | 47.71 | 95.92 | 46.68 |
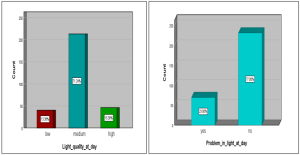
4.3.2 Patient Satisfaction of Light Quality on Day
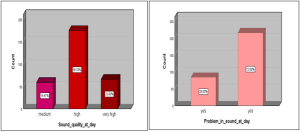
Participants’ perceptions of the light intensity of Sylhet MAG Osmani Medical College Hospital on the day were found to be low (13.38%), medium (71.24%), and high (15.38%). 23% of participants face problems with this light intensity and 77% of participants express it is natural. Some patients have significant light exposure in the daytime when their beds are by windows, whereas others have little light exposure when their beds are by corners. A ward’s ability to receive adequate natural light is influenced by the size, direction, and placement of a number of windows. The Participants’ perceptions of the light intensity at Sylhet MAG Osmani Medical College Hospital were found to be very low (3.33%), low (11%), medium (48.33%), and high (37.33%) at night. Where 22.67% of participants face problems with this light intensity and 77.33% of participants express it is natural. Several of the patients have difficulty falling asleep as a result of nighttime light.
A
B
Figure.4 Patient satisfaction label with daylight (A) and nightlight (B)
4.4 Air Quality Analysis
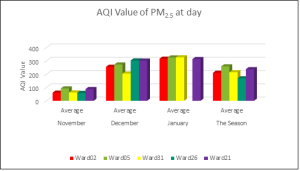
4.4.1 AQI of PM 2.5
The indoor air quality varies greatly from month to month and from ward to ward. Where on the day January air quality is very unhealthy, the December air quality is unhealthy, where Ward 26 and Ward 21 are very unhealthy and the November air quality is moderate. The average seasonal air quality of the wards is unhealthy. At night also the indoor air quality varies greatly from month to month and from ward to ward. Where January air quality is very unhealthy, the December air quality is very unhealthy where ward 31 is unhealthy and the November air quality is moderate and unhealthy for sensitive groups. The average seasonal air quality of the wards is unhealthy whereas ward 02 and ward 21 are very unhealthy.
A
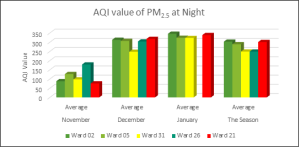
B
Figure.5 AQI value of PM2.5 at day (A) and at night (B)
The overall hospital air pollution level is shown in the table.6. The hospitals’ average air quality during the day is unhealthy where 38.19% is unhealthy, 6.09% is unhealthy, 16.78% is unhealthy for sensitive groups, 16.78% is moderate and 20.05% is good. The hospitals’ average air quality at night is unhealthy where 38.30% is very unhealthy, 12.06% is unhealthy, 25.07% is unhealthy for sensitive groups, 20.43% is moderate, 1.86% is good and 2.15% is hazardous.
Table.6 Levels of Air Quality (for PM2.5) in Hospitals
| AQI Index Range | Level of Health Concern | AQI color | AQI value of PM2.5 in Hospital (%) at day | AQI value of PM2.5 in Hospital (%) at night | Level of Pollution |
| 0-50 | Good | Green | 20.05 | 1.86 | Level 1 |
| 51-100 | Moderate | Yellow | 16.78 | 20.43 | Level 2 |
| 101-200 | Unhealthy for sensitive group | Orange | 18.08 | 25.07 | Level 3 |
| 201-300 | Unhealthy | Red | 6.89 | 12.06 | Level 4 |
| 301-400 | Very Unhealthy | Purple | 38.19 | 38.3 | Level 5 |
| 401-500 | Hazardous | Maroon | 0.62 | 2.15 | Level 6 |
4.4.2 AQI of PM 10
The indoor air quality varies greatly from month to month and from ward to ward. During the day the January air quality is unhealthy for Ward 02 and Ward 21 where the other ward was unhealthy for the sensitive group, the December air quality is moderate where Ward 21 and Ward 02 were unhealthy for the sensitive group and the November air quality is moderate and unhealthy for the sensitive group. The average seasonal air quality of the hospital was moderate whereas ward 21 is unhealthy for the sensitive group. At night also the indoor air quality varies greatly from month to month and from ward to ward. Where January air quality was very unhealthy, the December air quality was very unhealthy where ward 31 was unhealthy and the November air quality was moderate and unhealthy for sensitive groups. The average seasonal air quality of the wards was unhealthy whereas Ward 02 and Ward 21 were very unhealthy.
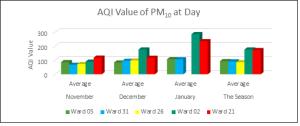
A
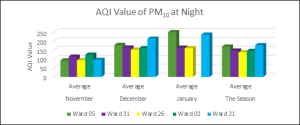
B
Figure.6 AQI value of PM10 during the day (A) and at night (B)
The overall hospital air pollution label is shown in the table.7. The hospitals’ average air quality at day was moderate where 4.89% was very unhealthy, 12.12% was unhealthy34.27% was unhealthy for sensitive groups, 29.84% was moderate and 18.18% was good. In night the hospital’s average air quality was unhealthy for sensitive groups where 24.39% was very unhealthy, 19.79% was unhealthy, 23.75% was unhealthy for sensitive groups, 18.84% was moderate and 18.84% was hazardous.
Table.6 Levels of Air Quality (for PM10) in Hospitals
| AQI Index Range | Level of Health concern | AQI color | AQI value of PM10 in Hospital (%) at day | AQI value of PM10 in Hospital (%) at night | Level of Pollution |
| 0-50 | Good | Green | 18.18 | 2.44 | Level 1 |
| 51-100 | Moderate | Yellow | 29.84 | 25.52 | Level 2 |
| 101-200 | Unhealthy for sensitive group | Orange | 34.27 | 66.43 | Level 3 |
| 201-300 | Unhealthy | Red | 12.12 | 1.75 | Level 4 |
| 301-400 | Very Unhealthy | Purple | 4.89 | 2.1 | Level 5 |
| 401-500 | Hazardous | Maroon | 0.7 | 1.75 | Level 6 |
CONCLUSION AND RECOMMENDATION
Based on the analysis conducted, it can be concluded that the hospital has several areas that need improvement in terms of its indoor environment quality. The temperature and humidity levels were found to be within the recommended range, except for the male surgical ward and pediatric ward which have higher temperatures. Noise levels in the hospital were consistently high, with all wards exceeding the recommended noise levels both day and night. The peak noise levels were also found to exceed the recommended levels. Most sound intensities were correlated with the number of people. Based on the analysis of light quality, it appears that most of the hospital wards fall short of the recommended standard during both day and nighttime. Only the Female medicine ward complies with the recommended guideline during the daytime. In terms of air quality, indoor air quality varies greatly from month to month and from ward to ward. The overall hospital air pollution label is unhealthy, with a significant percentage of wards falling into the “unhealthy” or “unhealthy for sensitive groups.”
The Sylhet MAG Osmani Medical College hospital has 33 wards, 900 seats, 19 indoor departments, and an average of more than 1200 patients are admitted each day even though the manpower, physical facilities, etc. are only available for 500 patients. Despite budgetary constrain, shortage of manpower and other associated difficulties all the doctors, Nurses and staff exert their maximum to render best possible health care services to the people. For effective patient care in this hospital, there is a growing demand for more chairs, personnel, nurses, and doctors. Health professionals and architects need to give attention to the design of hospital wards because there is a need for new hospitals and suggestions to add more wards to the existing hospitals to fulfill the growing demand for healthcare services. In order to increase the lighting during the day, the hospital should think about adding more natural light to patient rooms and communal areas. The amount of natural light could be increased by adding bigger windows, skylights, or employing surfaces that reflect light. Install high-efficiency air filters: To lower the levels of PM2.5 and PM10 in the air, the hospital should think about upgrading the air filtration system with high-efficiency filters. As a result, the staff and patients’ health may be preserved, and the air quality may be improved. Frequent ventilation system maintenance is necessary to maintain the best possible interior air quality. This maintenance should include cleaning the ducts, filters, and other components. Pollutants in the PM 2.5 and PM 10 categories.
Limitation of the Study
Data were only collected three months from the winter season, which limited the scope of the objective data analysis. Data gathering will be required throughout the year in order to comprehend the significance of additional influencing factors that could have an impact on IEQ evaluation in hospital buildings generally. Due to the ward’s relocation from the building in November, the data for Ward 26 is missing from this study. The majority of the participant are illiterate, which causes some issues with data collection.
REFERENCES
- Balaras, C. A., Dascalaki, E., & Gaglia, A. (2007). HVAC and indoor thermal conditions in hospital operating rooms. Energy and Buildings, 39(4), 454-470.
- Bear, E. A., McMahon, T. E., & Zale, A. V. (2007). Comparative thermal requirements of wests lope cutthroat trout and rainbow trout: implications for species interactions and development of thermal protection standards. Transactions of the American Fisheries Society, 136(4), 1113-1121. de Dear, R., & Kim, J. (2016). Thermal comfort inside and outside buildings. Advanced Environmental Wind Engineering, 89-99.
- Brown, R. D., & Gillespie, T. J. (1986). Estimating outdoor thermal comfort using a cylindrical radiation thermometer and an energy budget model. International Journal of Biometeorology, 30, 43-52.
- de Dear, R. J., Akimoto, T., Arens, E. A., Brager, G., Candido, C., Cheong, K. W. D., … & Zhu, Y. (2013). Progress in thermal comfort research over the last twenty years. Indoor air, 23(6), 442-461.
- Dascalaki, E. G., Lagoudi, A., Balaras, C. A., & Gaglia, A. G. (2008). Air quality in hospital operating rooms. Building and Environment, 43(11), 1945–1952. https://doi.org/10.1016/J.BUILDENV.2007.11.015
- Erdogan, M. S., Yurtseven, E., Erginoz, E., Suphi, V., Koksal, S., & Yuceokur, A. A. (2009). Total volatile organic compounds (TVOC), carbon monoxide (CO), carbon dioxide (CO2) concentrations in the hospital building of a medical faculty in Istanbul, Turkey. Nobel Medicus, 18, 66-72.
- Dascalaki, E. G., Lagoudi, A., Balaras, C. A., & Gaglia, A. G. (2008). Air quality in hospital operating rooms. Building and environment, 43(11), 1945-1952. European Standard (2008): UNE-EN 15251:2008. Indoor environmental input parameters for design and assessment of energy performance of buildings addressing indoor air quality, thermal environment, lighting and acoustics. – Aenor 1-52. https://doi.org/10.1520/E2019-03R13.Copyright.
- Erdogan, M. S., Yurtseven, E., Erginoz, E., Vehid, S., Koksal, S., & Yuceokur, A. (2010). Total volatile organic compounds (TVOC), carbon monoxide (CO), carbon dioxide (CO2) concentrations in the hospital building of a medical faculty in Istanbul, Turkey. Turkey, Nobel Medicus, 6, 66-72.
- Eštoková, A., Števulová, N., & Kubincová, L. (2010). Particulate matter investigation in indoor environment. Global NEST Journal, 12(1), 20-26.
- El-Salamouny, H. E. S., Abdou, A., & Ghoneem, M. (2019). Effects of Indoor Environmental Quality on Occupant’s Satisfaction, Health and Productivity. Port-Said Engineering Research Journal, 23(1), 10-18.
- Comite ‘Europe’en de Normalisation, C. E. N. (2007). Indoor environmental input parameters for design and assessment of energy performance of buildings addressing indoor air quality, thermal environment, lighting and acoustics. EN 15251.
- Farnsworth, J. E., Goyal, S. M., Kim, S. W., Kuehn, T. H., Raynor, P. C., Ramakrishnan, M. A., … & Tang, W. (2006). Development of a method for bacteria and virus recovery from heating, ventilation, and air conditioning (HVAC) filters. Journal of Environmental Monitoring, 8(10), 1006-1013.
- Heidi Salonen, Marjaana Lahtinen, Sanna Lappalainen, Nina Nevala, Luke D. Knibbs, Lidia Morawska & Kari Reijula (2013) Physical characteristics of the indoor environment that affect health and wellbeing in healthcare facilities: a review, Intelligent Buildings International, 5:1, 3-25, DOI: 10.1080/17508975.2013.764838
- Kruk, M. E., Gage, A. D., Arsenault, C., Jordan, K., Leslie, H. H., Roder-DeWan, S., Adeyi, O., Barker, P., Daelmans, B., Doubova, S. V., English, M., García-Elorrio, E., Guanais, F., Gureje, O., Hirschhorn, L. R., Jiang, L., Kelley, E., Lemango, E. T., Liljestrand, J., Malata, A., … Pate, M. (2018). High-quality health systems in the Sustainable Development Goals era: time for a revolution. The Lancet. Global health, 6(11), e1196–e1252. https://doi.org/10.1016/S2214-109X(18)30386-3
- Liu, X. (2021). ASTM and ASHRAE Standards for the Assessment of Indoor Air Quality. In Handbook of Indoor Air Quality (pp. 1-36). Singapore: Springer Singapore.
- Mackrill, J., Marshall, P., Payne, S. R., Dimitrokali, E., & Cain, R. (2017). Using a bespoke situated digital kiosk to encourage user participation in healthcare environment design. Applied ergonomics, 59, 342-356.
- Melikov, A., Pitchurov, G., Naydenov, K., & Langkilde, G. (2005). Field study on occupant comfort and the office thermal environment in rooms with displacement ventilation. Indoor air, 15(3), 205-214.
- Nimlyat, P.S., Salihu, B. and Wang, G.P. (2022), “The impact of indoor environmental quality (IEQ) on patients’ health and comfort in Nigeria”, International Journal of Building Pathology and Adaptation, Vol. ahead-of-print No. ahead-of-print. https://doi.org/10.1108/IJBPA-06-2021-0089
- Nyembwe, J.-P. K. B., Ogundiran, J. O., Chenari, B., Simões, N. A. V., & Gameiro da Silva, M. (2023). The Indoor Climate of Hospitals in Tropical Countries: A Systematic Review. Energies, 16(8), 3513. MDPI AG. Retrieved from http://dx.doi.org/10.3390/en16083513
- Nimlyat, P.S., Kandar, M.Z. & Sediadi, E. Multitrait-multimethod analysis of subjective and objective methods of indoor environmental quality assessment in buildings. Build. Simul. 11, 347–358 (2018). https://doi.org/10.1007/s12273-017-0405-9
- Nicol, F., Humphreys, M., & Roaf, S. (2012). Adaptive thermal comfort: principles and practice. Routledge.
- Nijhum, N. N., Hossen, M. S., & Khatun, R. Assessment of Indoor Environmental Quality of Mymensingh Medical College Hospital.
- Olaoye, T. S., Dewsbury, M., & Künzel, H. (2021). Empirical investigation of the hygrothermal diffusion properties of permeable building membranes subjected to variable relative humidity condition. Energies, 14(13), 4053.
- Paevere, P. J. (2008). Impact of indoor environment quality on occupant productivity and well-being in office buildings. Environment design guide, 1-9.
- Shajahan, A., Culp, C. H., & Williamson, B. (2019). Effects of indoor environmental parameters related to building heating, ventilation, and air conditioning systems on patients’ medical outcomes: A review of scientific research on hospital buildings. Indoor air, 29(2), 161–176. https://doi.org/10.1111/ina.12531
- Salonen, H., Lahtinen, M., Lappalainen, S., Nevala, N., Knibbs, L. D., Morawska, L., & Reijula, K. (2013). Physical characteristics of the indoor environment that affect health and wellbeing in healthcare facilities: A review. Intelligent Buildings International, 5(1), 3-25.
- Yao, R., Li, B., & Liu, J. (2009). A theoretical adaptive model of thermal comfort–Adaptive Predicted Mean Vote (aPMV). Building and environment, 44(10), 2089-2096.
- Zheng, W., Luo, B., & Wang, Y. (2013). Compressive and tensile properties of reactive powder concrete with steel fibres at elevated temperatures. Construction and Building Materials, 41, 844-851.