
Application of Games Theory in Modelling of Nigerian Electricity Market
- M. Y. Jumba
- Y. S. Haruna
- U. O. Aliyu
- A. L. Amao
- 1129-1140
- Jun 25, 2024
- Engineering
Application of Games Theory in Modelling of Nigerian Electricity Market
M. Y. Jumba1*, Y. S. Haruna2, U. O. Aliyu2 and A. L. Amao2
1Federal Polytechnic, Bauchi.
2Abubakar Tafawa Balewa University, Bauchi
Corresponding Author
DOI: https://doi.org/10.51244/IJRSI.2024.1105076
Received: 08 May 2024; Accepted: 18 May 2024; Published: 25 June 2024
ABSTRACT
The Nigerian deregulated power system is fabled to be one of the boldest privatization initiatives in the global power sector in the last decade, with transaction cost of about 1500 billion Naira ($3.0billion). Though both in theory and practice Electricity market practice is like every other market, where trading between two or more participants mutual contract based on demand and economic strength. Nigerian electricity market model is a unique whole sale power market based on Multi-Year Tariff Order (MYTO) that provided arbitrary percentage power allocation scheme, instead of bilateral contract approach as obtainable in similar market models globally. The consequence of this policy is power rejection by the DISCOS, which led into congestion, energy poverty, serious damage to equipment’s of the Transmission Company of Nigeria; as well as poor marketing performance across all segment of the Nigerian Electricity Supply Industry. In this paper, games theory has been used in modelling of the Nigerian Electricity Supply Industry market, by applied a cooperative competitive zonal market incorporating intraday to the model, the outcome results of game analysis showed that the market value ratio at best response stand at 575.5:202.2, the consumer’s surplus value was N151, 234.6, the total surplus N195, 343.6, the wholesale price is N 4.625/kWh, while that of the retail is N 8/kWh; the equilibrium quantity stands at 16,000 kWh.
INTRODUCTION
Markets can be defined as an organizational environment that permit economic transaction of goods and services. In principle, the electricity market resembles any other market where goods are manufactured and transported to the customers. Electricity market is a single non storage commodity and the quantity produced must equal the demand on a second-by-second basis. If the load exceeds production, the frequency or the voltage will drop and this may result in congestion problem or ultimately in black out. In practice, there must be a continuous connection between supply and demand and other various forces that must act to facilitate the energy transfer (Zhang et al., (2019); Yu & Hong, (2017); Ajayi, (2017); Hakam,(2018); Chawla et al., (2019) and Chen et al., (2017).
Game theory is a powerful tool to study complex and strategic interactions between multiple players. It is structured on three key ingredients namely Players, Action and Payoffs. The Players also known as Agents are responsible for decision making on behalf of the utility, community Government organization etc., the decision taken by the players is known as Action and the outcome referred to the Payoffs (Tangerås and Lundin, (2017); Wang & Lo, (2016); Yu & Hong, (2017); Blasch et al., (2017); Mei et al., (2017); Mohammadi & Rabinia, (2019); Liu et al., (2018) and Zhang et al., (2019)).
In general, the games are approached through two standard representations i.e. Normal form (Matrix form or Strategic form) the characteristics of this approach are, the players moved simultaneously with their strategies encode many things and all the possible payoffs are listed as a function of their action. While in Extensive form the game is design in such a way that timing of movement is included ,which enable the players to make moves sequentially represented in form of tree, in this way it keeps track of what each player knows when he or she makes each decision (Zhang et al., (2019); Mei et al., (2017); Mohammadi & Rabinia, (2019); Liu et al., (2018); Blasch et al., (2017)).
In practice mathematical models are formed to evaluate conflict and cooperation between Intelligent and rational decision-making. Due to its effective analysis on the interactions between multiple players, game theory has been adopted in a number of fields ranging from economics to political science, psychology and computer science (Petrosian, (2018); Morgenstern, (2018); Kratima et. al., (2013); Krysiak &Weigt, (2015); Gibbons, (2019); Mei et al., (2017); Wang & Lo, (2016); Pražák & Kovárník, (2018) and Saglam, (2018)).
LITERATURE REVIEW
In game theory, the players are expected to optimize their own objective, with a perceptive that other players’ decisions affect their objective value and that their decision affects others’ payoffs and decisions. Hence the payoffs to players determine the decisions made and the type of the game being played (Woodruff and Woodruff, (2019); Chen, (2018); Currarini & Marini, (2004)). Pareto optimality also known as Pareto efficiency is a state of allocation of resources from which it is impossible to reallocate resources so as to make any one individual or preference criterion better off without making at least one individual or preference criterion worse off (Currarini & Marini, (2004); Saglam, (2018); Jackson, (2020); He, (2014)).
A Nash Equilibrium (NE) is a state of the game where no player prefers a different action if the current actions of the other players are fixed (Nash 1953). In other words, if there is a set of strategies for a game with the property that no player can increase its payoff by changing his strategy while the other players keep their strategies unchanged, then that set of strategies and the corresponding payoffs constitute a Nash equilibrium. Propensity to disrupt is another commonly used quantitative method to evaluate the stability of game theoretic allocations with respect to the cooperating agents’ powers in a coalition of agents. (May, (2015); Leyton-Brown and Shoham, (2008); Kirschen, (2020); Leyton-Brown & Shoham, 2008) and Jackson, (2013)).The Nash equilibrium solution can be found by two algorithms: support enumeration algorithm and a mixed-integer linear programming algorithm (Nisan and Ronen, (2001); Eid et, al., (2016); Pražák and Kovárník, (2018); Hakam, (2018) and Rawas, (2020)).
Therefore in the organizational structures arrangements of electricity markets, the theory of institutional economics is important, Williamson framework represents how economic transactions are embedded in layers of formal organization, governance and informal institutions, Künneke proposed a technical counterpart of this framework (Dike, (2014) and Eid et al., (2016)). This all-inclusive framework shows how economic transactions and technical are embedded in their economic environment and technical. While from a technical outlook, operational control mechanisms manage the way in which technical transactions take place in real-time; in economic transactions, the rules for market design provide the possibilities for actors to bid in the markets.
a) Electricity Market Models
There are various methods to represent electricity markets in a model, usually categories into three namely; optimisation techniques, equilibrium models and simulation models. The optimisation models applied to a single firm set up, normally optimise a specific objective by considering a particular technique and economic constraints to maxima profit. In practice market price is based on condition that the market is in a seamless competition state. Equilibrium models are usually applied for multiple players in the market, especially in an imperfectly competitive market. Therefore, the models have the aptitude to combine multiplayer behaviour.
An important variance with optimisation models, equilibrium approach can address profit maximisation from multi players concurrently. Simulation models are applied for more multifaceted problems in the market, using exact rules and assumptions; therefore, multiplayer agent modelling can be achieved easily. A common characteristics of all the approaches, each representing a step-in development towards achieve reform of electricity market industry from a vertical integrated monopoly to a fully competitive market, the models were built around the six major players in the Electricity Supply market Industry i.e. regulators, generating companies, transmission companies, distribution companies; marketers and consumers (Momoh,(2021); Garcia et al., (2000); Bobinait et al., (2012); Anyaka, (2014); Ukoka and Agbaeze, (2018); Edomah, (2017); Wang & Lo, (2016) and Alhelou et al., (2019)).
The Nigeria model is designed in such a way that Nigerian Bulk Electricity Company buy all electricity generated from all competitive generating company as a wholesale, then sell the same to different distribution companies, then each DISCO sells to consumers based on defined tariff structure (Siemens, (2019); Watch, (2021); Fidelis and Simon, (2021); Achinanya, 2018) and Niekerk et al., (2018)).
In a full deregulated system, there exist two trading spot and energy markets, spot trading market have a day-ahead, and some markets have an hour-ahead or a day-ahead scheduling process on real time operation, which is also known as nodal model, adopted by majority of U.S. markets. Whereas European markets adopt a zonal model i.e. energy trading primarily bilateral and forward contracts. In a more centralized scheme, distribution firms and markets buy “financial” rights over the transmission network usage and inform the system operator (SO) a division of Transmission company of Nigeria the technical features of their trade. This agency is in turn in-charge of finding the cheapest way to support all submitted or scheduled trades.
Financial rights provide holders with a hedge over the potential congestion costs that may arise when all the requested trades cannot be implemented as desired. It has been established that, where the market structural design modelling is mostly based on strategic behaviour then game theory is the best tool (Zhong, (2018) and Jackson, (2020)). There exist three approach: Bertrand (price-based competition),Cournot (quantity-based competition), and supply function approach (Hajiabbas, (2020); Garcia et al., (2000); Helgesen & Tomasgard, (2018); Limpaitoon, (2012) and Zhong, (2018)).
i) Price based approach
The price-based approach has been used intensively by several researches as observed by (Helgesen & Tomasgard, (2018) and Zhong, 2018)), though can be used to study only the transmission part of the market where the transmission owners are assumed to be price takers, apart from that cannot be use for a comprehensive study of the whole power system market i.e., wholesale and retails and predict aggressive competition among firms that unhealthy to the industry.
Mathematically, consider two generating firms having a constant marginal cost \(c > 0\) and capacities \(k_i\) and \(k_j\) respectively. The GENCON must supply electricity demand from DISCOS and denoted by \(D\). The spot market for electricity operates as follows: firms submit price bids \((b_i, b_j) \in [c, \overline{p}]\) to the ISO who solves for the economic dispatch of resources. Given bids \((b_i ,b_j)\) the fraction of total demand \(D(b_i ,b_j )\) that is to be supplied by generator \(i \neq j \in (1,2)\) is (Garcia et al., (2000)):
\(D(b_i ,b_j ) = \begin{cases}
\frac{1}{2} \min(K_i, D) + \frac{1}{2} \max(0, D-K_i) & \text{if } b_i < b_j \\ \min(K_i, D) & \text{if } b_i = b_j \\ \max(0, D-K_i) & \text{if } b_i > b_j
\end{cases} \) … (1)
Where \(D\) is the inelastic demand, \(b_i , b_j\) is the price bids; \(k_i\) and \(k_j\) represent generating capacities. The spot price \(p(b_i ,b_j )\) is set to equal to the price submitted by the marginal firm and bids are constrained by a price cap \(\overline{p} > c\) stipulated by the regulatory commission. Thus, the firms’ profits are:
\(\Pi(b_i ,b_j ) =(p(b_i ,b_j )-c)D(b_i ,b_j )\) … (2)
A bidding equilibrium (also referred to as a Bertrand-Nash equilibrium) is a combination \((b_i^*,b_j^*)\) such that for any \(b \in [c, \overline{p}]\), it holds that;
\(\Pi(b_i^*,b_j^*) \geq \Pi(b_i, b_j^*)\) for \(i \in \{1,2\}\) … (3)
Another way of defining an equilibrium encompasses the application of the “best respond” function. That is, for each firm, given an opponents’ decision we compute the best pricing decision or “reply.” In other words, given \(b_j\) we solve for \(\text{BR}_i^* (b_j)\)
Where, \(\text{BR}_i^* (b_j) \in \arg \max_{b \in (c, \overline{p})} \Pi(b, b_j^*)\) … (4)
Note that a two-tuple \((b_i^*,b_j^*)\) is a bidding equilibrium Iff,
\(\text{BR}_i^* (b_j) = b_i^*\) and \(\text{BR}_j^* (b_i) = b_j^*\) … (5)
ii) Quantity-based models
According to (Garcia et al. (2000) and Zhong (2018)) this approach or model GENCOS can decide the maximum power to make available to the market instead of competing in prices. For demonstration, suppose there are only two generation companies in the market i.e. 1 and 2. Assuming a marginal cost \(c\), the profit function for firm \(i\) given production levels \(q_i, q_j\) :
\(\Pi(q_i, q_j) = P(q_i + q_j)q_i – c q_i\) … (6)
The inverse demand function is given by \(P(.)\) (i.e. \(P(q_i + q_j)\) is the price at which a total of \(Q = q_i + q_j\) would be sold in the market). In a Cournot-Nash equilibrium \(q_i^* + q_j^* q\) no company can benefit (strictly) from deviating or changing unilaterally its production decision. Formally, for all feasible production levels \(q_i \in \{1,2\}:\)
\(\Pi(q_i^*, q_j^*) \geq \Pi(q_i, q_j^*)\) … (7)
iii) Application of cournot model to electricity markets
In an ideal competitive market that is precast on a concept of demand and supply, the supply function is given by \(S(P)\). For an inflexible demand of electricity, the generation units face a residual demand equal to;
\(Q = D – S(P)\) … (8)
In oligopolists, the dominant firms face a downward sloping demand curve. Nevertheless, the dominant firms must take into account the “competitive peripheral” GENCON in making its output decisions. Given production levels \(q_i, q_j\) the inverse demand function evaluated at \(Q = q_i – q_j\) is the solution \(p\) to the following equation (Zhong (2018) and Wang & Lo (2016)):
\(Q = D – S(P)\) … (9)
For instance, when \(p = \alpha p\) residual demand is of the form \(Q(p) = D – \alpha p\). Assumed that \(p\), then the price level at which residual demand is zero i.e. \(0 = D – p = D – \alpha p\). or equivalently \(p = \frac{D}{\alpha}\). Thus
\(P(Q) = p – \frac{D}{\alpha}\) … (10)
Since \(q_j\) is given, then the “best reply” to this output can be obtained by solving eqn. (11).
\(\max \Pi(q_i, q_j)\) … (11)
The first order condition (which is also sufficient in this case) for optimality yields:
\(\frac{\partial P(q + q_j)}{\partial q} q + P = c\) … (12)
Or equivalently, marginal revenue equals marginal cost. This is equivalent to;
\(-1 \frac{\partial q + p – q + q_j}{\partial} = c\) … (13)
The best reply is therefore given by
\(\text{BR}_i^* (q_j) = \frac{1}{2} (\alpha p – c – q_j)\) … (14)
The Cournot-Nash equilibrium is a fixed-point of the best reply map i.e. \(q_i^* = \text{BR}_i^* (q_j)\) and \(q_j^* = \text{BR}_j^* (q_i)\). The linear system of equations obtained can be expressed as;
\(q_i^* = \frac{1}{2} (\alpha p – c – q_j^*)\) and \(q_j^* = \frac{1}{2} (\alpha p – c – q_i^*)\) … (15)
Solving these eqns. we obtain
\(q_i^* = q_j^* = \frac{1}{3} (\alpha p – c)\) … (16)
The related market price is given by eqn. (17) and the firm’s equilibrium profit is given by eqn. (18).
\(P(q_i^* + q_j^*) = p – \frac{1}{\alpha} \left(\frac{2}{3} (\alpha p – c)\right) = \frac{1}{3} p + \frac{2}{3} c\) … (17)
\(\Pi_i^* = \frac{1}{9} (\alpha p – c)^2\) … (18)
It is important to observe that in the Cournot model there is no “paradox”: the market price is well above marginal cost and the higher the slope of the competitive fringe supply curve the higher the
equilibrium profits. The Cournot-Nash equilibrium outcome interpretation in terms of capacity withholding by the company in an effort to have more expensive fringe suppliers set the spot price. Can they withhold even more capacity and increase profits for instance let \(q_m = \frac{1}{2} (\alpha p – c)\) and consider the two-tuple \(\left(\frac{1}{2} q_m, \frac{1}{2} q_m\right)\) and also note that;
\(\Pi_i^* = \frac{1}{2} q_m, \frac{1}{2} q_m = \frac{1}{2} (p + \frac{1}{2} c – c) = \frac{1}{8} (\alpha p – c)^2\) … (19)
However, the outcome \(\left(\frac{1}{2} q_m, \frac{1}{2} q_m\right)\) is not an equilibrium for the best reply is given by eqn. (20).
\(q_i^* = \frac{3}{8} (\alpha p – c)\) … (20)
If both companies withhold too much capacity, there is an incentive to take up the leftover slack by increasing output.
b) Incorporating Forward Contracts
(Garcia et al., (2000) and Helgesen & Tomasgard (2018)) show that the long-term contracts change the incentive structure of the Cournot oligopoly model. If an oligopoly has already committed a substantial portion of its capacity at a predetermined price, he/she will have no incentive to manipulate the market. For instance, if company A has sold \(x\) units in a forward contract at a price \(p > c\), its profit function given production levels \(q_i, q_j\) is given by eqn. (21).
\(\Pi(q_i, q_j) = P(q_i + q_j)q_i – x – c q_i + p x\) … (21)
If \(q_i = x\) then the company’s profit reduces to eqn. (22).
\(\Pi(q_i, q_j) = p – c x\) … (22)
The company i’s profit when in spot market has no effect whatsoever on the firm. Now assume both firms are contracted at the same level \(x\) at the same price we have to make sure that the Cournot equilibrium is achieved. It is worth stressing here that the best production decision is not affected by the contract price. Hence, the first order form can be represented as in eqn. (23).
\(-\frac{1}{\alpha} (q_i – x) + P(q_i + q_j) = c\) … (23)
The Cournot-Nash equilibrium can then be represented as in eqn. (24):
\(q_i^* = q_j^* = \frac{1}{3} (\alpha p – c + x)\) … (24)
The resulting market price is given by
\(P(q_i^* + q_j^*) = \frac{1}{3} p + \frac{2}{3} c – \frac{x}{\alpha}\) … (25)
Note that for high levels of contracting (e.g. \(x = \frac{D – \epsilon}{2}\)), the resulting market price reduces to
\(P(q_i^* + q_j^*) = \frac{1}{3} p + \frac{2}{3} c + \frac{D – \epsilon}{2 \alpha} = \frac{2}{3} c + \frac{\epsilon}{\alpha}\) … (26)
The interpretation above indicates that for contracting at high levels, the resulting market price can be below marginal cost.
c) Supply Function Approach
This is also known as locational marginal pricing (LMP) system or spot pricing system adopted by several markets in the United States such as PJM, NYISO, and ISO-NE and Netherlands. (Zhong (2018) and Jackson (2020)) observed that locational marginal pricing (LMP) is a tool that could provide price efficiently for each bus. However, it does not deal with market power. In essence, the marginal pricing mechanism may work well at a generation pocket but not at a load pocket. At a bus with local market power, the lack of competition can cause LMP to degrade to a pay-as-bid market.
Since an expensive resource could only influence its adjoining area, the prices at most locations may not drive up due to locational high price. On the other hand, LMP may enhance local market power at load pockets. If there is a system-wide shortage as California faced in 2000 and 2001, any market with short supply would also be vulnerable to market power. An advantage of LMP is that it can directly assign congestion costs and can signal resource shortages at specific locations, therefore it could be used in real-time to conduct a security-constrained dispatch.
The objective of a spot energy market is to increase market liquidity, provide price discovery, help real-time operations, reduce potential for market power abuse, and facilitate load participation. Frequently, the system operator conducts centralized unit commitment in the day-ahead energy market to facilitate security-constrained economic dispatch. However, having large-scale centralized unit commitment has increased uplift and opened additional gaming opportunities in a number of deregulated markets (Ajayi (2017); Østergaard & Dui (2018); Mei et al. (2017); Hasnas (2013); Helgesen & Tomasgard (2018) and Zhong (2018)).
METHODOLOGY
The philosophical stand adopted for this research was a mixed methods approach. This is for the reason that the research work aims to proffer a solution to the current lack of steady, reliable, and cheap electricity to all consumers 17 years after the implementation of the full deregulation regime. The mixed methods approach adopted to answer the research questions is a combination of Cournot and Bernard cooperative game scenario.
a) Data Collection and Sources
This research relies largely on primary data via interviews conducted and structured questionnaires distributed to a sizeable population of stakeholders that constitute the Nigerian electricity industry complemented by secondary data. Some of these sources include: Distribution Companies of Nigeria (Discos), Generation Companies of Nigeria (Gencos), Nigerian Bulk Electricity Trading PLC (NBET), Nigerian Electricity Regulatory Commission (NERC), Transmission Company of Nigeria (TCN).
b) Electricity Market Model
To improve market performance in compliance with international best practice, a wholesale zonal market strategy using the combination of Cournot and Bernard cooperative games is to be espoused. The Nash equilibrium can be obtained by plotting the graphs of demand and supply, and the point of intersection between the two curves is known as best response or Nash equilibrium.
The demand curve shows the amount of electricity consumers are willing to buy at each market price. It is normally a linear curve and can be plotted using the following equation:
\(Q = \alpha – \beta(p)\) … (27)
Where \(Q\) = quantity demand, \(\alpha\) = all factors that affect price other than price, and \(\beta\) = slope of the demand curve. The inverse demand equation can also be written as:
\(p = \alpha – \beta(Q)\) … (28)
Where \(\alpha\) = intercept where price is 0 and \(\beta\) = slope of the demand curve. The market supply curve is the horizontal sum of all individual supply curves, which shows the combined quantity supplied of electricity at different prices. The linear supply curve can be plotted using the equation:
\(p = \alpha + \beta S\) … (29)
Where \(p\) = price, \(S\) = Quantity supplied, \(\alpha\) = plots the starting point of the supply curve on the Y-axis intercept, and \(\beta\) = slope of the supply curve.
A model using Excel was developed, and the average retail price was 8.90 naira per kWh was taken oligopoly for consortium GENCOS against 11 DISCOS. The Market performance outcome at Nash equilibrium point after all other parameters are kept constant and varying the participating firms from 10-3. The results obtained were plotted and graphs recorded.
RESULTS
The result of the cooperative game on the market model optimization to determine the best and suitable model to be adopt for Nigerian electricity supply industry for both steady electricity and international best practice is recorded on Table1 and the graphs presented in Figures 1- 3:
Table 1: Market Performance
| Number of Participating Firms | Total Output | Price (Naira/kwh) | Consumers Surplus | Total Surplus |
| 10 | 798.3 | 100..8 | 159334 | 194849 |
| 9 | 792.7 | 103.6 | 157104.1 | 195005 |
| 8 | 786 | 107 | 1544449 | 195171 |
| 7 | 777 | 111.1 | 151234 | 195343 |
| 6 | 767 | 116.3 | 147264 | 195511 |
| 5 | 754.3 | 122.9 | 142236.7 | 195649 |
| 4 | 736.7 | 131.7 | 135669.4 | 195697 |
| 3 | 712 | 144 | 126736 | 195505 |
The result shows in Table 1 indicated that the Nash equilibrium was achieved with 7 Firms..
The consumer’s surplus at the Pareto optimal was N151, 234.6 and the total surplus N195, 343.6. The wholesale stands as 4.625 N/kwh, while already used the retail is 8N/kwh. The equilibrium quantity stands at 16,000kwh.
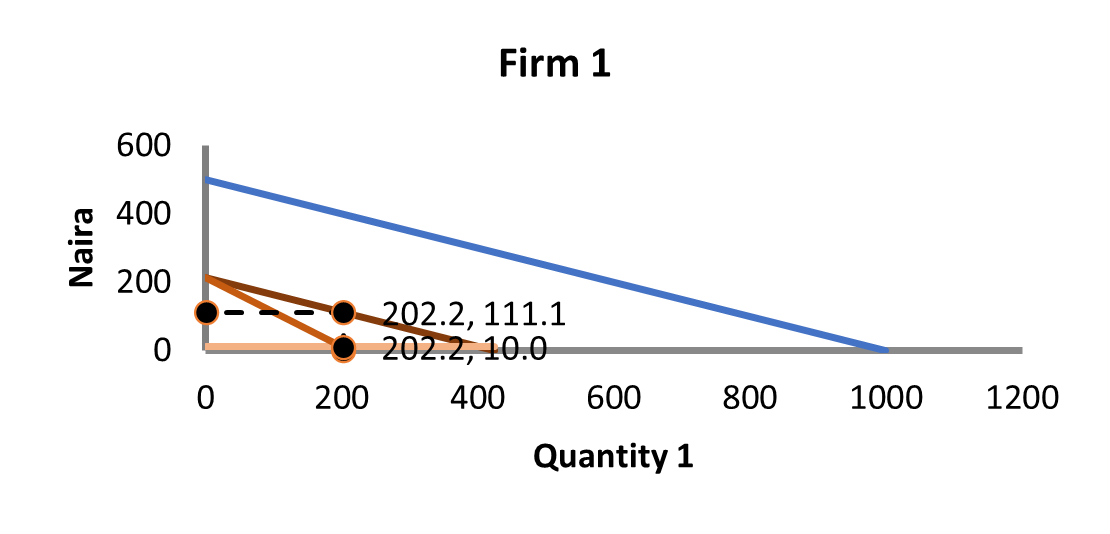
Figure 1: The NBET Decisions Graph
The graph in Figure1 shows the best respond for NBET when dealing with GENCOS is 2022. While the Firms have leverage from 100- 111.1 depending on the number of participants and output.
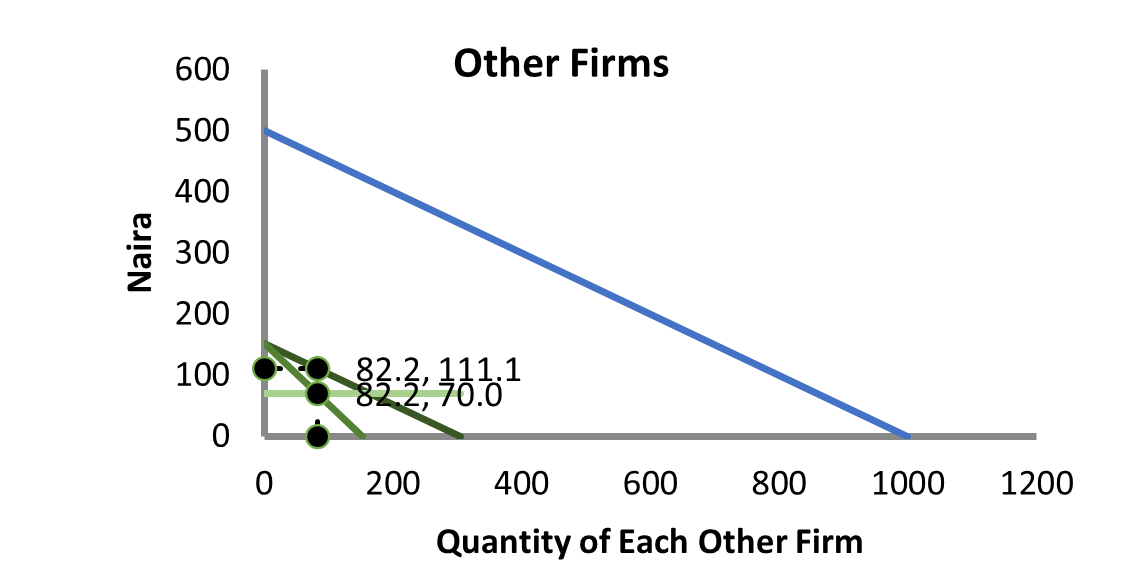
Figure 2: The Other Firms Decisions Graph
The graph in Figure 2 shows the best respond for GENCOS when dealing with NBET s 2022.
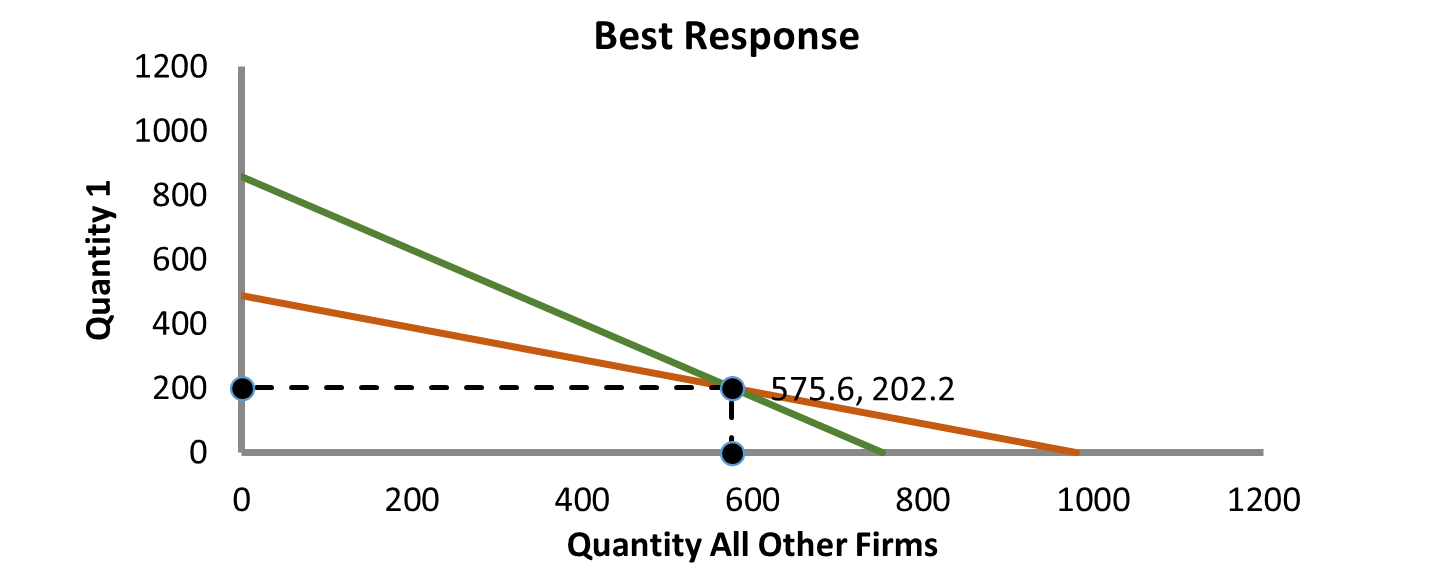
Figure 3: The Pareto optimal Graph
From Figure 3, the Nash equilibrium was reached at least when 7 firms are involved. While the at best response was 575.5:202.2, in which Pareto optimal was achieved.
CONCLUSION
Games theory has been used in modelling of the Nigerian Electricity Supply Industry market, by applied a cooperative competitive zonal market incorporating intraday to the model. In conclusion, the objectives of the research were achieved, since a suitable electricity market for the Nigerian Electricity Supply Industry (NESI) was modelled and the following conclusions were drawn:
The market value ratio at best response stands at 575.5:202.2, the consumer’s surplus value is N151, 234.6 and the total surplus N195, 343.6. The wholesale stands as N4.625 /kwh, while already used the retail is N8/kwh; the equilibrium quantity stands at 16,000kwh, therefore from the result and analysis the zonal market model incorporating intraday is suitable for Nigerian Electricity Supply Industry. The limitation of the research is the inability to incorporate MYTO scheme into the medol.
REFERENCES
- Achinanya, U. (2018). Technical Assistance on Developing the Nigerian Electricity Regulatory Commission’s Capacity to Evaluate System Planning.
- Ajayi, V. A. (2017). Essays on deregulation in the electricity generation sector.
- Alhelou, H. H., Hamedani-golshan, M. E., Njenda, T. C., & Siano, P. (2019). Events : Research Motivations and Challenges. 1–28. https://doi.org/10.3390/en12040682
- Androcec, I., Sc, M., & Wangensteen, I. (2006). Different Methods for Congestion Management and Risk Management.
- Anwar, T., Sharma, B., Chakraborty, K., & Sirohia, H. (2018). Introduction to Load Forecasting 1. 119(15), 1527–1538.
- Anyaka, B. O. (2014). Challenges of Deregulation of Electric Power Sector in a Third World Economy. 9(3), 19–22.
- Babu, A. S. and C. S. (2015). Simulation Studies on Automatic Generation Control in Deregulated Environment. International Journal of Engineering Science and Technology (IJEST), January.
- Blasch, J., Boogen, N., Filippini, M., & Kumar, N. (2017). Explaining electricity demand and the role of energy and investment literacy on end-use efficiency of Swiss households. Energy Economics, 68, 89–102. https://doi.org/10.1016/j.eneco.2017.12.004
- Bobinait, V., Konstantinavi, I., & Lekavi, V. (2012). THEORETICAL MODEL FOR ELECTRICITY MARKET PRICE FORECASTING. 17(3), 944–951.
- Chawla, A., Singh, A., Lamba, A., Gangwani, N., & Soni, U. (2019). Demand forecasting using artificial neural networks—A case study of american retail corporation. Advances in Intelligent Systems and Computing, 697(November 2018), 79–89. https://doi.org/10.1007/978-981-13-1822-1_8
- Chen, F., Liu, B., Cheng, C., & Mirchi, A. (2017). Simulation and Regulation of Market Operation in Hydro-Dominated Environment : The Yunnan Case. 1–18. https://doi.org/10.3390/w9080623Chen, T. (2018). Understanding Deregulated Retail Electricity Markets in the Future : A Perspective from Machine Learning and Optimization.
- Contreras, J., Conejo, A. J., Member, S., Torre, S. De, & Member, S. (2002). Power Engineering Lab : Electricity Market Simulator. 17(2), 223–228.
- Currarini, S., & Marini, M. (2004). A conjectural cooperative equilibrium for strategic form games. Game Practice and the Environment, 22, 224–246. https://doi.org/10.4337/9781845421441.00019
- Daneshi, H., & Daneshi, A. (2016). Real Time Load Forecast in Power System. April, 689–6
- Dietrich, K., Hennemeier, U., Hetzel, S., Jeske, T., Leuthold, F., Rumiantseva, I., Rummel, H., Sternberg, C., & Vith, C. (2005). Nodal Pricing in the German Electricity Sector – A Welfare Economics Analysis , with Particular Reference to Implementing Offshore Wind Capacities EE2.
- Dike, S. C. (2014). Legislating Security of Supply of Petroleum Resources in Nigeria: Current Practice, New Direction and Lessons from Brazil, Norway and The United kingdom.
- Edomah, N. (2017). Modelling Future Electricity : Rethinking the Organizational Model of Nigeria ’ s Electricity Sector. 5.
- Eid, C., Bollinger, L. A., Koirala, B., Scholten, D., Facchinetti, E., Lilliestam, J., & Hakvoort, R. (2016). Market integration of local energy systems : Is local energy management compatible with European regulation for retail competition ? Energy, 114, 913–922. https://doi.org/10.1016/j.energy.2016.08.072
- Eto, J. H., Berkeley, L., & Thomas, R. J. (2011). Computational Needs for the Next Generation Electric Grid.
- Fidelis Mac-Leva and Simon Echewofun Sunday. (2021). SPECIAL REPORT : Despite huge investment in power , Nigeria suffered 206 grid collapses in 9 years. 1–35.
- Garcia, A., Mili, L., & Momoh, J. (2000). Chapter 2 Modeling Electricity Markets : A Brief Introduction (Vol. 1).
- Gerard, H., Israel, E., Puente, R., & Six, D. (2017). Coordination between transmission and distribution system operators in the electricity sector : A conceptual framework. Utilities Policy. https://doi.org/10.1016/j.jup.2017.09.011
- Gibbons, R. (2018). Game Theory for Applied Economists. Princeton University Press , Princeton New Jersey.
- Hakam, D. F. (2018). Market Power Modelling in Electricity Market : A Critical Review Market Power Modelling in Electricity Market : A Critical Review. November.
- Hasnas, I. (2013). Open Innovation in a Dynamic Cournot Duopoly Arsen Palestini. 111.
- He, C. (2014). Power System Economics and Market Modeling. 1(217).
- Helgesen, P. I., & Tomasgard, A. (2018). NU SC. https://doi.org/10.1016/j.eneco.2018.01.013
- Holmberg, P., & Lazarczyk, E. (2013). Comparison of Congestion Management Techniques : Nodal , zonal and discriminatory pricing. 1–34.
- Jackson, M. O. (2013). Matching , Auctions , and Market Design. 115(December), 619–639.
- Jackson, M. O. (2020). Mechanism Theory ∗. 1–46.
- Jumba, A. M. Y. (n.d.). Application of Scenario Method in Appraising the Performance of Deregulated Nigerian Power System.
- Kirschen, D. (2020). Fundamentals of Power System Economics.
- Kratima, F. E., Gherbi, F. Z., & Lakdja, F. (2013). Applications of Cooperative Game Theory in Power System Allocation Problems. Leonardo Journal of Sciences, 23, 125–136. http://193.226.7.140/ljs/A23/125_136.pdf.
- Krysiak, F. C., & Weigt, H. (2015). The demand side in economic models of energy markets : the challenge of representing consumer behavior. 3(May), 1–10. https://doi.org/10.3389/fenrg.2015.00024
- Lazarczyk, E. (2012). Nodal , zonal and discriminatory pricing Pär Holmberg and Ewa Lazarczyk. April.
- Leyton-Brown, K., & Shoham, Y. (2008). Essentials of Game Theory. In Essentials of Game Theory. https://doi.org/10.1007/978-3-031-01545-8
- Limpaitoon, T. (2012). Cap-and-Trade Modeling and Analysis: Congested Electricity Market Equilibrium. Doctor of Philosophy in Engineering – Industrial Engineering and Operations Research University of California, Berkeley.
- Liu, H., Huang, K., Yang, Y., Wei, H., & Ma, S. (2018). Real-time vehicle-to-grid control for frequency regulation with high frequency regulating signal. 1–8.
- Lokhande, K. M., & Satkar, U. (2016). TRANSMISSION MANAGEMENT IN DEREGULATED POWER Department Of Electrical Engineering , Shri sai Polytechnic. Journal of Information , Knowledge and Research in Electrical Engineering(ISSN 0975-6736), 537–541.
- May, R. (2015). The U . S . Electricity Industry after 20 Years of Restructuring Severin Borenstein and James Bushnell. May. https://doi.org/10.1146/annureveconomics-080614-115630.1
- Mei, S., Wei, W., & Liu, F. (2017). On engineering game theory with its application in power systems. 15(1), 1–12. https://doi.org/10.1007/s11768-017-6186-y
- Mohammadi, A., & Rabinia, S. (2019). A Comprehensive Study of Game Theory Applications for Smart Grids, Demand side Management Programs and Transportation Networks. Smart Microgrids: From Design to Laboratory-Scale Implementation, 57–64. https://doi.org/10.1007/978-3-030-02656-1_5
- Momoh, J. (2021). How Nigerians suffer from poor electricity regulation. 1–8.
- Morgenstern, O. (2018). normal form. 1–33.
- Nisan, N., & Ronen, A. (2001). Algorithmic Mechanism Design. Games and Economic Behavior, 35(1–2), 166–196. https://doi.org/10.1006/game.1999.0790
- Ohiare, S. M. (2014). Financing rural energy projects in developing countries: a case study of Nigeria. Energy for Sustainable Development, 54(16), 256–290.
- Østergaard, P. A., & Dui, N. (2018). energies Toward an E ffi cient and Sustainable Use of Energy in Industries and Cities. June 2018, 1–28.
- Petrosian, О. (n.d.). Zero-sum Games in Normal Form and Matrix Games Colonel Blotto Game.
- Pražák, P., & Kovárník, J. (2018). Nonlinear Phenomena in Cournot Duopoly Model. https://doi.org/10.3390/systems6030030
- Rawas, F. (2020). No Title. August.
- Saglam, I. (2018). Ranking Supply Function and Cournot Equilibria. 1989. https://doi.org/10.3390/g9030060
- Sambo, A., Garba, B., & Zarma, I. H. (2010). Electricity Generation and the Present Challenges in the Nigerian Power Sector. January.
- Sarfati, M., Reza, M., & Holmberg, P. (2019). Production efficiency of nodal and zonal pricing in imperfectly competitive electricity markets. Energy Strategy Reviews, 24(August 2018), 193–206. https://doi.org/10.1016/j.esr.2019.02.004
- Siemens AG. (2019). Electrification Roadmap for Nigeria – Technical and Commercial Proposal.
- Tangerås, E. L. and T. P. (2017). Cournot Competition in Wholesale Electricity Markets : The Nordic Power Exchange , Nord Pool Erik Lundin and Thomas Tangerås Cournot Competition in Wholesale Electricity Markets : 1191.
- Ukoka, Kalu and AgbaezeE.KCampus, E. (2018). Deregulation of the Nigerian Power Sector on Performance : A Review. European Journal of Scientific Research ISSN 1450-216X / 1450-202X Vol. 148 No 3 February, 2018, Pp. 377-385 Http://Www. Europeanjournalofscientificresearch.Com, 148(3), 377–385.
- Wang, Z., & Lo, K. L. (2016). Game Theory Application and Strategic Bidding in Electricity Supply Market. World Journal of Engineering and Technology, 04(03), 72–81. https://doi.org/10.4236/wjet.2016.43d010
- Watch, P. S. (2021). Nigeria ’ s Electricity Supply Industry Highlights. February, 1–3.
- Woodruff, I. D., & Woodruff, I. (2019). An Optimization Approach Based on the Interior- Point Methodology for the Tertiary Control of Modernized Microgrids An Optimization Approach Based on the Interior-Point Methodology for the Tertiary Control of Modernized Microgrids.
- Yoon, Y. T. (2001). Transmission Expansion in the New Environment. 9.
- Yu, M., & Hong, S. H. (2017). Incentive-based demand response considering hierarchical electricity market : A Stackelberg game approach. Applied Energy, 203, 267–279. https://doi.org/10.1016/j.apenergy.2017.06.010
- Zhang, Y., Gu, C., Yan, J., & Li, F. (2019). Cournot Game Based Multi-Supplier Local Energy Trading er Local Energy Trading the Zhang feasibility of using the heat temperature function for a long-term district heat demand forecast. Energy Procedia, 158(October), 3528–3533. https://doi.org/10.1016/j.egypro.2019.01.916
- Zhong, J. (2018). Power System Economic and Market Operations.