
Assessment of the Influence of Agricultural Activities on the Quality of Ofu River, Kogi State.
- Simon Daniel
- Idoko Ojochenemi
- Haruna Sule Abutu
- Balogun Grace Foluke
- 253-265
- Sep 23, 2023
- Agriculture
Assessment of the Influence of Agricultural Activities on the Quality of Ofu River, Kogi State.
1Simon Daniel, 2Idoko Ojochenemi, 3Haruna Sule Abutu & 4Balogun Grace Foluke
1,2,4Department of Geography and Environmental Studies, Prince Abubakar Audu University
3Food and Strategic Reserve Department, Federal Ministry of Agriculture, Abuja, Nigeria
DOI: https://doi.org/10.51244/IJRSI.2023.10820
Received: 21 August 2023; Revised: 10 September 2023; Accepted: 14 September 2023; Published: 23 September 2023
ABSTRACT
Catchment of aquatic ecosystems are currently used for agriculture due to alluvial deposit and this practice contribute to water quality deterioration. Furthermore, the surging growth in human population and the need for increased food production increase agricultural expansion through application of both organic and inorganic fertilizers to crops growing within and around the urban catchment. This study was aimed at assessing the influence of agricultural activities on the quality of Ofu River, Nigeria. to achieve the above goal, the paper placed more emphasis on identifying the perceived effects of fertilizer application quality of the water, the study employed field survey to collect to collect random soil and water samples. Laboratory analysis were used to determine to determine their physicochemical parameters. Both descriptive and inferential statistics were performed using Statistical Packages for Social Sciences (SPSS) IBM version 25. The results revealed that 3.39% at S1 were civil servants, 51.4% were farmers and 11.6% of the total population were petty traders. Also, at S1, 20.8% of respondents had farms between10km-40km but 4.85% was 41km-70km respectively. 30.5% of the total respondents alluded to be applying fertilizers to their farm but 15.0% and 12.6% either applied nor had ideas about it. 35.8% applied NPK, 19.4% used super phosphate. P< .05. The study recommends that Other economic activities that may not have direct impact on Ofu River should be encouraged and buffer zones be created within Ofu River basin.
Keywords: Influence, Agriculture, Catchment, River, Water and Quality.
INTRODUCTION
The need for sustainable agricultural development, environmental management and conservation of the nature resource-base has been advocated by the Food and Agricultural Organization (FAO, 2019). This is geared towards orientation of the technological and institutional change in such a manner that would ensure the attainment and continued satisfaction of human needs for the present and future generations (FAO, 1990a). While agricultural practices in the developed countries depend largely on multiple sources of water for the production of crops and animals, the story is different in the developing counties where agricultural practices influences water pollution in and around the watershed.
Water quality degradation can be attributed to many factors (Poff et al., 2006). High population explosion in developing countries, increase use of agrochemicals has been identified as one of the leading factors responsible for water quality deterioration (Poff et al., 2006), Helman et al (2007), Guo et al 2021) For instance, studies have shown that high population explosion and its attendant food demand is responsible for the expansion of agricultural activities in river catchments in developing countries. Increased application or use of inorganic fertilizers and pesticides agricultural activities within the catchment area has immense impact on various ecological and hydrological processes that influence the river water quality and water safety for use. These include the discharge of nutrient-rich animal waste into the rivers, lakes and other surface water through soil runoff (Sunways, 2022). Dissolve nutrient may also percolate into ground water resulting to ground water pollution Cesoniene et al., (2019). Therefore, wetland conversion can significantly affect entire aquatic ecosystem of any given catchment area Yadav, Barbel and Shrestha (2019).
Previous studies have focused majorly on assessing the existing relationships between surface water quality and agricultural land use patterns (Camara et al., 2019). However, few studies have been conducted on Anyigba region for the last sixty years. nearly 33.3% of the entire cosmic landmass has been changed out of which seventy five percent of the changes are attributed to human activities (Wrinkler et al., 2021). The influence of human activities on the surface water quality been manifested in the hydro-geo biochemical cycles where high stream discharges are accompanied with sediment and nutrient influxes which lowers the water quality (Ni et al., 2021).
Therefore, understanding how agricultural activities affect water quality is essential to ensure sustainability of riverine ecosystems (Wagner et al., 2019). This is particularly important because good water quality is essential for sustainable agricultural production, human health, and ecological/habitat stability (Samways, 2022). Thus, improving the surface water quality is the top priority to effectively recover the global economy and engender social and sustainable development (Sivakumar, 2021).
To gain deeper insight into the subject matter, this paper seeks to assess how agricultural activities affects water quality in the study area. The findings would not only improve the quality of surface water but will also contribute greatly to land use management planning and effective protection of water ecological environment resources (Ambanta et al., 2018). Table 1 and figure 1 reveals the geographical description of the sample sites for the study and the study area map.
Figure 1: The Study Area
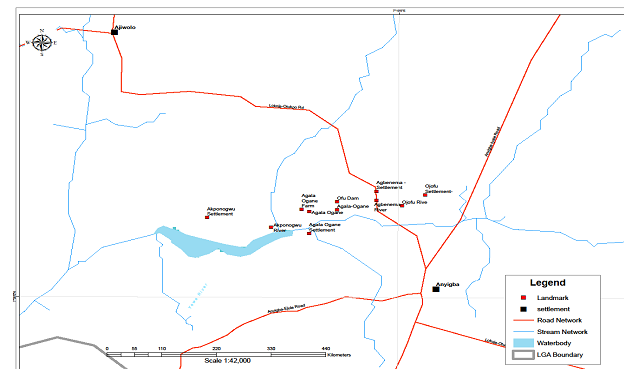
Source: Author’s Field Survey, 2023.
The Study Area
The study was carried out on Ofu River Basin, Anyigba located between latitude 70 15´ -70 29´E of the Greenwich Meridian and longitude 70 11´ -70 32´´N of the equator. The study area has an average altitude of about 385 meters above mean sea level (figure 1). Describing the study area, figures 1 and 2 depict the locations of the sampling sites for the study. The control station (Ojofu) lies between lat. 7o31´39.43´´ and longitude 7o10´ 3.59´´E. Agbenema settlement is between lat. 7o9´40´´N -7o 3’46´´E. while the third sampling site Agala-Ogane is between lat. 7o 31´35N and long. 7o 8´ 33´´E. for Akponogwu Sampling point is between lat. 7o 31´ 15.49´´N and long. 7o 7´6.62´´E (see figure 1 and table 1 ).
METHODS AND INSTRUMENTATION
Soil samples were separately collected and air-dried at room temperature, crushed, homogenized, and passed through a 2 mm sieve, soil organic carbon content was determined by the walkey Black titration method (Nelson and Sommers, 1982). Soil total nitrogen was determined using the Kjeldahl distillation method (Okalebo et. al., 2002). Soil potassium, nitrate, potassium, magnesium, Sulphur, total nitrogen, phosphorus was analyzed through the use of inductivity couple plasma spectrophotometer (ICPS). The soil pH was determined using a pH meter.
A Perception study has been undertaken to describe the effects of agricultural activities on Ofu River water. The sampling stations were labelled S1-S4. S1 represents Ojofu settlement, S2 standing for Agbenema, S3 represents Agala-Ogane and S4 represents Akponogwu sampling station. These are human settlements along Ofu River covering the upper, middle and lower courses of Ofu River. The nature of data for this study included data on the occupation of respondents, distance of respondents’ farm from Ofu River, application of fertilizers to farms, the types of fertilizers used by respondents and perceived effects of agricultural activities on Ofu River watershed. Both primary and secondary data sources were adopted and data collection instrument was questionnaire administration. The appropriate design adopted was the survey type. Simple random sampling technique was used while Mugenda and Mugenda (1999) method was adopted to determine the sample size of two hundred and six (206) respondents. The statistical techniques used were both descriptive and inferential statistics including the use of charts and tables while cross tabulation/contingency table was applied to test the significance of the stated hypothesis.
The aim of this study was to assess the influence of agricultural activities within the catchment of Ofu River. The following objectives has been formulated to guide the study: describe the type of fertilizers used by farmers and to describe the effects of agricultural activities on the quality of Ofu River. The hypothesis statement was established to determine if there is statistically significant effect of land use change types on Ofu water quality. Several studies including but not limited to Jayash et al. (2020), Camara et al., (2019), Samways, (2022), Laura, (2020), Ambata et al., (2018), Guo et al., (2016) and Musa, Simon and Ogidiolu (2019) looked at water quality determination, land use type identification, downstream river water management and the topography and erosional activities of the watershed but non-examined agricultural activities within the watershed and its effects on Ofu River quality, Anyigba. To this end, this study analyses the effects of agricultural practices on Ofu River quality.
Table 1: Geographical Description of the Sampling Stations
| Sampling codes | Name | Latitude of sample site | Longitude of sample site | Major Land use type | Altitude |
| S1 | Ojofu
(Control) |
70 31´39.43´´E | 7010´3.59´´N | Built-up/Forest/agriculture | 249m |
| S2 | Agbenema
(Experimental) |
70 9´40´´E | 703´46´´N | Built-up/Agriculture | 262m |
| S3 | Agala-Ogane
(Experimental) |
70 31´35´´E | 708´33´´N | Built-up/Agriculture | 299 m |
| S4 | Akponogwu
(Experimental) |
70 31´ 15.57´´E | 70 7´ 6.62´N | Built-up, Refuse dump/Agriculture | 254m |
Source: Author’s Field Survey, 2023.
RESULTS AND DISCUSSION
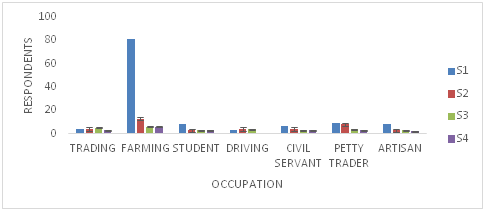
Figure 2: Occupation of the Respondents.
Source: Author’s Field Survey, 2023.
Based on the results presented in figure 2, 81(39.3%) of the total study population at S1 (Ojofu) were crop farmers while 9 respondents representing 4.36% of the total population were petty trader with 1.45% as drivers. As shown in figure 2, respondents representing 6.31% in S2 (Agbenema) were farmers but for S3 and S4 (Agala-Ogane and Akponogwu), only 2.91% of the total population were farmers. 106 respondents representing 51.4% were farmers in the study area. This is slightly less than half of the study population. This shows that a good number of the respondents practice agriculture. This activity in the study area exposes the soil at a distance not too far from Ofu River water.
As shown in figure 2, S1-S4 represents the sample stations. Respondents representing 3.39% were civil servants at S1 (Ojofu) while S3 and S4 (Agala-Ogane and Akponogwu) had the least number 4(1.94%) of civil servants respectively. 9(4.36%) were petty traders at S1 (Ojofu) while S4 (Akponogwu) has the least number of petty traders 3 representing 1.45% of the total population. 8 respondents representing 3.88% of the total respondents at S1 (Ojofu) were artisans representing the highest number of artisans in the study locations (figure 2). The table suggests that farming (51.4%) is the most patronized occupation followed by petty traders (11.6%) then students (8.73%) of the total study population. The result indicates that more than half of the respondents were crop formers implying that a lot of agricultural activities takes place in the study area. The land clearing and tilling of the soil could expose the soil elements which will be washed into the river thereby degrading the water and its ecosystems. The advent of Ofu River’s Mini Earth Dam has brought to be different agricultural activities such as growing of food crops. In an attempt to enhance the soil fertility, fertilizers are applied to the soils of the river basin but Ray and Kookai (2021) reported that the impact of phosphorus (P) and N-rich sediments could cause eutrophication leading to significant growth of algae resulting in lower DO level in water due to higher percentage of farmer engaged in clearing and tilling the land strife maximize productivity and endangering the integrity of the nearby water bodies.
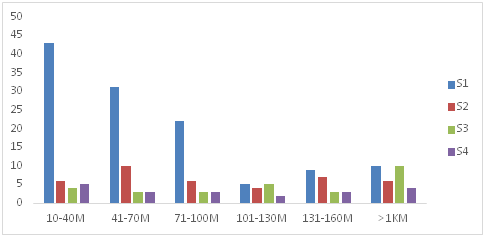
Figure 3: Distance of Respondents’ Farm from Ofu River Water.
Source: Author’s Field Survey, 2023.
Figure 3 shows the proximity of cultivated lands to Ofu River water. 20.8% of the total respondents at S1 (Ojofu) has their farms between 10m to 40m away from Ofu River. Only 2.42% and 4.85% are farming between 101m and 1km and above. At S2 (Agbenema), 2.91% of farmer has their farms about 40m away from Ofu River water but 4.85% at S2 (Agbenema) were farming between 41m to 70m away from Ofu River. At S3 (Agala-Ogane), 4.85% respondents farm at a distance more than 1km from Ofu River. The table infer that 21.8% of the total population farm 10m to 40m, 22.8% between 41m to 70m away from Ofu River Water but 14.5% of the total population farm at a distance of more than 1km away from Ofu River. Figure 3 alludes that 50.9% respondent’s farm at a distance not more than 70m away from the river water. This indicates the possibility of unconsolidated soil materials (sediments) and other agricultural inputs to be washed into the river thereby decreasing the integrity of the river and its ecosystems.
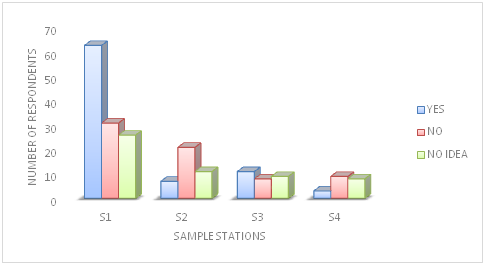
Figure 4: Application of Fertilizers to Farms.
Source: Author’s Field Survey, 2023.
Agriculture is widely acknowledged to be a leading cause of water pollution. Figure 4 reveals that 30.5% of the farmers in S1 (Ojofu) allude to application of fertilizer to their crops. 15.0% and 12.6% neither apply fertilizer to their crops nor had ideas about fertilizer application to crops. The study location with least fertilizer application was S4 (Akponogwu) having 1.45% of the total respondents using fertilizer on their farms. 12.6% of the total respondents had no idea about fertilizer application at S1 (Ojofu) study area. Based on the result presented in table 3, 40.7%, 33.4% and 26.2% of the total respondents do apply fertilizers, do not apply and has no idea about fertilizer application on the farm. A high number of the respondents apply fertilizer to their crops at the river bank. This can stimulate water pollution. In a study conducted by Halman et al (2017), it was reported that sediment materials are sensitive to environmental fluctuations, particularly external input sources. The study was focused on bacteria distribution and the effects of Inflow Rivers in relation to sediment flows from agricultural lands. The result indicated that delta, beta and gamma protobacteria were the major classes present in sediments
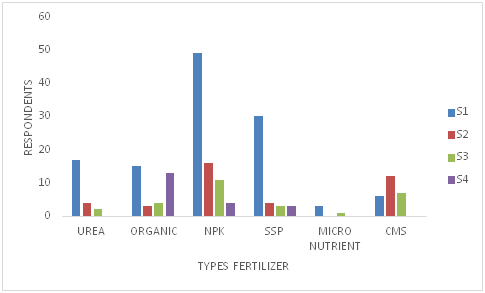
Figure 5: Types of Fertilizer Used on the Farm.
Source: Author’s Field Survey, 2023.
Several types of fertilizers exist based on the peculiarity of the soil. Figure 5 reveals the types of fertilizer used by farmers along the bank of Ofu River. The table reveals that the most patronized fertilizer is NPK (38.8%) of the total population apply it to their farms closely followed by super phosphate with 19.4%, micro-nutrient fertilizer (1.94%) application rate in the study area. One of the most mobile elements in inorganic fertilizers is nitrogen. This element can move easily within the soil and could affect both surface and underground water sources. The result alludes that diverse forms of inorganic and organic fertilizers are been used on the farms along Ofu River watershed. This indicates that these organic and inorganic fertilizers could move in the soil and runoff into the river water thereby damaging the quality of Ofu River water. In the words of Jayash and Christine (2020), agricultural fertilizer use is widely acknowledged to be a leading cause of water pollution, yet no national estimate exists on the effect of fertilizer application on concentration of agricultural pollutants in the United States watershed.
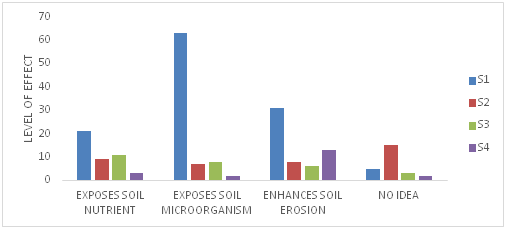
Figure 6: Perceived Effects of Agricultural Activities on Ofu River Water Quality
Source: Author’s Field Survey, 2023.
Agricultural pollution comprises of liquid, solid and gaseous wastes from all types of farming activities including runoff from pesticides, fertilizer use and from feedlots. As shown in figure 6, perceived effects of agricultural activities among the sampling locations range from exposure of soil nutrients to enhancement of soil erosion in the study area. Among the four sampling locations, S1 (Ojofu), 30.5% reported exposure of soil microorganisms while 15.0% of the total respondents observed soil erosion but 2.42% had no idea on effects of agricultural practices on Ofu water quality. At S2 (Agbenema), 4.36% still reported nutrient exposure, 3.39% reported exposure of soil microorganisms while 3.88% opined that agricultural activities enhance soil erosion in the study area. S3 (Agala-Ogane) reveals that 5.33% respondents opined the effect of nutrient exposure but 1.45% had no ideas about the subject matter. The overall analysis reveals that 21.3% of the total population reported soil nutrient exposure, 38.8% observed exposure of soil microorganisms while 28.1% reported aggravation of soil erosion in the study area but 9.70% had no idea on the subject matter. This finding could be as a result of some local /traditional knowledge the respondents had from their predecessors. These results indicate that the respondents have some ideas about the effects of agricultural practices on the Ofu River water quality but yet did not do anything to mitigate the negative impacts of it, hence, this finding could assist in the management of the river water.
This finding is consistent with the study conducted by Lawal and Lohdip (2013), where the duo assed the impacts of agricultural activities on water quality. These scientists used integrated wireless network to determine the effects of agriculture on water quality. Specifically, it was foud that fertilizer application in river catchment release nutrients (eutrophication) into water bodies. Other impacts of agricultural intensification in the river catchment include pesticides & herbicides pollution and biological contamination. In other word, the research identified effects of agricultural production processes on any water body to include: nutrient enrichment, deterioration of water quality, destruction of sprawling grounds for aquatic and marine lives. The finding concluded that sustainability implies that agriculture not only secure a sustainable food supply but its environmental, socioeconomic and human health impacts are recognized and should be accommodated within the national development plans. In the work of Leah, Erman, Buckley and Bradley (2019). It was reported that the runoff irrigation return -flow can carry excess nutrient, pesticides and sediments which adversely affect the river water quality. The results of this research by Lear et al (2019) showed that water quality indicators did changed significantly between 2003 and 2017 in the study area.
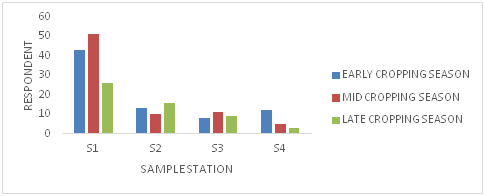
Figure 7: Period of fertilizer application by farmers
Source: Author’s Field Survey, 2023.
Different crops have different timing for fertilizer application. As presented in figure 7 on period for fertilizer application across the four (4) sampling locations, at S1 location, 20.6% reported early cropping season while 24.7% observed mid cropping season but 12.6% reported late cropping season. At S2, 4.85% opined mid cropping season, 7.76% reported late cropping season but 6.31% reported early cropping season. At station S3, 5.33% reported mid cropping season and 4.36% observed late cropping season (figure 7). The result reveals that 73.7% of the total respondents apply both organic and inorganic fertilizers to their crops at both early and mid-cropping seasons. These results also show that the soil of the study locations is poor hence the need for the application of fertilizers to enhanced crop productivity. The statistics also implies that at early and mid-cropping seasons, fertilizer application was high S1 Ojofu, 43 (20.6%) and 51 (24.7%) respectively. Due to the terrain of the study area and its high erosivity index encouraged greater runoff and erosion of disaggregated soil materials due to agricultural practices into the nearby Ofu River which will further degrade the Ofu River water quality.
The results of this study show that the application of chemical fertilizers on crops around Ofu River Bank has increased significantly since the advent of Ofu Mini Earth Dam project. The increased application of chemical fertilizers around Ofu River lands are likely to create non-point contamination sources of chemical fertilizer contamination of Ofu River Water. The result above agrees with Leslie, (2010). The research opined that agricultural pollution occurs when water banks are cultivated. The researchers further observed that chemicals from fertilizers make their way into both surface and ground water that ends up as drinking or potable water. They further reported that health related issues may occur as it contributes to a disease called blue-baby syndrome which cause death in infants. Their study combined a number of spatial datasets relating to agricultural land use, residential and industrial activities, to examine the major economic influence on the ecological quality of water resources in Ireland using applied qualitative determinants of water quality. The results also indicated that the level of forestry, industrial activities, the intensity and types of agriculture activities and the type of waste generated in the area are all critical factors affecting water quality resources.
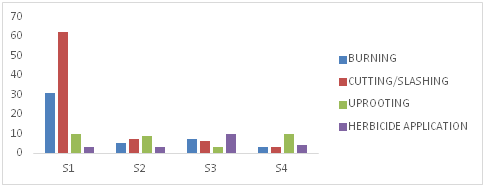
Figure 8: Methods of land preparation for Agricultural Purposes.
Source: Author’s Field Survey, 2023.
Based on the results presented in figure 8, four (4) methods of land preparation for agriculture activities were identified (figure 8). At study location S1 (Ojofu) 15.0% of the total respondents were engaged in bush burning as method for land preparation. 3.88% at S2 (Agbenema), 1.45% at S4 (Akponogwu) also use the same method for land preparation. 30.0% at S1 (Ojofu), 2.91% at S3 (Agala-Ogane) and 1.45% at S4 (Akponogwu) employed cutting and slashing method of land preparation. Uprooting of trees before cultivation, S1 (Ojofu) stands at 4.85%, S4 (Akponogwu) was 4.85%. The application of herbicides, S1 (Ojofu) was 7.28%, S2 (Agala-Ogane) 5.82% while the least was S4 (Akponogwu) with 1.94% of the total respondents. This method of land preparation could be as a result of the subsistent nature of agricultural production in the study area. This result implies that each of these methods has a pronounced and profound effect on the ecological system including the water bodies. In the words of Daniel et al., (2021) stumping or uprooting of trees before cultivation disaggregates/disintegrates the hitherto cohesive soil particles, cutting, slashing and burning exposes the surface of the soil to erosion while the application of herbicides could contaminate or reduces the integrity of both the soil and water ecosystem within the study area.
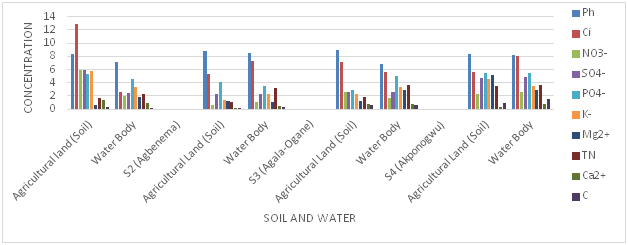
Figure 9: Concentration Level of physicochemical parameters between Agricultural land (soil) and water bodies of the study area
Source: Author’s Field Study, 2023.
Figure 9 presents the physicochemical parameters of Ofu River water and adjoining watershed. Accordingly, at S1 (Ojofu), pH of agricultural land (8.30 mg/l) while that of water (7.30mg/L) showing a close relationship. Chloride concentration in agricultural land (12.89mg/l) but water (2.66mg/l). Nitrate in agricultural land (5.90mg/l) but water (4.59mg/l). Total nitrogen (TN) in agricultural land (1.76mg/l) while that of water (2.39mg/l). Again, phosphorus in agricultural land (5.80Mg/l) while that of water (3.34Mg/l). This finding shows a possibility of physicochemical parameters of soil drifting into the nearby Ofu River through runoff. Though in some cases, the concentration of these parameters is higher in water and a times soil. Aside soil-water chemical interactions, other natural factors may be responsible for Ofu Water pollution at different sampling points. The result reveals that Ofu River water is not fit for human consumption since some of the physicochemical parameters are beyond WHO, NSDWQ and EU potable water thresholds. This finding supports Sarita, Jawed, Muhander and Harrinder (2019). The researchers studied the relationship between the concentration of physicochemical parameters both in agricultural lands and water in Motia Lake Reservoir. PH, Phosphorus, Total Nitrogen and potassium were studied. The result showed that pH, TN, Ca, Mg, Cl, NO3, and PO4 were recorded higher at the pre monsoon in water. The results of physicochemical parameters in soils of agricultural land and water at different sampling stations clearly indicate high productive nature of the study area. It was also inferred from the results of water quality and soil analysis showed that water pollution of Ofu River at different sampling stations were as a result of intensive agricultural activities within the basin.
The figure 9 also shows the concentration of physicochemical parameters at S2 (Agbenema). PH of agricultural land (8.80Mg/L) and water (8.50Mg/L). The figure also shows that chloride was more in water (7.23Mg/L) than agricultural lands (5.34Mg/L) but sulphate in agricultural land (2.33Mg/L) while that of water (2.27Mg/L). Phosphate concentration in agricultural land (4.12Mg/L) and water (3.55Mg/L). This finding is in line with Laura (2020). The study reported that fertilizer application to crops within the watershed has ripple effects in the food web of streams and rivers water quality. The researcher also found that some agricultural methods could increase pollution in some streams.
The study combined 184 studies drawn from 885 individual experiment around the globe investigating the effects of nitrogen and phosphorus, the main component of fertilizers in streams and rivers. The study reported that pollution can run farms within the river basins into adjacent streams as well as from waste water discharges. These pollutants result in high algae blooms and can lead to reduction in BOD resulting in fish kills.
At S3 (Agala-Ogane), pH concentration in agricultural land (8.90Mg/l) in water (6.90Mg/l). Chloride in agricultural land (7.11Mg/l) but water (5.90Mg/l). Nitrate in agricultural land was more (2.62Mg/l) than in water (1.72Mg/l). Phosphate in water was higher (4.98Mg/l) in agricultural land and (2.96Mg/l) in water. Carbon concentration was lower in agricultural land (0.60Mg/l) than in water (0.71Mg/l). The findings of this research revealed that same component of physicochemical parameters existed both in soil and water of the study area. It could be inferred that due to the sloping terrain of the watershed, physical and chemical materials due to excessive runoff had entered into Ofu River water thereby degrading its quality. This finding supports Nor, Irum, Naila and Shomaila (2015) and Sivakumar (2021). Reported that soil physicochemical parameters profusely influence water and many life related processes of aquatic ecosystem. They further observed that physical and chemical properties of soil control many soil processes and also have profound effects on the growth of plants river water quality.
At S4 (Akponogwu), there existed a close range of pH concentration between agricultural land (8.40Mg/L) and water (8.30Mg/L) respectively. Closely related also was nitrate concentration in agricultural land (2.33Mg/l) but a bit higher water (2.56Mg/l). Phosphate in agricultural soil (5.49Mg/l) and water (5.53Mg/l). The figure also revealed that carbon was higher in water (1.49Mg/l) in water than in agricultural land (0.94Mg/l). The higher concentration of physicochemical parameters at S4 could be as a result of its downstream status. Most of the surface runoff flows downstream which could increase concentration level in both soil and water.
The finding above supports Mendivil, Amabilis and Rodriquez (2020). The study established the concentration of TN and TP in the middle and lower basins and water quality information were gotten from between 2013-2018 during the rainy season. The result showed coefficient of determinant was < 0.2 although quantifiable nutrient concentration was higher. The result suggest that intensive agricultural practices generate accelerated loss of soil consolidation, which is transported to water bodies
RESEARCH FINDINGS
- Majority of the respondents agreed that crop-farmers used different types of fertilizers to improve crop yield.
- Only 3. 20% of the respondents applied fertilizer at the early cropping season at S1, while 16% and 12% did that at S2 and S4 respectively.
- It was also revealed that agricultural land use (crop cultivation and animal production) is the major land use type within and around Ofu River Basin. This type of land has significant effects on Ofu water quality in the area.
- It was discovered that cutting and slashing were the major methods of land preparation in the study area exposing the surface to more environmental hazards like soil to erosion
| Pearson Chi-Square | 29.751a | 12 | 0.003 |
| Likelihood Ratio | 27.636 | 12 | 0.006 |
| N of Valid Cases | 206 |
a. 8 cells (40.0%) have expected count less than 5. The minimum expected count is 1.29.
Decision Rule: Since the asymptotic value (p< .05) H1 is accepted. In other words, land use types have statistically significant specific or cumulative effects on the environment of the study area.
RECOMMENDATIONS
- Other economic activities that may not have direct impact on Ofu River should be encouraged.
- Buffer zone should be created within Ofu River watershed.
- Awareness on the implication of the use of chemical fertilizers should be enhanced.
- Cutting and slashing method of farmland preparation should be discouraged due to its effects on the soil and water quality in catchment.
CONCLUSION
As revealed by the findings of this study, diverse types of agricultural activities and processes occur at the watershed. This to a large extent has always degraded the river water quality. Affecting the water ecosystem and all life-forms that depends on the river for livelihood. It could be concluded that agricultural processes within and around Ofu River basin has significant effects on Ofu River quality through the following ways:
- Runoff from fields: When it rains or snow melts, water carries soil, fertilizers, and pesticides from fields into rivers and streams. This runoff can pollute drinking water and make it unsafe to swim or fish in.
- Animal waste: Animal waste from farms can contaminate water through runoff, spills, and leaks. This waste can contain harmful bacteria and viruses that can make people sick.
- Irrigation: Irrigation water can carry salts and other pollutants into rivers and streams. This can make water unsafe to drink and can damage aquatic ecosystems.
- Pesticides: Pesticides can runoff from fields into rivers and streams. These chemicals can harm fish and other aquatic life, and they can also make drinking water unsafe.
- The impact of agricultural pollution on drinking water can vary depending on the specific agricultural practices in place, the climate, and the geology of the area. However, in general, agricultural pollution is a major threat to drinking water quality around the world.
- There are a number of things that can be done to reduce agricultural pollution and protect drinking water. These include:
- Using less fertilizer and pesticides: Farmers can reduce the amount of fertilizer and pesticides they use by planting cover crops, rotating crops, and using integrated pest management techniques.
- Storing animal waste properly: Farmers can store animal waste in properly designed and managed lagoons or tanks. This will help to prevent runoff and spills.
- Using better irrigation practices: Farmers can use drip irrigation or other methods that minimize water runoff.
- Protecting water sources: Farmers can plant buffer strips of trees and shrubs around streams and rivers to help filter runoff water before it reaches drinking water sources.
- By taking these steps, farmers can help to protect drinking water quality and ensure that everyone has access to safe, clean water.
REFERENCES
- Ambanta B.O., Bateni, F., Fakheran, S. and Soffianian, A. (2018). Assessment of Land Cover Changes and Water Quality Changes between 1977-2008. Environ Monit Assess 185: 10511-10519.
- Camara, M, Jamil, NR. Bin Abdullah, AF (2019). Impact of Land Uses on Water Quality in Malaysia a Review: Process 8: 1-10.
- Casoniene L., Dapkiene M., Sileikiene, D., (2019). The Impact of Livestock Farming Activity on the Quality of Surface Water. Environ Sci. Pollut Res.26:32678-32686.
- Daniel A. Akuali, Carolien Kroezer, Gertjan Medema, PeterBureck and Heather Mumby (2021). Modelling Rotavirus Concentration in Rivers: Assessing Present and Future Microbial Water Quality. Water Research, 204 (4); 123-135.
- Food and Agricultural Organization (FAO, 2009a). State of Food and Agriculture. Food and Agriculture http:www.fao.org
- Guo, X., Yan, Q., Tan, X., and Liu, X., (2016). Spatial Distribution of Carbon Emission Based on DMSP/OLS Night time light data and NDVI, World Regional Studies 25:102-110.
- Halman Wu, Jing Jang, Lihua Niu,Werilong Zhang and Wei Lal (2007). Sediment Bacterial Communities in Eutrophic Lake Influenced by Multiple in-flow Rivers. Environmental Science and Pollution, Vol., 24 19795-19806.
- Jayash Pandel and Christine L. Crago (2020). Environmental Externalities from Agriculture: evidence from Water Quality. American Journal of Agriculture and Economics. https://doi.ord/10.1111/ajea.12130.
- Jayash Pandel and Christine L. Crago (2020). Environmental Externalities from Agriculture: evidence from Water Quality in the United States. American Journal of Agriculture and Economics. https://doi.ord/10.1111/ajea.12130.
- Laura Oleniacz (2020). Fertilizer Runoff in Streams and Rivers. J. Agric. Econ. 25(1): 195-212.
- Lawal, R and Lohdip, Y., (2015). Physicochemical and Microbial Analysis of Water, Nigeria. Afri J Nat SCI, 1119-1104.
- Leah, G., Erman, S.M., Buckley, H.L., Bradley, S.C, (2019). Connecting Through Space and Time. Catchment-Scale Distribution of Bacteria in Soil, Stream water and Sediment. Environmental Microbiology 6 (2): 253-268.
- Leslie, D. (2010). The causes of Health Effects of River Pollution: Kwameh Unkrumah University of Science and Technology Working Papers.
- Mendivil-Garcia, K., Amabilis-Sosa, L.E., Rodriquez-Mata, A, E (2020). Assessment of Intensive Agriculture and Water Quality, Sci Pollut Res.27, 28636-28638.
- Mugenda, O.M. and Mugenda, A.G. (1999). Research Methods: Quantitative and qualitative Approaches. Acts/Press, Nairobi.
- Musa, S.D., Simon, D and Ogidiolu, A. (2019). Comparative Analysis of Water Quality using Physico-chemical Parameter. Journal of Contemporary Social Research Vol. 4 (1): 6-15.
- Ni X, Parajuli P.B., Quyang, Y., Dash P., and Stegert, C. (2021). Assessing Land Use Change Impact on Stream Discharge and Stream Water Quality in an Agricultural Watershed. Catena 198: 105055.
- Nor Akbar, Irum Gul, Naila Gul and Shomaila Atehwan (2015). Impact of some Physicochemical Parameters of Water and Soil. Global Vetreinaria 15(1), 26-36.
- Poff, N.L., Bledsoe B.P.,and Cuhaciyan C.O. (2006). Hydrologic Variation with Land Uses Across the Contigous United States Geographic and Ecological Consequences for Stream Ecosystems. Geomorphology 79: 264-285.
- Ray J.G. Santhakumaran and Kookai, S. (2021). Phytoplankton Communities of eutrophic fresh water bodies (Kerala, India) in relation to the physicochemical water Quality Parameters. Environment and Sustainability 23 (11); 259-290.
- Ray J.G. Santhakumaran and Kookai, S. (2021). Phytoplankton Communities of eutrophic fresh water bodies (Kerala, India) in relation to the physicochemical water Quality Parameters. Environment and Sustainability 23 (11); 259-290.
- Samways, D. (2022). Population and Sustainability reviewing the relationship between Populations. Growth and Environmental Changes. Popul.Sustain 6: 15-41.
- Sarita Kumar, Jawed Ahmed Khan, Mahander Singh Thakur and Harinder Lal (2019). Study of Physicochemical Characteristics of Soil and Water in Relation to Fish Production. Journal of Atmospheric and Earth Sciences, DOI: 10.24966/AES-87 80/100006.
- Sivakumar, B. (2021). COVID-19 and Water. Springer, Pp.531-534.
- Wrinkler K., Harrold, M. (2021). Globalk Land Use Changes are four times greater than previously estimated. Nat. Comm 12:1-10.
- Yadav, S., Barbel, M.S and Shrestha, S., (2019). Land use Impact on the Water Quality of Large Tropical River: Monit. Assess. 191, Pg. 614-628.