
Assessment of Tourists Patronage of Jos Wildlife Park, Plateau State, Nigeria, Between 2015-2020
- Dung Anthony Fidelis
- Abdullahi Ibrahim Bala
- Obikwelu, M.C.
- M.L. Ozoemene
- 511-520
- Dec 20, 2023
- Earth Science
Assessment of Tourists Patronage of Jos Wildlife Park, Plateau State, Nigeria, between 2015-2020
Dung Anthony Fidelis1, Abdullahi Ibrahim Bala2, Obikwelu, M.C.1, M.L. Ozoemene1
1Nnamdi Azikiwe University, Awka, Anambra State, Nigeria
2Plateau State Polytechnic Barkin Ladi Main-Campus, Plateau State, Nigeria
DOI: https://doi.org/10.51244/IJRSI.2023.1011042
Received: 26 November 2023; Accepted: 29 November 2023; Published: 20 December 2023
ABSTRACT
This research project aimed at studying the “Assessment of Tourist Patronage and challenges of Jos Wildlife Park, from 2015 – 2020”. By using descriptive survey method, data were collected through administration of one hundred questionnaires to respondents of four communities of which seventy (70) was retrieved. The following objectives; Challenges of tourists patronage to Jos wildlife park, negatives economic impacts of Jos wildlife park, management challenges of Jos wildlife park, were addressed. The data for tourists patronage to Jos wildlife park between 2015-2020 were analyzed using Time series statistics; the study shows that there was high tourist patronage in 2015(110,275) than 2016(87,700) and 2017(90,400) in Jos Wildlife Park respectively. The result also shows that, 2018 recorded the lowest tourist patronage of 85,187; 2019 recorded the highest tourist patronage of 131,810 tourists but it dropped to 120,462 in 2020. The researcher recommends that policies and facilities favorable to both the young and the old should be implemented in other to attract tourists of all age group. Insecurity and provision of perimeter square fence will go a long way to curb criminal activities in Jos wildlife Park.
Keywords: Assessment, Tourist, Patronage, Challenges and Wildlife Park
INTRODUCTION
A high level of tourist satisfaction is likely to generate positive feedback from the tourist including patronage of the tourist area, increased purchase of products, and recommending these to others (Kozak and Rimmington, 2000; Gursoy, McCleary, Lepsito, 2003, 2007).
Measuring patronage is important for the survival, development and success of the tourism business, measuring tourist patronage, the basic premise is that tourist reflects on their experiences. Tourist patronage is one of the most frequently examined topics in the hospitality and tourism industry because it plays an important role in the continued and sustained operation of any tourism business (Gursoy, McCleary, Lepsito, 2003, 2007).
Although researchers have identified major driving factors of tourist patronage such as tourist expectations, perceived quality, perceived value, and destination image, most of these constructs were investigated separately with respect to their relationships with tourist satisfaction (Kozak and Rimmington, 2000).
LITERATURE REVIEW
Jos Wildlife Park is an habitat for various animals, mammals, birds, reptiles included Herbivores: elephants, cattle, elands, gazelles and others can be found at the park; Carnivores: the park has several lion, crocodiles, hyenas, pythons and Birds: ostriches, the crowned crane, vultures are among the flight animals the park is proud to have (The Guardian Nigeria News – Nigeria and World News. 9 March 2016)
Tourism provides a major socio-economic opportunity for most developed countries and improving the livelihood of the residents (Ajake and Amalu, 2012). The increasing awareness on environmental implication of economic activities in the world and the rising desire of rich tourists’ to visit nature-based environment have been identified as the main driving force behind the dramatic expansion of the ecotourism industry (Victor and Rebecca Hawkins 1998). Tourism brings both positive and negative effects on the health of local people. Godovykh, Maksim; Ridderstaat, Jorge 2020).
Inbound tourism also increases the spread of SARS, MERS, COVID-19, and other diseases that transmit from human-to-human, which recently led to closed borders, travel restrictions, canceled flights (Sigala, Marianna 2020). Sexually transmitted infections are also often transferred between visitors and residents (Bauer, Irmgard September 2007;. Prime example of a country where tourism has had a positive effect on wildlife protection. Wildlife tourism in Africa makes around 36 percent of the tourism industry, contributing over $29 billion to the continent’s economy and provides jobs to 3.6 million people (United Nations World Tourism Organization, 2003).
Africa, Asia, South America, and the South Pacific focus more and more on the value of their wild natural areas. With the growth of tourism appear even new national and wildlife parks that connect sustainable tourism with biodiversity preservation. For example, Isimangaliso Wetland Park in South Africa offers amazing experience for tourists who can choose between diving, snorkeling, kayaking or horseback riding in a landscape of 25,000 years old coastal dunes and swamp forests, while protecting the area’s sensitive ecosystems and unique species. The coastline is Africa’s only remaining nesting place of Loggerhead and Leatherback turtles (UNWTO, 2003).
Virunga National Park in East Africa has a story of conservation success to tell, even despite years of civil unrest and war in the surrounding areas, it has been declared an ecological pillar for the entire East and Central African biodiversity, having the largest concentration of birds and reptiles over other protected areas (UNWTO, 2003).
The rate of corruption in Nigeria is a huge discouragement to tourism, and this hinders the country from been a tourist destination (Osinubi et al., 2021). However, there is a need for quality and effective management of tourism and tourist destinations in Nigeria (Adeleke and Ogunsusi, 2019). This would however bring investors into the country, and thus foster sustainable tourism development (Jemirade, 2021). Planning and management entails personnel and qualified individuals who are skilled in the aspect of tourism (Mason, 2003).
There are factors that motivate tourists patronage of any destination, such factors includes: Visiting of relations and friends, Weather/Climate, Scenic Beauty, Unique Standard of Living, People friendliness and Accessibility (Kozak, and Rimmington, 2000; Aniah, Eja, Otu, and Ushie 2009)
MATERIALS AND METHODS
Area of Study
Jos Wildlife Park was established by Governor Joseph D. Gomwalk in 1972 situated in Jos South Local Government Area of Plateau State known as one of the Plateau State’s topmost tourist attractions and a place in Nigeria where nature has been conserved. The sights and sounds of nature and wildlife unfold in the park, located in the middle belt of Nigeria along the Jos-Miango road, about 5 kilometers from the city of Jos, and covering an area of 3 square miles (7.8km2) with a latitude 9.88520N and longitude 8.84860E. It is one of the biggest natural/artificial zoological garden and park in Nigeria, the park is playing a major part in the development, promotion of tourism and ecotourism in Nigeria (www.pressreader.com. Retrieved 29th December, 2021).
Sampling Technique
Simple random sampling method was adopted and applied in the process of selection of the respondents. This technique was used to arrive at a representative population that will permit generalization on the entire population.
- Sample Size
The study was conducted in Jos Wildlife Park by extension Plateau State Tourism Corporation and the host communities of Jos Wildlife Park with a sample of one hundred (100) respondents. Simple random sampling was used to identify the stratum in the population due to the availability of the respondents.
Table 3.1: Distribution of Respondent by Communities
| S/NO | COMMUNITY | SAMPLE |
| 1 | Low-Cost | 25 |
| 2 | Rantiya | 25 |
| 3 | Dong | 25 |
| 4 | Tudun-Wada | 25 |
| TOTAL | 100 | |
Source: Researcher’s Field Survey, 2022
Method of Data Collection
This study adopted survey method, all the necessary information for data was obtained through the use of structured questionnaires to clarify issues that were relevant to the study. More so, the study make used of data and information elicited from secondary sources like books and the internet.
Method of Data Analysis
Data collected was mainly presented by use of quantitative methods; data from the closed-ended questions were analyzed by indicating the magnitude of responses. The responses from the structured questions were computed into frequency counts, percentages and charts. It was summarized and tabulated for easy presentation, assessment, analysis and interpretation. The simple percentage method was believed to be straight forward, easy to interpret and understanding method; the researcher therefore chose the simple percentage as the method to use.
The formula for percentage (%):
% = F x 100
N 1
Where:
F = Frequency of Respondent Response
N = Total Number of Response.
100 = Consistency in the percentage of respondents for each items.
In testing the hypothesis, time series analysis was used as a statistical tool, to identify pattern, for the understanding of the data and prediction of the future.
The formula for calculating time series is denoted by:
y(t) = x(t)β + ε(t), where y(t) = {yt;t = 0,±1,±2,…} is a sequence, indexed by the time subscript t, which is a combination of an observable signal sequence x(t) = {xt} and an unobservable white-noise sequence ε(t) = {εt} of independently and identically distributed random variables.
RESULTS AND DISCUSSION
Table 1: Distributions of Respondents by Gender
| Respondents | Distribution | % |
| Male | 42 | 60 |
| Female | 28 | 40 |
| TOTAL | 70 | 100 |
Table 1: Shows that, 42 respondents representing 60% are males with the highest number while 28 respondents represents 40% has the lowest number of respondents. However, it is possible te males has more leisure time than the females counterparts.
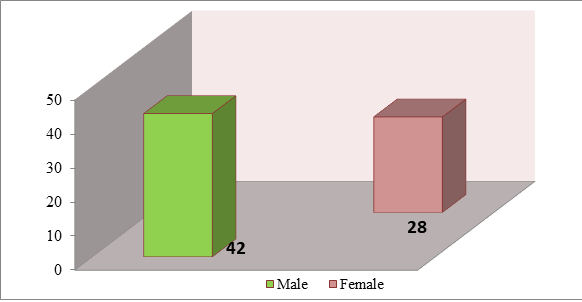
Table 1 and Figure 1: show the gender structure of the sampled population; this indicates that, 60% of the respondents were males and 40% of the respondents were females; this disparity indicates male dominance in the various communities and have more leisure time than the female counterparts.
Table 2: Distribution of Respondents by Age
| Respondents | Distribution | % |
| 20 -25 Years | 34 | 49 |
| 26 -30 Years | 19 | 27 |
| 31 -35 Years | 8 | 11 |
| 36 -40 Years | 9 | 13 |
| TOTAL | 70 | 100 |
Table2: shows 34 respondents represent 49% falls between 20-25 years, which also has the highest number of respondents.19 respondents represents 27% were between 26-30 years.8 respondents represents 11% were between 31-35 years, which also has the lowest number of respondents while 9 respondents represents 13% were between 36-40 years. It is very cleared that youths participates more in recreation activities than the adults.
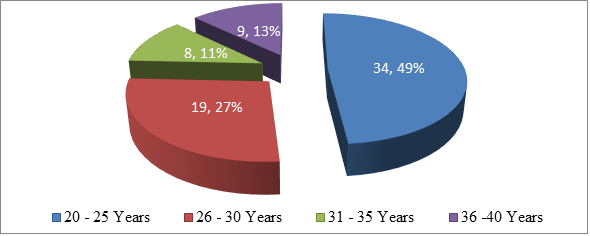
Table .2 and Figure highlights the distribution of respondents by age. The table and figure shows that, 34 out of the total respondents representing 49% are between 20-25 years of age. While, to eight (8) respondents representing 11% are between 31- 35 years respectively. It is evidently clear that; majority of the respondents are between 20-25 years which also shows that, the respondents are youths.
Table 3: Distribution of Respondents by Marital Status
| Single | 47 | 67 |
| Married | 23 | 33 |
| TOTAL | 70 | 100 |
Table 3: shows that 47 respondents represents 67% were singles, which also has the highest number of respondents, while 23 respondents represents 33% were married people, which also has the lowest number of respondents. It is clear that the singles are more active in visiting Jos wildlife park
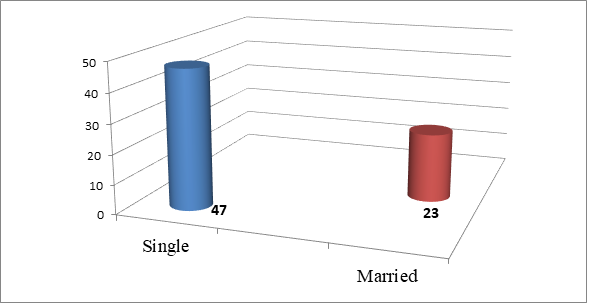
Figure 3: Distributions of Respondents by Marital Status
Table 3 and Figure 4.3 above show statistical distribution of respondents based on marital status. The table shows that 47 respondents representing 67% of the total respondents were single and 23 respondents representing 33% were married. It can be deduced that, majority of the respondents in the communities were singles and also implies that they patronize tourism sector.
Table 4: Challenges of Tourists Patronage to Jos Wildlife Park
| Options | Respondence | Percentage (%) |
| Poor electricity supply | 2 | 2.8 |
| Herdsmen/Farmers clashes | 3 | 4.1 |
| Poor Facilities | 20 | 28 |
| Insecurity | 31 | 44 |
| Display of new wild animals | 14 | 20 |
| Total | 70 | 100 |
Table 4: shows that 2 respondents represents 2.8% identified poor electricity supply, which also has the lowest number of respondents, 3 respondents represents 4.1 % suggests herders and farmers clashes, 20 respondents represents 28 % suggests poor facilities, 31 respondents represents 44 % suggests insecurity while 14 respondents represents 20 % suggests display of new wildlife animals.
Table 5: Negative Economic Impacts of tourism in Jos Wildlife Park
| Options | Residence | Percentage (%) |
| Crime level | 40 | 57.2 |
| Density of tourists arrivals | 15 | 21.1 |
| Traffic congestion | 10 | 14.1 |
| Loss of Local Industries | 5 | 7.2 |
| Total | 70 | 100 |
Table 5: Shows that 40 respondents represents 57.2 % claims crime levels, which also has the highest number of respondents, 15 respondents represents 21.1 % suggests density of tourists arrivals, 10 respondents represents 14.1 % shows traffic congestion while 5 respondents represents 7.2 % suggests loss of native language, which also has the lowest number of respondents. It shows that there seems to be high rate of crime in and around Jos wildlife park.
Table 6: Management Challenges of Jos Wildlife Park
| Options | Respondents | Percentage (%) |
| Shortage of funds | 15 | 21.1 |
| Shortage of Man power | 6 | 8.1 |
| Lack of Perimeter Square Fence | 45 | 64.1 |
| Over-grazing | 4 | 5.7 |
| Total | 70 | 100 |
Table 6: Shows that, 15 respondents represents 21.1% suggests shortage of funds, 6 respondents represents 8.1% suggests shortage of man power, 45 respondents represents 64.1 % suggests lack of perimeter square fence, which also has the highest number of respondents while 4 respondents represents 5.7 % suggests over-grazing, which also has the lowest number of respondents. It is cleared that Jos wildlife park needs a perimeter square fence to reduce crimes in and around the park.
Table 7: Solutions to the Management Problems of Jos Wildlife Park
| Options | Respondent | Percentage |
| Provide Perimeter square fence | 46 | 65.7 |
| Provision of Funds | 14 | 20 |
| Employ more new staff | 10 | 14.1 |
| Total | 70 | 100 |
Table 7: Shows that 46 respondents represents 65.7% suggests the provision of perimeter square fence, which has the highest number of respondents, 14 respondents represents 20% suggests provision of funds, while 10 respondents represents 14.1% suggests employ more new staff. However, it is very cleared that there is need for a perimeter square fence.
Table 8: Other Solutions of Tourists Patronage to Jos Wildlife Park
| Options | Resident | Percentage (%) |
| Provision of digital security gargets | 19 | 27 |
| Provision of stand-by electricity supply | 11 | 15 |
| Provision of new wildlife animals | 38 | 54 |
| Provision of modern recreational facilities | 12 | 17 |
| Total | 70 | 100 |
Table 8: Shows that 19 respondents represents 27 % reveals provision of digital security gargets, 11 respondents represents 15 % reveals provision of stand-by electricity supply, 38 respondents represents 54% reveals provision of new wildlife animals which also has the highest number of respondents while 12 respondents represents 17% reveals of modern recreational facilities. It shows that there is need to provide new animals.
Table 9: Jos Wildlife Park Yearly Tourist Patronage
| Patronage (2015-2020) Year | 2015 | 2016 | 2017 | 2018 | 2019 | 2020 |
| No. of Tourist Patronage | 110,275 | 87,700 | 90,400 | 85,187 | 131,810 | 120,462 |
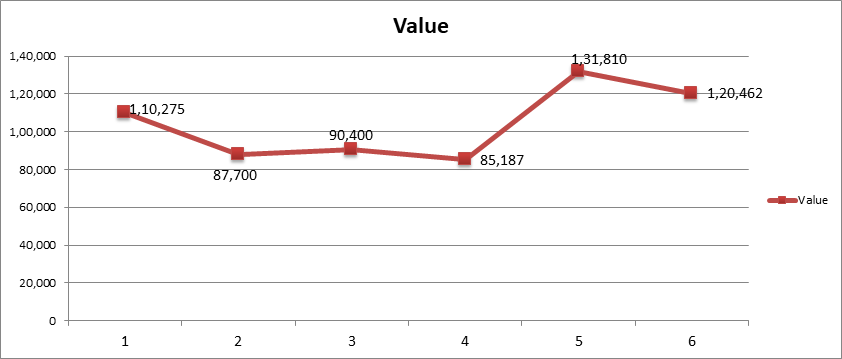
Figure 9: Tourist Patronage From 2015-2020
In order to determine the assessment of tourist Patronage of Jos Wildlife Park, between 2015-2020, the research findings of the study are discussed based on the outcome of the analysis in table.
The study reveals that, tourists patronage varies from one year to another, the highest level of tourist patronage was recorded in 2019 with a tourist inflow of one hundred and thirty one thousand eight hundred and ten (131,810) and this might be due to the fact that Nigeria experienced political tourism era where different political parties were vying for positions, hence increased the number of tourists while the lowest was recorded in 2018 with a tourist inflow of eighty -five thousand one hundred and eighty- seven (85,187), which might be due to other problems as stated in table1
The findings also reveals that, both domestic and international tourists were made up of adults and kids. It further shows that adult tourists were two hundred and twenty one thousand two hundred and two (221,202) while two hundred and nine thousand five hundred and eleven (209,511) kids visited the park for the years under review. It also reveals that, one hundred and ninety four thousand eight hundred and forty five (194, 845) tourists came for educational visit within the years.
CONCLUSION AND RECOMMENDATION
The findings of this study established that, Density of tourists arrivals, traffic congestion, over-crowding and crime levels, all forms up the negatives economic impacts of Jos Wildlife Park. The study also opines that poor electricity supply, herdsmen/farmers clashes, insecurity, and display of new wildlife animals are the challenges of tourist patronage in Jos wildlife Park. Data also shows that shortage of funds, shortage of manpower, Lack of perimeter square fence and over-grazing are the management challenges of Jos wildlife Park. The study shows that establishment of perimeter square fence, provision of funds, and employment of more new staff are the solutions of Jos wildlife park. Also, provision of digital security networks, provision of stand-by electricity, provision of new wildlife animals and provision of modern recreational facilities forms other solution of Jos wildlife Park.
From the study of the patronage of tourists in Jos wildlife Park, it has been revealed that, there was a high patronage by domestic tourists as compared to international tourists, it also shows that a larger proportion of the tourists were adults (220,202) considering the records as shown in Figure 9.
There is need for the government to revisit it tourism policies, review it based on the recommendations made by the researcher for a vibrant socio-economic and environmental sustainability. A stand-by electricity, a perimeter square fence around the boundary of the park should be established as this will go a long way in curbing some contemporary issues being observes in and around the park, such as kidnapping, banditry, cattle rustling encroachment, grazing and poaching.
SUGGESTION FOR FURTHER STUDIES
The researcher recommends that, there should be further study on the assessment of tourists patronage and challenges on Jos wildlife park, hence it is possible to identify a gap from this present study that a further research may addressed.
REFERENCES
- Ajake A. O, Amalu T. E. (2012) participation of Becheeve people in tourism Development in Obudu mountain resort, Cross River State Nigeria
- Aniah E. J., Eja E. I., Otu J. E., Ushie M. A. (2009) Resort Potentials as a Strategy for Sustainable Tourism Development in Plateau State, Nigeria: Journal of Sustainable development vol. 2 No. 2 July 2009.
- Bauer, Irmgard (September 2007). “Understanding Sexual Relationships between Tourists and Locals in Cuzco/Peru”. Travel Medicine and Infectious Disease. 5 (5): 287–294. doi:10.1016/j.tmaid.2007.06.004. ISSN 1477-8939. PMID 17870633.
- Cabezas, A. L. (2004). Between Love and Money: Sex, Tourism, and Citizenship in Cuba and the Dominican Republic. Signs: Journal of Women in Culture and Society, 29(4), 987–1015.
- Gursoy, D., McCleary, K. W., Lepsito, L. R. (2003, 2007). Quality Tourism Experiences, Elsevier B. Elsevier Butter growth Heinemann, Linacre House, Jordan Hill, Oxford UK.
- Godovykh, Maksim; Ridderstaat, Jorge (1 September 2020). “Health Outcomes of Tourism Development: A Longitudinal Study of the Impact of Tourism arrivals on Residents’ Health”. Journal of Destination Marketing & Management. 17: 100462. doi:10.1016/j.jdmm.2020.100462. ISSN 2212-571X. S2CID 220688162.
- United Nations World Tourism Organization. (2003). Sustainable Development of indigenous Tourism. http://media.unwto.org/en/content/sustanable-development-of-idigenous-tourism
- Sigala, Marianna (1 September 2020). “Tourism and COVID-19: Impacts and Implications for Advancing and Resetting Industry and Research”. Journal of Business Research. 117: 312–321. doi:10.1016/j.jbusres.2020.06.015. ISSN 0148-2963. PMC 7290228. PMID 32546875.
- Victor T. C. and Rebecca Hawkins (1998) Sustainable Tourism: A Marketing Perspective. Butterworth Heinemann Linacre House, Jordan Hill, Oxford
- Kozak, M. and Rimmington, M. (2000). Tourist Satisfaction with mallorca, Spain as an Off-season Holiday Destination: Journal of Travel research
- Osinubi, T., Osinubi, O. B., Tabash, M. I., Ajayi, A. O., and Tran, K. D. (2021). The Impact of Corruption on Tourism Sector in Nigeria: Empirical Insights by Using an Autoregressive Distributed Lag Bounds (ARDL) Testing Approach. International Journal of Hospitality and Tourism Administration. J
- emirade, D. (2021). Tourism: The missed opportunities for economic development in Journal of African Studies and Development, 3(1), 15-22.
- Adeleke, B. O. and Ogunsusi, K. (2019). Evaluation of factors enhancing effectiveness of destination management of nature based tourism, Lagos, Nigeria. International Tourism and Hospitality Journal, 2(2), 1-16.