
Background Ionization Radiation of Selected Water Factories in Yenagoa Metropolis Bayelsa State
- Godwin E. Ogobiri
- Biere, P. E
- Precious Ubah
- Ibuama E. Abule
- 68-74
- Apr 27, 2024
- Physics
Background Ionization Radiation of Selected Water Factories in Yenagoa Metropolis Bayelsa State.
Godwin E. Ogobiri, Biere, P. E, Precious Ubah, Ibuama E. Abule
Department of Physics, Niger Delta University, Bayelsa State, Nigeria.
DOI: https://doi.org/10.51244/IJRSI.2024.1104006
Received: 29 February 2024; Revised: 17 March 2024; Accepted: 23 March 2024; Published: 27 April 2024
ABSTRACT
The research work was carried out at the water factories of both Allen T. water factory and Niger Delta University (NDU) water factory in Bayelsa State, Nigeria. Radiation Monitoring Device- Radalert x100 was deployed in carrying out the study. The water factories were partitioned into ten different locations as indicated in the both Tables. The Background Ionizing Radiation (BIR) mean value of 0.016 mSv/y was recorded at Allen T. water factory as against the BIR mean value, 0.013 mSv/y as recorded at Niger Delta University (NDU) water factory. The mean Absorbed dose rate (AbD) of 0.140 nGy/h was recorded at Allen T. water factory as against the AbD mean value, 0.110 nGy/h as recorded at Niger Delta University (NDU) water factory. Annual effective dose equivalent (AEDE) mean value of 0.215mSv/y was recorded at Allen T. water factory which is quite higher than the Annual effective dose equivalent (AEDE) mean value of 0.168 mSv/y as recorded in Niger Delta University (NDU) water factory. The Excess life cancer risk (ELCR) mean value of 0.593 x10⁻³ recorded at Allen T. water factory was higher than the Excess life cancer risk (ELCR) mean value, 0.464 x10⁻³ as recorded at Niger Delta University (NDU) water factory. The values obtained were then compared to the World Permissible Limit as given by UNSCEAR 2000. The high radiological values as recorded at Allen T. water factory is mainly because of poor ventilation system, the absence of steel-coated equipment’s in the factory and the location of the factory close to human activities thereby contributing to the high-level of radiation.
Index Terms: Radiation Energy, Radioactivity, Ionization, Exposure Rate, Ionization Parameters
INTRODUCTION
Radiation is energy that comes from a source and travels through space at the speed of light. This energy has both electric field and a magnetic field associated with it, and has a wave-like properties. It could also be called “electromagnetic waves” produced anytime energy is transferred (Richard et al, 2019). Radiation is generally classified into two different groups which are ionizing and non-ionizing radiation- Ionizing radiation carries more than 10 eV, which is enough to ionize atoms and molecules and break chemical bonds with alpha, beta and gamma rays as example of all, gamma having the highest wavelength, while the non-ionizing radiation is not caused by these radiations (U.S.NRC, 2020). They usually emit heat, which can sometimes be so intense as to result in burns. Visible light and infrared radiation are examples of non-ionizing radiation that may be seen by humans. Non-ionizing radiation is a nuclear radiation.
Radioactivity is defined as the spontaneous emission of radiation from highly energized particles or photons resulting in nuclear reactions (Cruz et at, April 2019). This process is also known as radioactive decay, or radioactive disintegration. There is a different form of radioactivity that is harmful and not harmful. One of the biggest examples is a light bulb: it emits radiation in the form of light and heat, but there is no radioactivity taking place. A substance that consists of unstable nuclei of the atom is considered to be radioactive. Radioactivity occurs when an unstable, high-energy nucleus of an element releases some of that energy to get to a more stable state (similar to when you consume way too much sugar and need to work off all of that energy). An alpha decay is one of the ways this excess energy is expelled. This natural occurrence is in summary is generally described as the Law of Radioactivity. When a radioactive material undergoes α, β or γ-decay, the number of nuclei undergoing the decay, per unit time, is proportional to the total number of nuclei in the sample materials. So,
If N = total number of nuclei in the sample and ΔN = number of nuclei which undergo decay in time Δt afterward,
ΔN/ Δt∝ N [1]
Or, ΔN/ Δt = λN [2]
where λ = radioactive decay constant or disintegration constant. At this moment, the change in the number of nuclei in the sample is, dN = – ΔN in time Δt. thus, the rate of change of N (in the limit Δt → 0) is,
dN/dt = – λN [3]
Or, dN/N = – λ dt [4]
Afterwards, integrating both the sides of the above equation, we obtain,
NN0∫ dN/N = λ tt0∫ dt [5]
Or, ln N – ln N0 = – λ (t – t0) [6]
Where, N0 is the number of radioactive nuclei in the sample at some arbitrary time t0 and N is the number of radioactive nuclei at any consequent time t. Next, we set t0 = 0 and the above equation (3) when rearranged to obtain,
ln (N/N0) = – λt [7]
Or, N(t) = N0e– λt [8]
Equation (8) is then gotten as the Law of Radioactive Decay.
Sani et al, (2020) evaluate the radiation exposure rate on workers in the Federal Medical Center, Katsina as a result medical equipment in the working environment. The results indicate that the average annual equivalent dose per occupational worker range from 0.74 to 1.20 mSv and 1.28 to 2.21 mSv for skin surface and deep skin dose, measured at 10 mm and 0.07 mm tissue depth respectively. Theoccupational dose was within the recommended national and international limits of 5 mSv per annum or an average of 20 mSv in 5 years.
MATERIAL AND METHODS
This research work deploythe use of Radiation Monitoring Device- Radalert x100 and Global Positioning System (GPS) in other to locate the geographical locations for both water factories. The background ionizing radiation (mR/h) readings were then obtained with the aid of Radalert x100 for different locations within both water factories. A total of ten (10) different locations were measured at the two locations. The results was then tabulated and other radiological parameters were determined with the help of already establishedconversion factors and formula as indicated in the Tables and Bar chart below. The GPS locations for the different water factories is shown below.
Yenagoa with a GPS of Latitude 4o 55’ 36.30” N and Longitude 6’3.50”E
Amassoma with a GPS of Latitude 4o 58’13”N and Longitude 6o 32.94”E
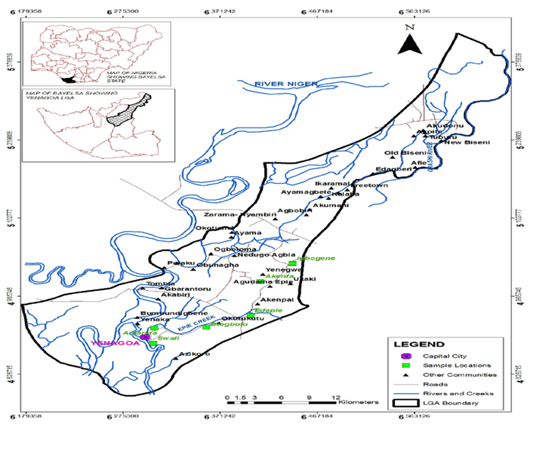
Fig 1 Map of Yenagoa showing studied locations
RESULTS
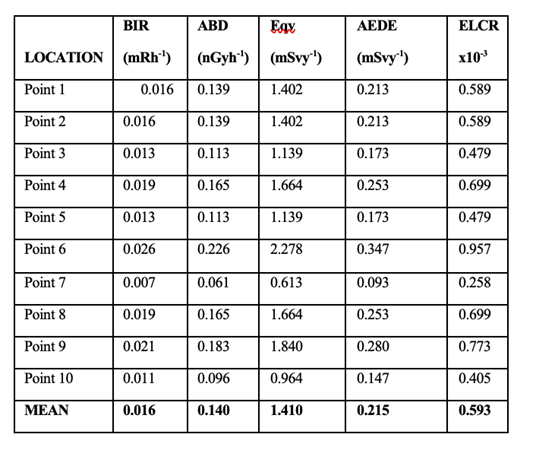
The Table below show the results of Background Ionizing Radiation (BIR) and other calculated radiological parameters for Allen T. water factory.
Table 1: Indoor background ionizing radiation in Allen T. water factory
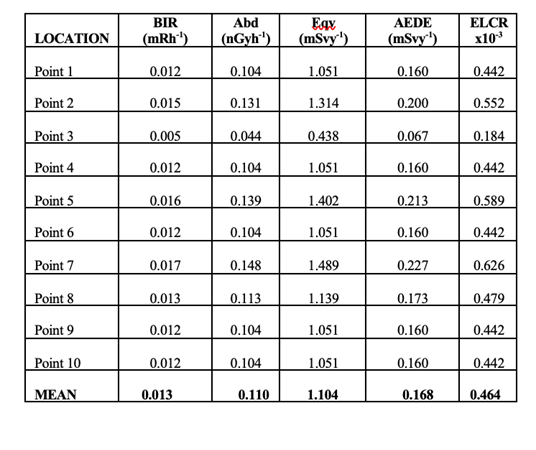
The Table below show the results of Background Ionizing Radiation (BIR) and other calculated radiological parameters for the Niger Delta University (NDU) water factory.
Table 2. Indoor background ionizing radiation in Niger Delta University (NDU). water factory
Comparison of the Background Ionizing Radiation (BIR) for the both Allen T. water factory and Niger Delta University (NDU) water factory.
Table 3: BIR exposure rate in Allen T. and NDU water factories
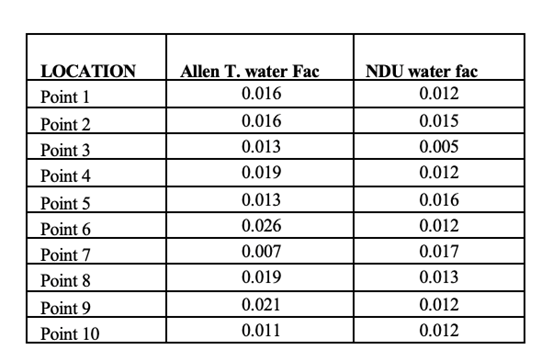
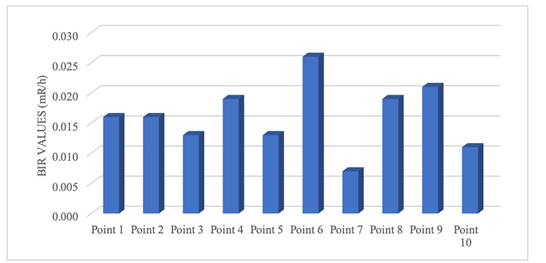
Fig 2: BIR exposure rate in different locations at Allen T. water factory
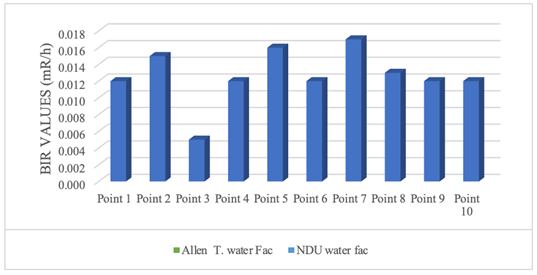
Fig 3: BIR exposure rate in different locations at NDU water factory (mR/h)
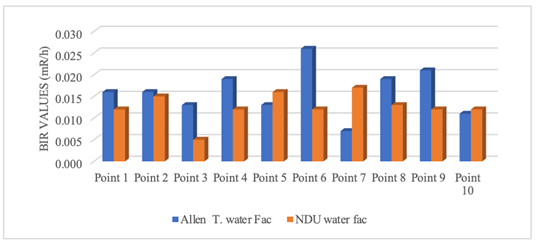
Fig 4: exposure rate for both Allen T. and NDU water factories at different location
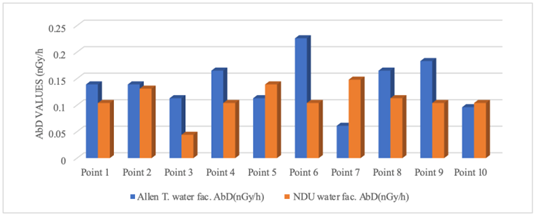
Fig 5: A chart comparing AbD values of Allen T. and NDU water factories against locations
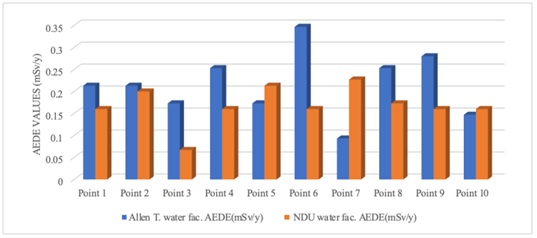
Fig 6: A chart comparing AEDE values of Allen T. and NDU water factories against locations
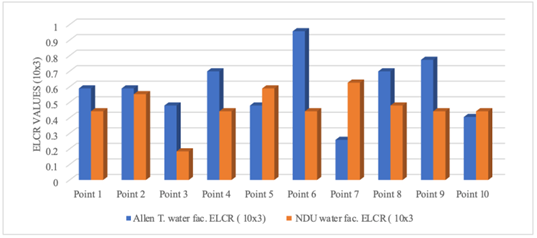
Fig 7: A chart comparing ELCR values of Allen T. and NDU water factories against locations
DISCUSSION
Table 1 shows the Background Ionizing Radiation (BIR) exposure rate measurements for ten different locations at the Allen. T. water factory and other calculated radiological parameters were also indicated on the Table, Table 2 shows the Background Ionizing Radiation (BIR) exposure rate measurements for ten different locations at the NDU water factory and other calculated radiological parameters indicated also, whileTable 3 shows the combine BIR measurements for both AllenT. water factory andNDU water factory.
Figure 2is the Bar charts of BIR exposure rate values for various points at the Allen T. water factory, with the highest value at recorded at point 2 with a corresponding value of 0.026 mSv/y and the lowest at point 7 with a value of 0.007 mSv/y, Figure 3 indicates the Bar charts of BIR exposure rate values for various points at the NDU water factory, with the highest value at point 3 with a value of 0.016 mSv/y and the lowest at point 7 with a value of 0.005 mSv/yas effect of the proper ventilation system and steel coated equipment’s in use at the factory while Figure 4 is a Bar chart for both the two factories- Allen .T water factory and NDU water factory. For the Allen T. water factory, point 2 recorded the highest BIR exposurerate with a value of 0.026 mSv/y as against NDU water factory at point 7 with a BIR value of 0.005 mSv/y. The results revealed that the occupational radiation dose is within the recommended limits within the world average value 0.013 mSv/y as reported by ICRP (1996) and UNSCEAR 2000.
Figure 5 is a bar chart showing the comparison of AbD (nGy/h) of Allen T. water factory and NDU water factory, which recorded the highest value at point 6 with 0.226 nGy/has against the lowest in NDU water factory at point 4 with a value of 0.044 nGy/h, all in comparison with the world permissible limit, 1.00 nGy/h provided by UNSCEAR 2000. Figure 6 is a bar chart showing the comparison of AEDE (mSv/y) of Allen T. water factory and NDU water factory, which recorded the highest at point 6 with value of 0.346 mSv/yas against the lowest in NDU water factory at point 3 with a value of 0.067 mSv/y, all in comparison with the world permissible limit 1.00 mSv/y, provided by UNSCEAR 2000. Figure 7 is a bar chart showing the comparison of ELCR of Allen T. water factory and NDU water factory, which recorded the highest value at point 6 with 0.957 x10³ as against the lowest in NDU water factory at point 3 with a value of 0.184 x10³, all in comparison with the world permissible limit, 0.29 x10³ provided by UNSCEAR 2000.
CONCLUSION
This research work shows the Background Ionizing Radiation of the two different water factories Allen T. water factory and Niger Delta University water factory both in Bayelsa State, Nigeria. The water factories were partitioned into ten different locations where the BIR values were measured and other radiological parameters for the various locations were calculated. The BIR mean value recorded at Allen T water factory is 0.016 mSv/y which is higher than the BIR mean value 0.013 mSv/y recorded at Niger Delta University (NDU) water factory. The high radiological values at Allen T. water factory in comparison to Niger Delta University water factory can be ascribed to poor ventilation system, the absence of steel-coated equipment’s in the factory and the location of the factory close to human activities thereby contributing to the high-level of radiation.
RECOMMENDATION
My recommendations as stated below
- Office users and workers in the factories should not stay too long in the environment
- Workers and office users should be on shift as regards to their work
- There should be radiation monitors present at every water facility to carry out Radiation Survey (RS) in the area at least once in a year as specified in the national regulation.
- Office users and workers should be adequately train on radiation protection and operational procedures
- Factories should purchase equipment that are led and steel coated as they are very good for shielding radiation
REFERENCE
- Background radiation (2022). Is background radiation a risk to me and my family? Rjetrieved from: https://www.epa.gov/radiation/what-background-radiation-background-radiation-risk-me-and-my-family [April, 30 2023]
- Descriptive study of Yenagoa, Bayelsa State (2023). Retrieved from: Wikipedia https://en.wikipedia.org/wiki/Yenagoa [May, 5 2023].
- ICRP 60 (1990). Recommendations of the International Commission on Radiological Protection, Publication 60, Pergamon Press, Oxford and New York.
- ICRP 103 (2007). Recommendations of The International Commission on Radiological Protection, Publication 103, Elsevier, Amsterdam.
- Richard Freeman, Jamews King and Gregory Lafyatis (2019). Electromagnetic Radiation- Oxford University Press.
- Usman Sani, Joseph, D. S., Muhammad, B. G. and Joseph, D. Z. (2020). Evaluation of The Occupational Exposure of The Radiation Workers in Federal Medical Centre Katsina, Nigeria.
- United State for Nuclear Radiation Commission (2020) -Ionizing radiation and Non-Ionizing radiation
- United Nations Scientific Committee on the Effects of Atomic Radiation (UNSCEAR), 2000. Effects of Ionizing Radiation: 2000 Report to the General Assembly, with Scientific Annexes B, Vol. 2. United Nations, New York.
- United Nations Scientific Committee on the Effects of Atomic Radiation, 2015. UNSCEAR 2008 report to the general assembly with scientific annexes. United Nations, New York.
- United Nations Scientific Committee on the Effects of Atomic Radiation (UNSCEAR), 2008. Effects of Ionizing Radiation: 2010 Report to the General Assembly, with Scientific Annexes, Vol. 1. United Nations, New York.
- Wikipedia, the Free Encyclopedia 16 January 2023. https://en.wikipedia.org/wiki/Radiation-induced cancer