Climate Change Mitigation, Green Energy and Sustainable Development in Nigeria
- EKPE Oto-obong Friday
- OKORIE John Ogonna
- UDENYI Joseph Otsayi
- ODUH Christiana Ihotu
- 466-495
- Jul 18, 2024
- Environmental Assessment
Climate Change Mitigation, Green Energy and Sustainable Development in Nigeria
EKPE Oto-obong Friday1, OKORIE John Ogonna2, UDENYI Joseph Otsayi1 & ODUH Christiana Ihotu1
1Department of Economics, Federal University of Lafia, Nasarawa State, Nigeria
2Department of Economics, University of Ibadan, Oyo, Nigeria.
DOI: https://doi.org/10.51244/IJRSI.2024.1106037
Received: 30 April 2024; Revised: 25 May 2024; Accepted: 31 May 2024; Published: 18 July 2024
ABSTRACT
This study empirically examines the relationship between climate change mitigation and green energy and their impact on sustainable development in Nigeria. Energy consumption is inevitable in economic development. Its consumption constitutes the single largest source of carbon emissions which are of great danger to the existence of our planet earth by causing climate change. The greater awareness of need to mitigate climate variability has brought about intense focus on the diverse impacts of green energy on the environment. It is on this ground that this study aims to empirically establish the relationship between sustainable development, climate change, and green energy in Nigeria. This research employed the dependent variable of sustainable development measured by GNI percapita; explanatory variables of ecological footprint, climate change measured by CO2 emissions, and green energy measured by renewable energy consumption and the control variable of education measured by Government expenditure on education. This study employed the NARDL bounds test for cointegration with the result showing a long-run relationship in the model. At the 5% significance level, only the positive change in ecological footprint and the negative change in education significantly impact sustainable development in the Long-run in Nigeria. Green energy and climate change do not have any significant impacts on sustainable development in Nigeria in the long-run. The Cointegration equation is highly significant. The study recommends that the government should set up policies that will ensure that GNI percapita is captured to adjust for environmental cost which are caused by C02 emissions and environmental safety necessitated by green energy consumption.
Keywords: Climate Change Mitigation, Green Energy, C02 Emission, Renewable Energy and Sustainable Development.
JEL Classification: Q27, Q32, Q42, Q40.
INTRODUCTION
Nigeria faces many challenges in her effort to advance its socio-economic and environmental development. A particular challenge is climate change that continues to portend serious threat to the achievement of sustainable development goals in the country. This is because Nigeria is strongly predisposed to severe negative impacts of climate change due to its fragile economy, weak resilience, and low adaptive capacity, as much of the economy is dependent on climate sensitive ecosystems and natural resources. For example, the agriculture sector, which contributes about 24% to the country’s GDP and largely rain-fed, is highly vulnerable to climate change induced frequent and severe extreme events, such as floods and droughts (Sunday, 2012). Other sectors of the economy are also vulnerable. Energy plays the most vital role in the economic growth, progress, and development, as well as poverty eradication and security of any nation. Uninterrupted energy supply is a vital issue for all countries today. Future economic growth crucially depends on the long-term availability of energy from sources that are affordable, accessible, and environmentally friendly. Security, climate change, and public health are closely interrelated with energy. Energy is an important factor in all the sectors of any country’s economy. The standard of living of a given country can be directly related to the per capita energy consumption. The recent world’s energy crisis is due to two reasons: the rapid population growth and the increase in the living standard of whole societies. The per capita energy consumption is a measure of the per capita income as well as a measure of the prosperity of a nation. Energy supports the provision of basic needs such as cooked food, a comfortable living temperature, lighting, the use of appliances, piped water or sewerage, essential health care (refrigerated vaccines, emergency, and intensive care), educational aids, communication (radio, television, electronic mail, the World Wide Web), and transport.
Energy also fuels productive activities including agriculture, commerce, manufacturing, industry, and mining. Conversely, a lack of access to energy contributes to poverty and deprivation and can contribute to the economic decline. Energy and poverty reduction are not only closely connected with each other, but also with the socioeconomic development, which involves productivity, income growth, education, and health The energy crisis, which has engulfed Nigeria for almost two decades, has been enormous and has largely contributed to the incidence of poverty by paralyzing industrial and commercial activities during this period.
Climate mitigation is any action taken to eliminate or reduce the long-term risk and hazards of climate change to human life, property and the society. The international panel on climate change defines mitigation as: An anthropogenic intervention to reduce the sources or enhance the sinks of greenhouse gases (Global Greenhouse Warming, 2018).
The impacts of climate change caused by enhanced global warming has been well established by the fifth assessment report of the Intergovernmental Panel on Climate Change which indicated that regional changes in climate, especially increases in temperature, have already affected a diverse set of physical and biological systems across the world. Climate change poses a challenge to sustainability for its numerous potential effects. The identified evidences though not limited to include, thermal expansion of the earth’s surface waters and melting of glaciers on land that has in turn caused sea level rise, flooding and land loss; destruction of crop lands; acidification of water bodies due to emission of excess carbon dioxide (CO2) as well as salt intrusion into inland freshwaters amongst others. Some of these climate change impacts (e.g. flooding, drought and salt water intrusion) have been witnessed in Nigeria. The backdrop of negative effects of climate change has necessitated the promotion of a green economy. A green economy is one focused on efficient production activities with regards to sustainable human wellbeing, economic development and environmental improvement. Although, it is an accepted fact that industrialization of the developed world has been hinged on energy from fossil fuels, developing countries especially poor African countries cannot be exempted from the global drive to mitigate climate change as there is a general consensus that climate change mitigation requires global efforts to be effective. This is because the GHGs in the atmosphere cannot be contained within borders. Nigeria, as most other developing countries, is greatly vulnerable to climate change impacts given its reliance on fossil fuels and therefore, requires a plan to not only develop sustainably and limit GHGs emissions, but to also effectively transit to a green economy.
In the light of the problems identified above, this research work is saddled with the objectives to empirically verify the impacts of Climate change mitigation and green energy on sustainable development in Nigeria; to determine whether there exists a short-run or long-run relationship between climate change mitigation, green energy and sustainable development in Nigeria. Also, to empirically determine the causality and direction of causality between climate change mitigation, green energy and sustainable development in Nigeria with data spanning from 1990-2021. The study will contribution immensely to the body knowledge due its uniqueness of data selection, method of model development and its findings using its chosen study area. The paper is divided into six chapters. Following the introduction in chapters 1 is chapters 2, the literature review. The chapters 3 are theoretical review followed by chapters 4 discussion of methodology and chapters 5 discussion of findings followed by the conclusion and recommendations in chapters 6.
LITERATURE REVIEW
The global emphasis on, and trajectory to, green energy is essentially a product of scientific evidence of environmental degradation as a result of anthropogenic activities for centuries, especially since the advent of the industrial revolution. Thus, the scientific evidence about the deepening environmental problems provided a platform for collective action considering that the environment is a public good. The various global conferences specifically organized to discuss the environment unanimously called attention to the environmental impacts of human activities, which subsequently imposed on states, the duty of domesticating global prescriptions. As a result of the global efforts to safeguard the environment, states have been made to consider environmental preservation as one of their highest priorities.
The key strategy for the protection of the environment within the context of multilateral climate negotiations is transitioning away from the current energy system dominated by fossil fuels, which is responsible for greenhouse gas (GHG) emissions, to green energy system considered as sustainable (Sovacool B. K. 2017). Several studies have demonstrated that carbon dioxide, methane, chlorofluorocarbons, perfluorocarbons, sulfur hexafluoride and nitrous oxide among others, which are major components of GHGs, are largely responsible for global warming. In actuality, GHGs are found in the atmosphere where they warm the earth at a suitable level conducive for the sustenance of life. What has happened in recent times is their increasing concentrations due to human activities, especially technological advancement and its fallouts. The particular anthropogenic causality ranges from the impacts of burning fossil fuels, the use of inorganic fertilizers, generation and improper disposal of industrial wastes, as well as respiration from humans and animals (Nwozor A. 2013). The combined impact of these factors is the creation of imbalance in the natural greenhouse composition. The UNFCCC conceptualizes climate change within the context of natural and man-induced activities resulting in massive alteration to the global atmosphere as well as the natural climate over periods of time. The effect of such alterations is frequent extreme weather events, which result in both slow continuous rise in global mean surface temperature and global warming. In other words, climate change does not connote a mere variability in the standard climactic conditions but a serious and consistent deviation from the regular patterns of weather conditions as a result of direct and indirect alteration in the global atmosphere, especially due to human activities.
Owusu and Asumadu-Sarkodie (2016), in their study reviewed the opportunities associated with renewable energy sources which includes: Energy Security, Energy Access, Social and Economic development, Climate Change Mitigation, and reduction of environmental and health impacts. The study highlighted Market failures, lack of information, access to raw materials for future renewable resource deployment, and daily carbon footprint as the major challenges that hinder the sustainability of renewable energy sources towards climate change mitigation. The study further suggested reduction in emissions as measures and policy recommendations that would help to mitigate climate change and provide a clean environment as well as clean energy for all and future generations.
Elum, Z. A., & Momodu, A. S. (2017). Their study reviewed that global anthropogenic activities resulting in the emission of harmful greenhouse gases (GHGs) to the atmosphere have increased the challenges faced from climate change. The greater awareness of the need to mitigate climate variability has brought about intense focus on the adverse impacts of fossil-fuel based energy on the environment. Being the single largest source of carbon emissions, energy supply has attracted much attention and more so that, climate change impacts extend beyond national boundaries. Since energy use is sine qua non to economic development, scientists have reiterated the necessity of developing and utilizing renewable energy. Although, past and present CO2 emissions have and are majorly caused by industrialized countries, it is envisaged that future GHGs emissions would be mostly from developing countries as they industrialize. Renewable energy sources that include biomass, hydroelectric, wind, solar and hydrothermal systems, are carbon-neutral, releasing relatively no emissions.
Elum and Momodu (2017), examined Climate change mitigation and renewable energy for sustainable development in Nigeria, their study discussed the initiatives associated with the provision of renewable energy to the energy mix in Nigeria as an indication of the country’s commitment to adopt a sustainable development strategy in shaping the economy. It reviews the literature and employs a discourse analysis to examine the limited use of renewable energy sources in Nigeria and the factors prevailing against their development. The paper concludes by identifying social and political obstacles as most significant roadblocks towards rapid implementation of a green economy through the deployment of renewable energy for sustainable development.
Bahauddin and Salahuddin (2012), investigate the prospect, trend, utilization and development of renewable energy resources and its technology as well as reviews the policy and institution and opportunities of renewable energy technology and finally finds out the impact and role of this technology towards sustainable development and climate change mitigation in context of Bangladesh.
Fujimori et al (2020), in their study measured the sustainable development implications of climate change mitigation identified that synergies and trade-offs exist between climate mitigation actions and target indicators of the Sustainable Development Goals (SDGs). The study developed ‘marginal SDG-emissions-reduction values (MSVs)’, which represent the marginal impacts on SDG indicators caused by a unit CO2 emissions reduction. This metric is applicable to national assessments and was applied to Asia. The study found clear relationships between CO2 emissions reduction rates and many SDG targets. For instance, 1% reduction of CO2 can avoid 0.57% of air pollution-related premature deaths (SDG3), whereas the mean species richness (SDG15) is decreased by 0.026% with the same reduction (not including climate change impacts). The findings are useful for assessing the SDG implications associated with CO2 emissions reduction targets, which will help inform national climate policies.
Cohen, et al (2021), examined co-benefits and trade-offs of climate change mitigation actions and the Sustainable Development Goals studied the relationships between climate change mitigation action and co-impacts and the Sustainable Development Goals (SDGs) are explored and illustrated using a selection of examples from countries’ Nationally Determined Contributions (NDCs). We suggest that in the context of SDGs, the co-benefits approach could provide a cohesive framing to incentivize stakeholders to work together to garner support for ambitious policy which simultaneously achieves climate change mitigation and non-climate objectives. Similarly, understanding of adverse side-effects can help to ensure that trade-offs with delivery of the SDGs arising from mitigation actions are recognized and minimized. We note that the best way of framing these concepts is context and application specific.
Ali, Anufriev and Amfo (2021), investigated green economy implementation in Ghana as a road map for a sustainable development drive, used the SWOT analytical tool to access the strengths, weaknesses, opportunities, threats of Ghana’s green economy transformation efforts. The results revealed that the country’s geographical location, environmental policies, potential for green energy mix, a young and dynamic population, the country’s effort to reduce poverty levels and illiteracy rates are the main strengths. However, factors such as weak institutions, inadequate funding for green technologies innovations, inadequate long-term policies for green strategies and inadequate political will are some key weaknesses. The study further found commercial interests in driving the development and transfer of green technology, cross-border collaborations and global attention to climate change, local and international support for green economy, awareness and understanding of environmental protection as some of the major opportunities. Inadequate commitment to support technology development and transfer, cost of green technologies, increasing threat of climate change and corruption were identified as threats to Ghana’s effort to green its economy. The study thus recommends that policy makers develop strategies that can help take advantage of the strengths and opportunities while serving as solutions to the weakness and threats, such as prioritizing science and technology education to support green economy development.
Anser et al (2021), studied the relationship of environment with technological innovation, carbon pricing, renewable energy, and global food production worked on given factors and evaluated the global pace of economic growth towards sustainable development. The ex-ante and ex-post analysis was carried out on the world aggregated data for a period of 1980–2017. The results show that knowledge spillover, combustible renewables & waste, and carbon pricing substantially decrease carbon emissions, whereas trademark applications have a direct relationship with carbon emissions that exhibit the innovation embodied emissions at a global scale. The results support the inverted U-shaped relationship between carbon emissions and global income with a turning point of US$15,800 and US$11,100 by using FMOLS and DOLS estimators respectively. The ex-ante analysis shows that knowledge spillover, trademark applications, and carbon pricing will largely decrease carbon emissions while carbon pricing, food production index, FDI inflows, and broad money supply will decrease fossil fuel emissions for the next 10 years’ time period.
THEORETICAL REVIEW
EKC hypothesis
The environmental Kuznets curve (EKC) is a hypothesized relationship between environmental quality and economic development: various indicators of environmental degradation have a tendency to get worse as modern economic growth occurs until average income reaches a certain point over the course of development. The EKC suggests, in sum, that “the solution to pollution is economic growth.”. Although subject to continuing debate, there is considerable evidence to support the application of environmental Kuznets curve for various environmental health indicators, such as water, air pollution and ecological footprint which show the inverted U-shaped curve as per capita income and/or GDP rise. It has been argued that this trend occurs in the level of many of the environmental pollutants, such as; sulfur dioxide, nitrogen oxide, lead, chlorofluorocarbons oxide sewage, and other chemicals previously released directly into the air or water.
Figure 1
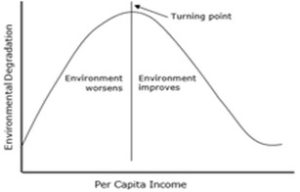
Hypothetical environmental Kuznets curve: a translation of the Kuznets curve to the use of natural resources.
SOURCE: en.wikipedia.org/wiki/Kuznets_curve
METHODOLOGY
To avoid the problem of cross-sectional dependence (CSD) between units this study employs a second-generation unit root test by Pesaran (2007) – the Augmented Dickey-Fuller (ADF) unit root test and the Phillips-Perron (PP) Unit Root Test. The test equation for the ADF test is:
\[ \Delta y_t = \alpha + \beta t + \gamma y_{t-1} + \delta \Delta y_{t-1} + \dots + \delta_{p-1} \Delta y_{t-p+1} + \varepsilon_t \quad \text{(1)} \]
The following hypothesis is to be tested:
\[ H_0: \gamma = 0 \quad \text{or} \quad \beta = \gamma = 0 \quad \text{or} \quad \alpha = \beta = \gamma = 0 \quad \text{(2)} \]
If the null hypothesis is rejected it means the series has no unit root.
The Phillip-Peron controls for serial correlation when testing for a unit root. The following equation is to be tested:
\[ \Delta y_t = \gamma y_{t-1} + x_t’ \delta + \epsilon_t \quad \text{(3)} \]
The t-ratio of the γ coefficient is tested so that the asymptotic distribution of the test statistics is not affected by serial correlation. The statistics for the PP test is
\[ \bar{t}_{\gamma} = t_{\gamma} \left( \frac{\gamma_0}{f_0} \right)^{1/2} – \frac{T \left( f_0 – \gamma_0 \right)(s \epsilon (\hat{\gamma}))}{2 f_0^{1/2} s}\text{(4)} \]
Where γ is the estimate \( t_{\gamma} \) is the t-ratio of γ \( s_{\epsilon \gamma} \) is the standard error of the coefficient. \( \gamma_0 \) is a consistent estimate of error variance and the \( f_0 \) is residual spectrum estimator at zero frequency.
Cointegration Test
The presence of either long-run or short-run relationship is tested using the NARDL bounds test for cointegration proposed by Shin et al. (2014). This test could produce robust results in the event of the mixture in order of integration among the series. The suitable equation for testing cointegration relations among the variables is stated thus:
\[ \Delta DEV = \alpha_0 + \sum_{i=1}^{p} \beta_1 \Delta DEV_{t-1} + \sum_{j=0}^{q} \gamma_j \Delta EFP_{t-j} + \sum_{k=0}^{r} \pi_k \Delta CLIMCH_{t-k} + \sum_{l=0}^{s} \phi_l \Delta GENERGY_{t-l} + \sum_{m=0}^{T} \vartheta_m \Delta LOGEDU_{t-m} + \mu_1 DEV_{t-1} + \mu_2 EFP_{t-1} + \mu_3 CLIMCH_{t-1} + \mu_4 GENERGY_{t-1} + \mu_5 EDU_{t-1} + v_t \quad \text{(5)} \]
where; \( p, q, r, s, \) and \( T \) denote the respective optimal lagged differences of DEV, EFP, CLIMCH, GENERGY, and EDU. DEV = Sustainable Development, EFP = Ecological Footprint, CLIMCH = Climate Change, GENERGY = Green Energy Consumption, and EDU = Education.
Estimated Model
The empirical focus of this study is to empirically verify the relationship between sustainable development, climate change, and green energy in Nigeria. Sustainable development is captured by GNI per capita; Ecological footprint is captured; Climate change is captured by CO2 emissions; Green energy is captured by renewable energy consumption; while the control variable of Education is captured by Government expenditures on education. The GNI per capita, CO2 emissions, and Renewable energy consumption are sourced from the World Development Indicator (WDI 2022); Government expenditures on education is sourced from the World Bank Database (World Bank 2022); while the Ecological footprint is sourced from the Global Footprint Network (Global Footprint 2022). The Nonlinear Auto Regressive Distributive Lag (NARDL) model was employed to define the long-run effect while the Short-run NADRL and Cointegration Equation (Cointeq(-1)) was employed to define the short-run effect for this empirical investigation. The NARDL model is hereby specified thus putting into consideration the various theoretical underpinnings and assumptions of the model:
\[ DEV = F (EFP, CLIMCH, GENERGY, EDU) \quad \text{(6)} \]
The model can be further transformed into an econometric model in the form of a long-run model and a short-run model thus:
The Long-run Model
\[ \Delta DEV_t = \varphi_0 + \rho DEV_{t-1} + \varphi_1^+ EFP_{t-1}^+ + \varphi_2^- EFP_{t-1}^- + \varphi_3^+ CLIMCH_{t-1}^+ + \varphi_4^- CLIMCH_{t-1}^- + \varphi_5^+ GENERGY_{t-1}^+ + \varphi_6^- GENERGY_{t-1}^- + \varphi_7^+ EDU_{t-1}^+ + \varphi_8^- EDU_{t-1}^- + \mu_{1t} \quad \text{(7)} \]
The Short-Run Model (ECM)
\[ \Delta DEV_t = \varphi_0 + \sum_{i=1}^{p} \partial_{1i} \Delta DEV_{t-i} + \sum_{i=0}^{q} \partial_{2i} \Delta EFP_{t-i}^+ + \sum_{i=0}^{q} \partial_{3i} \Delta EFP_{t-i}^- + \sum_{i=0}^{q} \partial_{4i} \Delta CLIMCH_{t-i}^+ + \sum_{i=0}^{q} \partial_{5i} \Delta CLIMCH_{t-i}^- + \sum_{i=0}^{q} \partial_{6i} \Delta GENERGY_{t-i}^+ + \sum_{i=0}^{q} \partial_{7i} \Delta GENERGY_{t-i}^- + \sum_{i=0}^{q} \partial_{8i} \Delta LOGEDU_{t-i}^+ + \sum_{i=0}^{q} \partial_{9i} \Delta LOGEDU_{t-i}^- + \varphi ECM_{t-i} + \varepsilon_{1t} \quad \text{(8)} \]
DISCUSSION OF FINDINGS
Stationarity Test
To prevent the problem of nonsense regression occasioned by the non-stationarity of time-series data, the Augmented Dickey-Fuller and Phillips-Perron tests of stationarity are carried out to test for unit root in the variables. The results are presented below.
Table 4.1: Unit Root Tests Result
| VARIABLES | AT LEVEL | AT FIRST DIFFERENCE | ORDER OF INTEGRATION | ||
| ADF | PP | ADF | PP | ||
| Development | – | – | -3.5226** | -3.4374** | I (1) |
| Ecological footprint | – | – | -7.1583** | -7.1504** | I (1) |
| Climate Change | – | – | -7.2377** | -7.2552** | I (1) |
| Green Energy | -5.2511** | -5.2814** | -5.0938** | -14.7104** | I (0), I (1) |
| Education | – | – | -6.6014** | -6.5992** | I (1) |
SOURCE: Author’s compilation, 2022.
Note: Levels of significance are represented thus: Values with ** are significant at all levels.
From the ADF results above, Sustainable development, ecological footprint, climate change, green energy, and education are stationary at first difference while only green energy is stationary at levels. The variables are significant at all levels (1%, 5%, and 10%). On the other hand, the PP results show that all variables (Sustainable development, ecological footprint, climate change, green energy, and education) are stationary at first difference. However, only green energy consumption is stationary at levels. The variables are significant at all levels (1%, 5%, and 10%). From the results, both stationarity (i.e. ADF & PP) results are integrated of order 1 (I (1)), except for green energy consumption alone which is integrated of order 0 (I (0)) also. Hence, the variables are fit for a time-series analysis as they are all integrated within orders 0 and 1.
The study goes further to ascertain the presence of either a long-run or short-run relationship between the variables using the NARDL bounds test.
Table 4.2: The NARDL Bounds Test Results
SOURCE: Author’s Compilation, 2022.
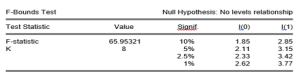
The Peseran and Shin (2001) criteria stipulates that, for cointegration or a long-run relationship, the F-statistic of the bounds test must be greater than the upper bounds (the I (1) bound) at all significance levels (1%, 2.5%, 5%, 10%). On the other hand, if the F-statistic lies below the lower bounds (the I (0) bound) at all level of significance, then there is a no-cointegration condition or short-run relationship among the variables. If the F-statistic falls between the I (0) and I (1) bounds at all significance levels, then the result is inconclusive.
With the F-statistic value of 65.95321 which is greater than the upper bounds (I (1)) bound at all significance level, there exists a Long-run relationship between sustainable development and ecological footprint, climate change, green energy, and education. Therefore, a Long-run NARDL model and an Error Correction Model (ECM) is estimated for the variables as stipulated by Peseran and Shin (1999).
Table 4.3: The NARDL Long-run Models Results
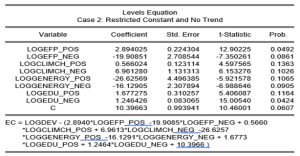
SOURCE: Author’s Compilation 2022. Note: DEV=Sustainable Development; LOGEFP_POS=Positive Change in the Log of Ecological Footprint; LOGEFP_NEG=Negative Change in the Log of Ecological Footprint; LOGCLIMCH_POS=Positive Change in the Log of Climate Change; LOGCLIMCH_NEG=Negative Change in the Log of Climate Change; LOGGENERGY_POS=Positive Change in the Log of Green Energy Consumption; LOGGENERGY_NEG=Negative Change in the Log of Green Energy Consumption; LOGEDU_POS=Positive Change in the Log of Education; LOGEDU_NEG=Negative Change in the Log of Education.
The long run estimates from table 4.3 are evaluated at the 0.05 significance level. The estimates indicate that only positive changes in the level of ecological footprint and negative changes in the educational level significantly impact sustainable development in the long-run in Nigeria. All changes in climate change and green energy, negative changes in ecological footprint, and positive changes in the education level, do not significantly impact sustainable development in Nigeria in the long-run.
A unit rise in the level of ecological footprint in Nigeria causes sustainable development to rise by 2.89% while a unit fall in the value of education in the country causes sustainable development in Nigeria to fall by 1.24%, in the long-run. There are asymmetric relationships between sustainable development and positive change in ecological footprint on one hand and negative change in educational level on the other hand. The implication of the impact relationship between ecological footprint and sustainable development is that Nigeria is still at the early stage of the environmental Kuznets curve where countries consume more energy and deplete more resources on their path to economic development through industrialization (Grossman & Krueger, 1995; York et al., 2003). This is peculiar to developing countries which Nigeria happens to be part of. The positive relationship between negative change in educational level and sustainable development in Nigeria signifies the positive role that education plays in the sustainable development of Nigeria. This is because quality education improves the skill level of Nigerian workforce making them more innovative and productive, thereby contributing more to the country’s development drive (Hanushek & Woessmann, 2008).
Climate change and green energy changes do not affect sustainable development in Nigeria in the long run. This shows the non-long-term focus of the Nigerian policy measures (Leach, 1999). Since the national development plans, the NEEDS program, the 7-point agenda, and the 3-point agenda, Nigeria has not really had actual long-term policy initiatives. Even a lot of the long-term policy initiatives were cut short by political regime changes. The short-term nature of policy measures in Nigeria overshadows the long-term impacts of environmental phenomena like climate change and green energy consumption. Despite the long-run lack of impact on sustainable development in Nigeria, scholars should still worry about climate change and green energy consumption in Nigeria because of the perceived vulnerabilities of the country in the future (Sambo, 2009). Nigeria experiences climate change-related impacts like rising sea levels, rising temperatures, and irregular rainfall patterns. This shows Nigeria also experiences climate change effects and has a pressing need to diversify to higher green energy consumption to curb such effects. Also, there is a need for researchers and policy makers to focus on green energy consumption and climate change mitigation in Nigeria, despite its minimal contribution to global climate change, due to the strategic role of the country (Niang et al., 2014). Nigeria is a major leader in the African region and its adoption and promotion of favorable climate change practices would have a significant impact on the African region (UNDP, 2019).
Table 4.4: The NARDL Short-run and Cointegration Equation Results
| Dependent Variable | DEVELOPMENT | |||
| Independent Variables | Coefficients | Standard Error | T-Statistics | Probability |
| D(LOGEFP_POS) | -1.233233 | 0.233746 | -5.275948 | 0.1192 |
| D (LOGEFP_POS (-2) | -7.307548 | 0.535000 | -13.65896 | 0.0465 |
| D(LOGEFP_NEG) | -0.417774 | 0.350355 | -1.192431 | 0.4443 |
| D(LOGCLIMCH_POS) | 1.033537 | 0.070021 | 14.76030 | 0.0431 |
| D (LOGCLIMCH_POS (-1) | 1.524048 | 0.106304 | 14.33673 | 0.0443 |
| D(LOGCLIMCH_NEG) | -0.728503 | 0.073107 | -9.964914 | 0.0637 |
| D (LOGCLIMCH_NEG (-1) | -3.293272 | 0.248753 | -13.23914 | 0.0480 |
| D (LOGGENERGY_POS) | -7.456751 | 0.571464 | -13.04851 | 0.0487 |
| D (LOGGENERGY_POS (-2) | -9.660807 | 0.700867 | -13.78409 | 0.0461 |
| D (LOGGENERGY_POS (-3) | -6.434982 | 0.507106 | -12.68961 | 0.0501 |
| D (LOGGENERGY_NEG) | 7.595722 | 0.503527 | 15.08502 | 0.0421 |
| D (LOGGENERGY_NEG (-1) | 19.41122 | 1.455510 | 13.33637 | 0.0476 |
| D (LOGGENERGY_NEG (-2) | 13.53844 | 0.983596 | 13.76423 | 0.0462 |
| D (LOGGENERGY_NEG (-3) | 4.888048 | 0.381176 | 12.82361 | 0.0495 |
| D (LOGEDU_POS) | 0.262084 | 0.040774 | 6.427781 | 0.0983 |
| D (LOGEDU_POS (-3) | 0.479785 | 0.036991 | 12.97049 | 0.0490 |
| D (LOGEDU_NEG) | 1.320259 | 0.063118 | 20.91737 | 0.0304 |
| CointEq(-1)* | -0.560073 | 0.006896 | -81.21158 | 0.0078 |
| R-squared | 0.999951 | |||
| Adjusted R-squared | 0.999779 | |||
| Durbin-Watson stat | 3.130818 | |||
SOURCE: Author’s Compilation 2022.
The above results are evaluated at the 0.05 significance level. The short run estimates from table 4.4 indicates that positive and negative changes in the ecological footprint level in Nigeria in the current period do not have significant impacts on sustainable development in the short-run. However, a positive change in the level of ecological footprint two periods ago negatively significantly impacts sustainable development. A unit rise in ecological footprint two periods ago causes sustainable development to fall by 7.31%. The positive change in climate change has a positive effect on sustainable development while the negative change does not have any effect. A unit improvement in the climate change condition in Nigeria causes sustainable development to rise by 1.03%. However, positive and negative changes in the condition of climate change in Nigeria, in the immediate past period, causes positive and negative impacts on sustainable development respectively. A unit positive change in the condition of climate change causes sustainable development to rise by 1.52% while a unit fall in same period causes sustainable development to rise by 3.29%. In the current period, positive and negative changes in the consumption of green energy in Nigeria have both negative and positive significant effects on sustainable development respectively. A percentage increase in the consumption of renewable energy in the energy mix in Nigeria, in the current period, causes sustainable development to fall by 7.46% while a percentage fall in such consumption causes sustainable development to fall by 7.6%. Meanwhile, positive changes in the consumption of green energy in the mix in Nigeria, two and three periods ago have negative significant impacts on sustainable development. A 1% rise in the consumption of renewable energy in the mix causes sustainable development to fall by 9.66% in the second previous period and by 6.43% in the third previous period. Also, negative changes in the consumption of renewable energy in the energy mix in Nigeria has positive impacts on sustainable development in the previous periods. A 1% fall in the portion of renewable energy consumed in the mix in Nigeria causes sustainable development level to fall by 19.41% in the immediate past period, 13.54% in the second previous period and 4.89% in the third previous period respectively. Only positive change in the educational level on the third previous period positively and significantly affects sustainable development in Nigeria. A rise in the educational level by 1% causes sustainable development in Nigeria to rise by 0.48%. Also, a negative change in the educational level in Nigeria exhibits a positive relationship with sustainable development. A 1% fall in the educational level causes sustainable development to fall by 1.32%.
As expected, the coefficient of the cointegrating equation is significant with the expected negative sign and below unity (-0.560073). The negative sign of the error correction term indicates a backward movement toward long run equilibrium from short run disequilibrium The coefficient of the error correction term being below unity (-0.560073) simply means that the model corrects itself at the speed of 56% annually. In other words, the speed of adjustment to long run equilibrium is 56% annually.
The coefficient of multiple determination (R2) shows that the explanatory variable captured in the model jointly explains 99.995% of the movement in the dependent variable with the R2 adjusted of 99.9779% (0.999779). The efficiency, linearity, unbiasedness and the size of the coefficients, standard-errors and the reliability of the t-stats depend on the assumption of no autocorrelation and spuriosity of the test results. The Durbin Watson (DW) test is the most common test for autocorrelation and is based on the assumption that the structure of the autocorrelation is of first order. The Durbin Watson Statistics in the model is 3.13 (over 2), indicating that the model is free from the problem of serial auto-correlation. Therefore, there is no evidence of first order auto-correlation.
Theoretical Findings
The positive relationship between sustainable development (proxy as Per-Capital Income) and ecological footprint which could also be proxy for environmental degradation implies that Nigeria is still at the early stages of the Environmental Kuznets Curve (EKC). The positive relationship can be placed on the fact that the Nigerian economy is heavily dependent on the oil sector for her revenue and at the same time the sector is largely responsible for gas flaring (CO2 Emission) in the Country. As a developing economy, Nigeria consumes more of dirty energy, both as a source of revenue and in the course of its industrialization drive towards development.
Table 4.5: The Post-Estimation Tests Results
| Test | F-Statistics | Prob |
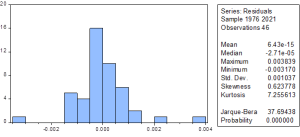
| Normality Test | 37.69438 | 0.0000 |
| Heteroskedasticity Test | 0.342663 | 0.9054 |
| Cusum Test | Stable | |
| Cusum Square | Stable |
SOURCE: Author’s Compilation 2022
The Jarque-Bera test for normality has a probability value of 37.6944<0.05 which implies that the residuals of the model are normally distributed. The Heteroskedasticity test probability value of 0.3427>0.05 implies that the variation of the residuals in the model are free from Heteroskedasticity. The cusum test indicates that the model is stable and the cusum square test shows that the model does not suffer from structural breaks.
CONCLUSION
In the long-run in Nigeria, there exists a long-run relationship between sustainable development and the positive change in climate change, and the negative change in the educational level. Climate change and green energy consumption have no significant impact on sustainable development in the long-run. In the current period of the short-run, only positive change in climate, positive and negative changes in green energy consumption, and negative change in the educational level affects sustainable development in Nigeria. The previous periods changes have mixed effects on sustainable development in the country.
The positive relationship between positive ecological footprint and sustainable development according to the EKC hypothesis puts Nigeria in the early stages of the curve thus the study implores the government to develop measures that will curb CO2 emission and other factors worsening the ecological footprint, such as carbon pricing and give attention to harnessing Natural gasses which will in turn lead to reduced emission and more income projections. Also, more attention should also be given to renewable energy as this sector has the capacity to reduce the ecological footprint level while providing clean energy.
The positive relationship between negative change in educational level and sustainable development in Nigeria signifies the positive role that education plays in the sustainable development of Nigeria as quality education improves the skill level of Nigerian workforce making them more innovative and productive, thereby contributing more to the country’s development drive. The non-impact of Climate change and green energy changes on sustainable development in Nigeria in the long run shows the non-long-term focus of the Nigerian policy measures. Despite the long-run lack of impact on sustainable development in Nigeria, scholars should still focus on climate change and green energy consumption in Nigeria because of the perceived vulnerabilities to climate change of the country in the future. Also, there is a need for researchers and policy makers to focus on green energy consumption and climate change mitigation in Nigeria, despite its minimal contribution to global climate change, due to the strategic role of the country in achieving energy transition and sustainable development in Africa.
For effective policy applications:
- Statistical offices should incorporate the factors of climate change and green energy consumption to adequately measure sustainable development in Nigeria.
- Policy makers should embrace long-term policy measures that incorporate issues of climate change and energy transition as indicators of sustainable development in the country.
- The policy makers should focus education-related policies on improving the capacity of education to imbibe innovative skills on individuals to enable them innovate in the larger society and contribute significantly to the development process of the country.
- The government should create policies aimed at improving institutional training, carbon pricing and improving capacity of research on ecological footprint and climate change as it will increase awareness, promote adaptation and ensure sustainable development.
REFERENCES
- Ali, E. B., Anufriev, V. P., & Amfo, B. (2021). Green economy implementation in Ghana as a road map for a sustainable development drive: A review. Scientific African, 12, e00756.
- Anser, M. K., Khan, M. A., Nassani, A. A., Aldakhil, A. M., Hinh Voo, X., & Zaman, K. (2021). Relationship of environment with technological innovation, carbon pricing, renewable energy, and global food production. Economics of Innovation and New Technology, 30(8), 807-842.
- Asmelash H. B. (2017). Falling oil prices and sustainable energy transition: towards a multilateral agreement on fossil-fuel subsidies in The Political Economy of Clean Energy Transitions, D. Arent, C. Arndt, M. Miller, F. Tarp, and O. Zinaman, Eds. Oxford: Oxford University Press, pp. 349–367.
- Bahauddin, K. M., & Salahuddin, T. M. (2012). Prospect and trend of renewable energy and its technology towards climate change mitigation and sustainable development in Bangladesh. International Journal of Advanced Renewable Energy Research, 1(3), 156-166.
- Boadu F. O. (2016). Agricultural law and economics in Sub-Saharan Africa: Cases and comments. London: Academic Press, 2016.
- Clémençon R. (2016). The two sides of the paris climate agreement: Dismal failure or historic breakthrough? J. Environ. Dev., vol. 25, no. 1, pp. 3–24.
- Cohen, B., Cowie, A., Babiker, M., Leip, A., & Smith, P. (2021). Co-benefits and trade-offs of climate change mitigation actions and the Sustainable Development Goals. Sustainable Production and Consumption, 26, 805-813.
- Edenhofer, O., Pichs-Madruga, R., Sokona, Y., Seyboth, K., Matschoss, P., Kadner, S., … & von Stechow, C. (2011). IPCC special report on renewable energy sources and climate change mitigation. Prepared By Working Group III of the Intergovernmental Panel on Climate Change, Cambridge University Press, Cambridge, UK.
- Elum Z A, Modise D M and Nhamo, G. (2017). Climate change mitigation: the potential of agriculture as a renewable energy source in Nigeria. Environ. Sci. Pollut. Res., vol. 24, no. 4, pp. 3260–3273.
- Elum, Z. A., & Momodu, A. S. (2017). Climate change mitigation and renewable energy for sustainable development in Nigeria: A discourse approach. Renewable and Sustainable Energy Reviews, 76, 72-80.
- Fujimori, S., Hasegawa, T., Takahashi, K., Dai, H., Liu, J. Y., Ohashi, H., … & Hijioka, Y. (2020). Measuring the sustainable development implications of climate change mitigation. Environmental Research Letters, 15(8), 085004.
- Grossman, G. M., & Krueger, A. B. (1995). Economic growth and the environment. The quarterly journal of economics, 110(2), 353-377.
- Hanushek, E. A., & Woessmann, L. (2008). The role of cognitive skills in economic development. Journal of economic literature, 46(3), 607-668.
- Leach, M., Mearns, R., & Scoones, I. (1999). Environmental entitlements: dynamics and institutions in community-based natural resource management. World development, 27(2), 225-247.
- Majid, M. A. (2020). Renewable energy for sustainable development in India: current status, future prospects, challenges, employment, and investment opportunities. Energy, Sustainability and Society, 10(1), 1-36.
- Nawaz, M. A., Seshadri, U., Kumar, P., Aqdas, R., Patwary, A. K., & Riaz, M. (2021). Nexus between green finance and climate change mitigation in N-11 and BRICS countries: empirical estimation through difference in differences (DID) approach. Environmental Science and Pollution Research, 28(6), 6504-6519.
- Niang, I., Ruppel, O. C., Abdrabo, M. A., Essel, A., Lennard, C., Padgham, J., & Urquhart, P. (2014). Climate change 2014: impacts, adaptation, and vulnerability. Part B: regional aspects. Contribution of working Group II to the fifth assessment report of the intergovernmental panel on climate change. Climate Change 2014: Impacts, Adaptation and Vulnerability: Part B: Regional Aspects: Working Group II Contribution to the Fifth Assessment Report of the Intergovernmental Panel on Climate Change, 1199-1266.
- NRDC, (2017). The Paris agreement on climate change. Available: https://assets.nrdc.org/sites/default/files/paris-agreement-climate-change-2017-ib.pdf. [Accessed: 30-Mar-2020].
- Owusu, P. A., & Asumadu-Sarkodie, S. (2016). A review of renewable energy sources, sustainability issues and climate change mitigation. Cogent Engineering, 3(1), 1167990.
- Pakulska, T. (2021). Green energy in central and eastern European (Cee) countries: new challenges on the path to sustainable development. Energies, 14(4), 884.
- Pielke R. A. (2004). What is climate change? Energy Environ., vol. 15, no. 3, pp. 515–520.
- Pulselli F M and Marchi M. (2015). Global Warming Potential and the Net Carbon Balance, in Earth Systems and Environmental Sciences, Elsevier Inc., pp. 1–7.
- Reicosky D C, Goddard T W, Enerson D, Chan A S K and Liebig M A (2012). Agricultural greenhouse gas trading markets in North America, in Managing agricultural greenhouse gases: coordinated agricultural research through GRACEnet to address our changing climate, M. Liebig, A. J. Franzluebbers, and R. Follett, Eds. London: Academic Press, pp. 423–437.
- Sambo, A. S. (2009). Strategic developments in renewable energy in Nigeria. International Association for Energy Economics, 16(3), 15-19.
- Sovacool B K (2017). The history and politics of energy transitions: comparing contested views and finding common ground, in the political economy of clean energy transitions, D. Arent, C. Arndt, M. Miller, F. Tarp, and O. Zinaman, Eds. Oxford: Oxford University Press, pp. 16– 35.
- Thompson G. and Kuo G. (2012). Climate change the evidence and our options. World Futur. Rev., vol. 4, no. 2, pp. 114–122.
- United Nations, (1992). United nations framework convention on climate change. Available: https://unfccc.int/resource/ccsites/zimbab/conven/text/fulltext.htm. [Accessed: 20-Mar-2020].
- United Nations Development Programme (UNDP). (2019). Human Development Report 2019: Beyond income, beyond averages, beyond today: Inequalities in human development in the 21st century.
- York, R., Rosa, E. A., & Dietz, T. (2003). STIRPAT, IPAT and ImPACT: analytic tools for unpacking the driving forces of environmental impacts. Ecological economics, 46(3), 351-365.
- Zafar, M. W., Saeed, A., Zaidi, S. A. H., & Waheed, A. (2021). The linkages among natural resources, renewable energy consumption, and environmental quality: A path toward sustainable development. Sustainable Development, 29 (2), 353-362.
APPENDICES
UNIT ROOT RESULT FOR DEVELOPMENT (ADF)
| Null Hypothesis: D(LOGDEV) has a unit root | ||||
| Exogenous: Constant | ||||
| Lag Length: 0 (Automatic – based on SIC, maxlag=10) | ||||
| t-Statistic | Prob.* | |||
| Augmented Dickey-Fuller test statistic | -3.522597 | 0.0114 | ||
| Test critical values: | 1% level | -3.571310 | ||
| 5% level | -2.922449 | |||
| 10% level | -2.599224 | |||
| *MacKinnon (1996) one-sided p-values. | ||||
| Augmented Dickey-Fuller Test Equation | ||||
| Dependent Variable: D(LOGDEV,2) | ||||
| Method: Least Squares | ||||
| Date: 05/24/24 Time: 17:23 | ||||
| Sample (adjusted): 1973 2021 | ||||
| Included observations: 49 after adjustments | ||||
| Variable | Coefficient | Std. Error | t-Statistic | Prob. |
| D(LOGDEV(-1)) | -0.416541 | 0.118248 | -3.522597 | 0.0010 |
| C | 0.019157 | 0.019114 | 1.002240 | 0.3214 |
| R-squared | 0.208870 | Mean dependent var | -0.001564 | |
| Adjusted R-squared | 0.192037 | S.D. dependent var | 0.141626 | |
| S.E. of regression | 0.127303 | Akaike info criterion | -1.244540 | |
| Sum squared resid | 0.761679 | Schwarz criterion | -1.167323 | |
| Log likelihood | 32.49124 | Hannan-Quinn criter. | -1.215244 | |
| F-statistic | 12.40869 | Durbin-Watson stat | 2.120481 | |
| Prob(F-statistic) | 0.000963 | |||
UNIT ROOT RESULT FOR DEVELOPMENT (PP)
| Null Hypothesis: D(LOGDEV) has a unit root | ||||
| Exogenous: Constant | ||||
| Bandwidth: 4 (Newey-West automatic) using Bartlett kernel | ||||
| Adj. t-Stat | Prob.* | |||
| Phillips-Perron test statistic | -3.437416 | 0.0142 | ||
| Test critical values: | 1% level | -3.571310 | ||
| 5% level | -2.922449 | |||
| 10% level | -2.599224 | |||
| *MacKinnon (1996) one-sided p-values. | ||||
| Residual variance (no correction) | 0.015544 | |||
| HAC corrected variance (Bartlett kernel) | 0.014322 | |||
| Phillips-Perron Test Equation | ||||
| Dependent Variable: D(LOGDEV,2) | ||||
| Method: Least Squares | ||||
| Date: 05/24/24 Time: 17:37 | ||||
| Sample (adjusted): 1973 2021 | ||||
| Included observations: 49 after adjustments | ||||
| Variable | Coefficient | Std. Error | t-Statistic | Prob. |
| D(LOGDEV(-1)) | -0.416541 | 0.118248 | -3.522597 | 0.0010 |
| C | 0.019157 | 0.019114 | 1.002240 | 0.3214 |
| R-squared | 0.208870 | Mean dependent var | -0.001564 | |
| Adjusted R-squared | 0.192037 | S.D. dependent var | 0.141626 | |
| S.E. of regression | 0.127303 | Akaike info criterion | -1.244540 | |
| Sum squared resid | 0.761679 | Schwarz criterion | -1.167323 | |
| Log likelihood | 32.49124 | Hannan-Quinn criter. | -1.215244 | |
| F-statistic | 12.40869 | Durbin-Watson stat | 2.120481 | |
| Prob(F-statistic) | 0.000963 | |||
UNIT ROOT RESULT FOR ECOLOGICAL FOOTPRINT (ADF)
| Null Hypothesis: D(LOGEFP) has a unit root | ||||
| Exogenous: Constant | ||||
| Lag Length: 0 (Automatic – based on SIC, maxlag=10) | ||||
| t-Statistic | Prob.* | |||
| Augmented Dickey-Fuller test statistic | -7.158309 | 0.0000 | ||
| Test critical values: | 1% level | -3.571310 | ||
| 5% level | -2.922449 | |||
| 10% level | -2.599224 | |||
| *MacKinnon (1996) one-sided p-values. | ||||
| Augmented Dickey-Fuller Test Equation | ||||
| Dependent Variable: D(LOGEFP,2) | ||||
| Method: Least Squares | ||||
| Date: 05/24/24 Time: 17:26 | ||||
| Sample (adjusted): 1973 2021 | ||||
| Included observations: 49 after adjustments | ||||
| Variable | Coefficient | Std. Error | t-Statistic | Prob. |
| D(LOGEFP(-1)) | -1.016947 | 0.142065 | -7.158309 | 0.0000 |
| C | 0.023994 | 0.007324 | 3.275875 | 0.0020 |
| R-squared | 0.521587 | Mean dependent var | 0.001493 | |
| Adjusted R-squared | 0.511408 | S.D. dependent var | 0.066252 | |
| S.E. of regression | 0.046310 | Akaike info criterion | -3.266972 | |
| Sum squared resid | 0.100795 | Schwarz criterion | -3.189755 | |
| Log likelihood | 82.04082 | Hannan-Quinn criter. | -3.237676 | |
| F-statistic | 51.24139 | Durbin-Watson stat | 1.994482 | |
| Prob(F-statistic) | 0.000000 | |||
UNIT ROOT RESULT FOR ECOLOGICAL FOOTPRINT (PP)
| Null Hypothesis: D(LOGEFP) has a unit root | ||||
| Exogenous: Constant | ||||
| Bandwidth: 3 (Newey-West automatic) using Bartlett kernel | ||||
| Adj. t-Stat | Prob.* | |||
| Phillips-Perron test statistic | -7.150375 | 0.0000 | ||
| Test critical values: | 1% level | -3.571310 | ||
| 5% level | -2.922449 | |||
| 10% level | -2.599224 | |||
| *MacKinnon (1996) one-sided p-values. | ||||
| Residual variance (no correction) | 0.002057 | |||
| HAC corrected variance (Bartlett kernel) | 0.002231 | |||
| Phillips-Perron Test Equation | ||||
| Dependent Variable: D(LOGEFP,2) | ||||
| Method: Least Squares | ||||
| Date: 05/24/24 Time: 17:36 | ||||
| Sample (adjusted): 1973 2021 | ||||
| Included observations: 49 after adjustments | ||||
| Variable | Coefficient | Std. Error | t-Statistic | Prob. |
| D(LOGEFP(-1)) | -1.016947 | 0.142065 | -7.158309 | 0.0000 |
| C | 0.023994 | 0.007324 | 3.275875 | 0.0020 |
| R-squared | 0.521587 | Mean dependent var | 0.001493 | |
| Adjusted R-squared | 0.511408 | S.D. dependent var | 0.066252 | |
| S.E. of regression | 0.046310 | Akaike info criterion | -3.266972 | |
| Sum squared resid | 0.100795 | Schwarz criterion | -3.189755 | |
| Log likelihood | 82.04082 | Hannan-Quinn criter. | -3.237676 | |
| F-statistic | 51.24139 | Durbin-Watson stat | 1.994482 | |
| Prob(F-statistic) | 0.000000 | |||
UNIT ROOT RESULT FOR CLIMATE CHANGE (ADF)
| Null Hypothesis: D(LOGCLIMCH) has a unit root | ||||
| Exogenous: Constant | ||||
| Lag Length: 0 (Automatic – based on SIC, maxlag=10) | ||||
| t-Statistic | Prob.* | |||
| Augmented Dickey-Fuller test statistic | -7.237652 | 0.0000 | ||
| Test critical values: | 1% level | -3.571310 | ||
| 5% level | -2.922449 | |||
| 10% level | -2.599224 | |||
| *MacKinnon (1996) one-sided p-values. | ||||
| Augmented Dickey-Fuller Test Equation | ||||
| Dependent Variable: D(LOGCLIMCH,2) | ||||
| Method: Least Squares | ||||
| Date: 05/24/24 Time: 17:27 | ||||
| Sample (adjusted): 1973 2021 | ||||
| Included observations: 49 after adjustments | ||||
| Variable | Coefficient | Std. Error | t-Statistic | Prob. |
| D(LOGCLIMCH(-1)) | -1.053959 | 0.145622 | -7.237652 | 0.0000 |
| C | 0.057486 | 0.030035 | 1.913959 | 0.0617 |
| R-squared | 0.527085 | Mean dependent var | -0.000252 | |
| Adjusted R-squared | 0.517023 | S.D. dependent var | 0.291659 | |
| S.E. of regression | 0.202693 | Akaike info criterion | -0.314287 | |
| Sum squared resid | 1.930971 | Schwarz criterion | -0.237070 | |
| Log likelihood | 9.700043 | Hannan-Quinn criter. | -0.284991 | |
| F-statistic | 52.38361 | Durbin-Watson stat | 2.005933 | |
| Prob(F-statistic) | 0.000000 | |||
UNIT ROOT RESULT FOR CLIMATE CHANGE (PP)
| Null Hypothesis: D(LOGCLIMCH) has a unit root | ||||
| Exogenous: Constant | ||||
| Bandwidth: 2 (Newey-West automatic) using Bartlett kernel | ||||
| Adj. t-Stat | Prob.* | |||
| Phillips-Perron test statistic | -7.255226 | 0.0000 | ||
| Test critical values: | 1% level | -3.571310 | ||
| 5% level | -2.922449 | |||
| 10% level | -2.599224 | |||
| *MacKinnon (1996) one-sided p-values. | ||||
| Residual variance (no correction) | 0.039408 | |||
| HAC corrected variance (Bartlett kernel) | 0.036140 | |||
| Phillips-Perron Test Equation | ||||
| Dependent Variable: D(LOGCLIMCH,2) | ||||
| Method: Least Squares | ||||
| Date: 05/24/24 Time: 17:35 | ||||
| Sample (adjusted): 1973 2021 | ||||
| Included observations: 49 after adjustments | ||||
| Variable | Coefficient | Std. Error | t-Statistic | Prob. |
| D(LOGCLIMCH(-1)) | -1.053959 | 0.145622 | -7.237652 | 0.0000 |
| C | 0.057486 | 0.030035 | 1.913959 | 0.0617 |
| R-squared | 0.527085 | Mean dependent var | -0.000252 | |
| Adjusted R-squared | 0.517023 | S.D. dependent var | 0.291659 | |
| S.E. of regression | 0.202693 | Akaike info criterion | -0.314287 | |
| Sum squared resid | 1.930971 | Schwarz criterion | -0.237070 | |
| Log likelihood | 9.700043 | Hannan-Quinn criter. | -0.284991 | |
| F-statistic | 52.38361 | Durbin-Watson stat | 2.005933 | |
| Prob(F-statistic) | 0.000000 | |||
UNIT ROOT RESULT FOR GREEN ENERGY (ADF – LEVELS)
| Null Hypothesis: LOGGENERGY has a unit root | ||||
| Exogenous: Constant | ||||
| Lag Length: 0 (Automatic – based on SIC, maxlag=10) | ||||
| t-Statistic | Prob.* | |||
| Augmented Dickey-Fuller test statistic | -5.251147 | 0.0001 | ||
| Test critical values: | 1% level | -3.568308 | ||
| 5% level | -2.921175 | |||
| 10% level | -2.598551 | |||
| *MacKinnon (1996) one-sided p-values. | ||||
| Augmented Dickey-Fuller Test Equation | ||||
| Dependent Variable: D(LOGGENERGY) | ||||
| Method: Least Squares | ||||
| Date: 05/24/24 Time: 17:29 | ||||
| Sample (adjusted): 1972 2021 | ||||
| Included observations: 50 after adjustments | ||||
| Variable | Coefficient | Std. Error | t-Statistic | Prob. |
| LOGGENERGY(-1) | -0.724732 | 0.138014 | -5.251147 | 0.0000 |
| C | 3.220173 | 0.613169 | 5.251686 | 0.0000 |
| R-squared | 0.364866 | Mean dependent var | 0.000518 | |
| Adjusted R-squared | 0.351634 | S.D. dependent var | 0.058054 | |
| S.E. of regression | 0.046746 | Akaike info criterion | -3.248993 | |
| Sum squared resid | 0.104890 | Schwarz criterion | -3.172512 | |
| Log likelihood | 83.22482 | Hannan-Quinn criter. | -3.219868 | |
| F-statistic | 27.57455 | Durbin-Watson stat | 1.866774 | |
| Prob(F-statistic) | 0.000003 | |||
UNIT ROOT RESULT FOR GREEN ENERGY (ADF – FIRST DIFFERENCE)
| Null Hypothesis: D(LOGGENERGY) has a unit root | ||||
| Exogenous: Constant | ||||
| Lag Length: 4 (Automatic – based on SIC, maxlag=10) | ||||
| t-Statistic | Prob.* | |||
| Augmented Dickey-Fuller test statistic | -5.093849 | 0.0001 | ||
| Test critical values: | 1% level | -3.584743 | ||
| 5% level | -2.928142 | |||
| 10% level | -2.602225 | |||
| *MacKinnon (1996) one-sided p-values. | ||||
| Augmented Dickey-Fuller Test Equation | ||||
| Dependent Variable: D(LOGGENERGY,2) | ||||
| Method: Least Squares | ||||
| Date: 05/25/24 Time: 10:26 | ||||
| Sample (adjusted): 1977 2021 | ||||
| Included observations: 45 after adjustments | ||||
| Variable | Coefficient | Std. Error | t-Statistic | Prob. |
| D(LOGGENERGY(-1)) | -2.733703 | 0.536667 | -5.093849 | 0.0000 |
| D(LOGGENERGY(-1),2) | 1.261201 | 0.463729 | 2.719693 | 0.0097 |
| D(LOGGENERGY(-2),2) | 0.773320 | 0.364260 | 2.122988 | 0.0402 |
| D(LOGGENERGY(-3),2) | 0.528262 | 0.245774 | 2.149386 | 0.0379 |
| D(LOGGENERGY(-4),2) | 0.293780 | 0.133384 | 2.202510 | 0.0336 |
| C | -0.001626 | 0.007007 | -0.232093 | 0.8177 |
| R-squared | 0.745512 | Mean dependent var | -0.001922 | |
| Adjusted R-squared | 0.712885 | S.D. dependent var | 0.087223 | |
| S.E. of regression | 0.046737 | Akaike info criterion | -3.164996 | |
| Sum squared resid | 0.085189 | Schwarz criterion | -2.924108 | |
| Log likelihood | 77.21241 | Hannan-Quinn criter. | -3.075195 | |
| F-statistic | 22.84979 | Durbin-Watson stat | 2.161314 | |
| Prob(F-statistic) | 0.000000 | |||
UNIT ROOT RESULT FOR GREEN ENERGY (PP – LEVELS)
| Null Hypothesis: LOGGENERGY has a unit root | ||||
| Exogenous: Constant | ||||
| Bandwidth: 1 (Newey-West automatic) using Bartlett kernel | ||||
| Adj. t-Stat | Prob.* | |||
| Phillips-Perron test statistic | -5.281446 | 0.0001 | ||
| Test critical values: | 1% level | -3.568308 | ||
| 5% level | -2.921175 | |||
| 10% level | -2.598551 | |||
| *MacKinnon (1996) one-sided p-values. | ||||
| Residual variance (no correction) | 0.002098 | |||
| HAC corrected variance (Bartlett kernel) | 0.002181 | |||
| Phillips-Perron Test Equation | ||||
| Dependent Variable: D(LOGGENERGY) | ||||
| Method: Least Squares | ||||
| Date: 05/24/24 Time: 17:34 | ||||
| Sample (adjusted): 1972 2021 | ||||
| Included observations: 50 after adjustments | ||||
| Variable | Coefficient | Std. Error | t-Statistic | Prob. |
| LOGGENERGY(-1) | -0.724732 | 0.138014 | -5.251147 | 0.0000 |
| C | 3.220173 | 0.613169 | 5.251686 | 0.0000 |
| R-squared | 0.364866 | Mean dependent var | 0.000518 | |
| Adjusted R-squared | 0.351634 | S.D. dependent var | 0.058054 | |
| S.E. of regression | 0.046746 | Akaike info criterion | -3.248993 | |
| Sum squared resid | 0.104890 | Schwarz criterion | -3.172512 | |
| Log likelihood | 83.22482 | Hannan-Quinn criter. | -3.219868 | |
| F-statistic | 27.57455 | Durbin-Watson stat | 1.866774 | |
| Prob(F-statistic) | 0.000003 | |||
UNIT ROOT RESULT FOR GREEN ENERGY (PP – FIRST DIFFERENCE)
| Null Hypothesis: D(LOGGENERGY) has a unit root | ||||
| Exogenous: Constant | ||||
| Bandwidth: 9 (Newey-West automatic) using Bartlett kernel | ||||
| Adj. t-Stat | Prob.* | |||
| Phillips-Perron test statistic | -14.71042 | 0.0000 | ||
| Test critical values: | 1% level | -3.571310 | ||
| 5% level | -2.922449 | |||
| 10% level | -2.599224 | |||
| *MacKinnon (1996) one-sided p-values. | ||||
| Residual variance (no correction) | 0.002832 | |||
| HAC corrected variance (Bartlett kernel) | 0.000718 | |||
| Phillips-Perron Test Equation | ||||
| Dependent Variable: D(LOGGENERGY,2) | ||||
| Method: Least Squares | ||||
| Date: 05/25/24 Time: 10:28 | ||||
| Sample (adjusted): 1973 2021 | ||||
| Included observations: 49 after adjustments | ||||
| Variable | Coefficient | Std. Error | t-Statistic | Prob. |
| D(LOGGENERGY(-1)) | -1.312643 | 0.133872 | -9.805237 | 0.0000 |
| C | -0.001500 | 0.007762 | -0.193231 | 0.8476 |
| R-squared | 0.671656 | Mean dependent var | -0.001635 | |
| Adjusted R-squared | 0.664670 | S.D. dependent var | 0.093828 | |
| S.E. of regression | 0.054334 | Akaike info criterion | -2.947389 | |
| Sum squared resid | 0.138750 | Schwarz criterion | -2.870172 | |
| Log likelihood | 74.21103 | Hannan-Quinn criter. | -2.918093 | |
| F-statistic | 96.14268 | Durbin-Watson stat | 2.245609 | |
| Prob(F-statistic) | 0.000000 | |||
UNIT ROOT RESULT FOR EDUCATION (ADF)
| Null Hypothesis: D(LOGEDU) has a unit root | ||||
| Exogenous: Constant | ||||
| Lag Length: 0 (Automatic – based on SIC, maxlag=10) | ||||
| t-Statistic | Prob.* | |||
| Augmented Dickey-Fuller test statistic | -6.601436 | 0.0000 | ||
| Test critical values: | 1% level | -3.571310 | ||
| 5% level | -2.922449 | |||
| 10% level | -2.599224 | |||
| *MacKinnon (1996) one-sided p-values. | ||||
| Augmented Dickey-Fuller Test Equation | ||||
| Dependent Variable: D(LOGEDU,2) | ||||
| Method: Least Squares | ||||
| Date: 05/24/24 Time: 17:30 | ||||
| Sample (adjusted): 1973 2021 | ||||
| Included observations: 49 after adjustments | ||||
| Variable | Coefficient | Std. Error | t-Statistic | Prob. |
| D(LOGEDU(-1)) | -0.881369 | 0.133512 | -6.601436 | 0.0000 |
| C | 0.038072 | 0.051455 | 0.739909 | 0.4630 |
| R-squared | 0.481116 | Mean dependent var | -0.021676 | |
| Adjusted R-squared | 0.470076 | S.D. dependent var | 0.487074 | |
| S.E. of regression | 0.354570 | Akaike info criterion | 0.804137 | |
| Sum squared resid | 5.908828 | Schwarz criterion | 0.881354 | |
| Log likelihood | -17.70135 | Hannan-Quinn criter. | 0.833433 | |
| F-statistic | 43.57895 | Durbin-Watson stat | 2.071490 | |
| Prob(F-statistic) | 0.000000 | |||
UNIT ROOT RESULT FOR EDUCATION (PP)
| Null Hypothesis: D(LOGEDU) has a unit root | ||||
| Exogenous: Constant | ||||
| Bandwidth: 2 (Newey-West automatic) using Bartlett kernel | ||||
| Adj. t-Stat | Prob.* | |||
| Phillips-Perron test statistic | -6.599222 | 0.0000 | ||
| Test critical values: | 1% level | -3.571310 | ||
| 5% level | -2.922449 | |||
| 10% level | -2.599224 | |||
| *MacKinnon (1996) one-sided p-values. | ||||
| Residual variance (no correction) | 0.120588 | |||
| HAC corrected variance (Bartlett kernel) | 0.131529 | |||
| Phillips-Perron Test Equation | ||||
| Dependent Variable: D(LOGEDU,2) | ||||
| Method: Least Squares | ||||
| Date: 05/24/24 Time: 17:32 | ||||
| Sample (adjusted): 1973 2021 | ||||
| Included observations: 49 after adjustments | ||||
| Variable | Coefficient | Std. Error | t-Statistic | Prob. |
| D(LOGEDU(-1)) | -0.881369 | 0.133512 | -6.601436 | 0.0000 |
| C | 0.038072 | 0.051455 | 0.739909 | 0.4630 |
| R-squared | 0.481116 | Mean dependent var | -0.021676 | |
| Adjusted R-squared | 0.470076 | S.D. dependent var | 0.487074 | |
| S.E. of regression | 0.354570 | Akaike info criterion | 0.804137 | |
| Sum squared resid | 5.908828 | Schwarz criterion | 0.881354 | |
| Log likelihood | -17.70135 | Hannan-Quinn criter. | 0.833433 | |
| F-statistic | 43.57895 | Durbin-Watson stat | 2.071490 | |
| Prob(F-statistic) | 0.000000 | |||
NARDL RESULT
| Dependent Variable: LOGDEV | ||||
| Method: ARDL | ||||
| Date: 05/24/24 Time: 16:45 | ||||
| Sample (adjusted): 1976 2021 | ||||
| Included observations: 46 after adjustments | ||||
| Maximum dependent lags: 4 (Automatic selection) | ||||
| Model selection method: Akaike info criterion (AIC) | ||||
| Dynamic regressors (4 lags, automatic): LOGEFP_POS LOGEFP_NEG | ||||
| LOGCLIMCH_POS LOGCLIMCH_NEG LOGGENERGY_POS | ||||
| LOGGENERGY_NEG LOGEDU_POS LOGEDU_NEG | ||||
| Fixed regressors: C | ||||
| Number of models evalulated: 1562500 | ||||
| Selected Model: ARDL(4, 4, 4, 4, 4, 4, 4, 4, 4) | ||||
| Variable | Coefficient | Std. Error | t-Statistic | Prob.* |
| LOGDEV(-1) | -0.105853 | 0.101238 | -1.045579 | 0.4858 |
| LOGDEV(-2) | 0.596992 | 0.094286 | 6.331733 | 0.0997 |
| LOGDEV(-3) | 0.492183 | 0.066707 | 7.378320 | 0.0858 |
| LOGDEV(-4) | -0.543395 | 0.052170 | -10.41581 | 0.0609 |
| LOGEFP_POS | -1.233233 | 0.233746 | -5.275948 | 0.1192 |
| LOGEFP_POS(-1) | -1.598570 | 0.184966 | -8.642494 | 0.0733 |
| LOGEFP_POS(-2) | -2.854881 | 0.273202 | -10.44971 | 0.0607 |
| LOGEFP_POS(-3) | 1.101414 | 0.221823 | 4.965283 | 0.1265 |
| LOGEFP_POS(-4) | 6.206134 | 0.576112 | 10.77244 | 0.0589 |
| LOGEFP_NEG | -0.417774 | 0.350355 | -1.192431 | 0.4443 |
| LOGEFP_NEG(-1) | -8.935955 | 0.437283 | -20.43519 | 0.0311 |
| LOGEFP_NEG(-2) | -5.311946 | 0.560699 | -9.473789 | 0.0670 |
| LOGEFP_NEG(-3) | 1.735497 | 0.315557 | 5.499782 | 0.1145 |
| LOGEFP_NEG(-4) | 1.779968 | 0.439510 | 4.049888 | 0.1541 |
| LOGCLIMCH_POS | 1.033537 | 0.070021 | 14.76030 | 0.0431 |
| LOGCLIMCH_POS(-1) | 0.807525 | 0.065169 | 12.39118 | 0.0513 |
| LOGCLIMCH_POS(-2) | -0.431019 | 0.037804 | -11.40150 | 0.0557 |
| LOGCLIMCH_POS(-3) | -0.418411 | 0.036828 | -11.36108 | 0.0559 |
| LOGCLIMCH_POS(-4) | -0.674619 | 0.065413 | -10.31326 | 0.0615 |
| LOGCLIMCH_NEG | -0.728503 | 0.073107 | -9.964914 | 0.0637 |
| LOGCLIMCH_NEG(-1) | 1.334054 | 0.104368 | 12.78222 | 0.0497 |
| LOGCLIMCH_NEG(-2) | 1.953974 | 0.136634 | 14.30076 | 0.0444 |
| LOGCLIMCH_NEG(-3) | 0.806971 | 0.091335 | 8.835329 | 0.0717 |
| LOGCLIMCH_NEG(-4) | 0.532327 | 0.060529 | 8.794612 | 0.0721 |
| LOGGENERGY_POS | -7.456751 | 0.571464 | -13.04851 | 0.0487 |
| LOGGENERGY_POS(-1) | -10.35587 | 0.792025 | -13.07519 | 0.0486 |
| LOGGENERGY_POS(-2) | -6.760507 | 0.592598 | -11.40825 | 0.0557 |
| LOGGENERGY_POS(-3) | 3.225826 | 0.367565 | 8.776208 | 0.0722 |
| LOGGENERGY_POS(-4) | 6.434982 | 0.507106 | 12.68961 | 0.0501 |
| LOGGENERGY_NEG | 7.595722 | 0.503527 | 15.08502 | 0.0421 |
| LOGGENERGY_NEG(-1) | 2.782055 | 0.577414 | 4.818127 | 0.1303 |
| LOGGENERGY_NEG(-2) | -5.872778 | 0.576906 | -10.17978 | 0.0623 |
| LOGGENERGY_NEG(-3) | -8.650390 | 0.646023 | -13.39023 | 0.0475 |
| LOGGENERGY_NEG(-4) | -4.888048 | 0.381176 | -12.82361 | 0.0495 |
| LOGEDU_POS | 0.262084 | 0.040774 | 6.427781 | 0.0983 |
| LOGEDU_POS(-1) | 0.332234 | 0.032839 | 10.11709 | 0.0627 |
| LOGEDU_POS(-2) | 0.647759 | 0.058042 | 11.16027 | 0.0569 |
| LOGEDU_POS(-3) | 0.177103 | 0.041569 | 4.260472 | 0.1468 |
| LOGEDU_POS(-4) | -0.479785 | 0.036991 | -12.97049 | 0.0490 |
| LOGEDU_NEG | 1.320259 | 0.063118 | 20.91736 | 0.0304 |
| LOGEDU_NEG(-1) | 0.945780 | 0.100287 | 9.430764 | 0.0673 |
| LOGEDU_NEG(-2) | -0.796965 | 0.085352 | -9.337397 | 0.0679 |
| LOGEDU_NEG(-3) | -1.102538 | 0.092232 | -11.95396 | 0.0531 |
| LOGEDU_NEG(-4) | 0.331553 | 0.044958 | 7.374729 | 0.0858 |
| C | 5.822867 | 0.441219 | 13.19722 | 0.0481 |
| R-squared | 0.999998 | Mean dependent var | 6.858625 | |
| Adjusted R-squared | 0.999898 | S.D. dependent var | 0.689348 | |
| S.E. of regression | 0.006955 | Akaike info criterion | -8.970850 | |
| Sum squared resid | 4.84E-05 | Schwarz criterion | -7.181961 | |
| Log likelihood | 251.3295 | Hannan-Quinn criter. | -8.300721 | |
| F-statistic | 10047.31 | Durbin-Watson stat | 3.130818 | |
| Prob(F-statistic) | 0.007915 | |||
| *Note: p-values and any subsequent tests do not account for model | ||||
| selection. | ||||
NARDL BOUNDS TEST RESULT
| ARDL Long Run Form and Bounds Test | ||||
| Dependent Variable: D(LOGDEV) | ||||
| Selected Model: ARDL(4, 4, 4, 4, 4, 4, 4, 4, 4) | ||||
| Case 2: Restricted Constant and No Trend | ||||
| Date: 05/24/24 Time: 16:52 | ||||
| Sample: 1971 2021 | ||||
| Included observations: 46 | ||||
| Conditional Error Correction Regression | ||||
| Variable | Coefficient | Std. Error | t-Statistic | Prob. |
| C | 5.822867 | 0.441219 | 13.19722 | 0.0481 |
| LOGDEV(-1)* | -0.560073 | 0.086603 | -6.467149 | 0.0977 |
| LOGEFP_POS(-1) | 1.620864 | 0.237382 | 6.828076 | 0.0926 |
| LOGEFP_NEG(-1) | -11.15021 | 0.849443 | -13.12650 | 0.0484 |
| LOGCLIMCH_POS(-1) | 0.317014 | 0.038722 | 8.186849 | 0.0774 |
| LOGCLIMCH_NEG(-1) | 3.898823 | 0.275836 | 14.13457 | 0.0450 |
| LOGGENERGY_POS(-1) | -14.91232 | 1.153778 | -12.92478 | 0.0492 |
| LOGGENERGY_NEG(-1) | -9.033440 | 0.680909 | -13.26673 | 0.0479 |
| LOGEDU_POS(-1) | 0.939396 | 0.101352 | 9.268610 | 0.0684 |
| LOGEDU_NEG(-1) | 0.698089 | 0.073280 | 9.526279 | 0.0666 |
| D(LOGDEV(-1)) | -0.545780 | 0.104097 | -5.243008 | 0.1200 |
| D(LOGDEV(-2)) | 0.051212 | 0.057051 | 0.897649 | 0.5343 |
| D(LOGDEV(-3)) | 0.543395 | 0.052170 | 10.41581 | 0.0609 |
| D(LOGEFP_POS) | -1.233233 | 0.233746 | -5.275948 | 0.1192 |
| D(LOGEFP_POS(-1)) | -4.452667 | 0.430681 | -10.33866 | 0.0614 |
| D(LOGEFP_POS(-2)) | -7.307548 | 0.535000 | -13.65896 | 0.0465 |
| D(LOGEFP_POS(-3)) | -6.206134 | 0.576112 | -10.77244 | 0.0589 |
| D(LOGEFP_NEG) | -0.417774 | 0.350355 | -1.192431 | 0.4443 |
| D(LOGEFP_NEG(-1)) | 1.796481 | 0.758790 | 2.367561 | 0.2544 |
| D(LOGEFP_NEG(-2)) | -3.515464 | 0.574490 | -6.119277 | 0.1031 |
| D(LOGEFP_NEG(-3)) | -1.779968 | 0.439510 | -4.049888 | 0.1541 |
| D(LOGCLIMCH_POS) | 1.033537 | 0.070021 | 14.76030 | 0.0431 |
| D(LOGCLIMCH_POS(-1)) | 1.524048 | 0.106304 | 14.33673 | 0.0443 |
| D(LOGCLIMCH_POS(-2)) | 1.093029 | 0.091830 | 11.90275 | 0.0534 |
| D(LOGCLIMCH_POS(-3)) | 0.674619 | 0.065413 | 10.31326 | 0.0615 |
| D(LOGCLIMCH_NEG) | -0.728503 | 0.073107 | -9.964914 | 0.0637 |
| D(LOGCLIMCH_NEG(-1)) | -3.293272 | 0.248753 | -13.23914 | 0.0480 |
| D(LOGCLIMCH_NEG(-2)) | -1.339298 | 0.123300 | -10.86210 | 0.0584 |
| D(LOGCLIMCH_NEG(-3)) | -0.532327 | 0.060529 | -8.794612 | 0.0721 |
| D(LOGGENERGY_POS) | -7.456751 | 0.571464 | -13.04851 | 0.0487 |
| D(LOGGENERGY_POS(-1)) | -2.900301 | 0.346180 | -8.378011 | 0.0756 |
| D(LOGGENERGY_POS(-2)) | -9.660807 | 0.700867 | -13.78409 | 0.0461 |
| D(LOGGENERGY_POS(-3)) | -6.434982 | 0.507106 | -12.68961 | 0.0501 |
| D(LOGGENERGY_NEG) | 7.595722 | 0.503527 | 15.08502 | 0.0421 |
| D(LOGGENERGY_NEG(-1)) | 19.41122 | 1.455510 | 13.33637 | 0.0476 |
| D(LOGGENERGY_NEG(-2)) | 13.53844 | 0.983596 | 13.76423 | 0.0462 |
| D(LOGGENERGY_NEG(-3)) | 4.888048 | 0.381176 | 12.82361 | 0.0495 |
| D(LOGEDU_POS) | 0.262084 | 0.040774 | 6.427781 | 0.0983 |
| D(LOGEDU_POS(-1)) | -0.345077 | 0.080436 | -4.290086 | 0.1458 |
| D(LOGEDU_POS(-2)) | 0.302682 | 0.043528 | 6.953702 | 0.0909 |
| D(LOGEDU_POS(-3)) | 0.479785 | 0.036991 | 12.97049 | 0.0490 |
| D(LOGEDU_NEG) | 1.320259 | 0.063118 | 20.91737 | 0.0304 |
| D(LOGEDU_NEG(-1)) | 1.567950 | 0.173241 | 9.050701 | 0.0701 |
| D(LOGEDU_NEG(-2)) | 0.770985 | 0.112938 | 6.826625 | 0.0926 |
| D(LOGEDU_NEG(-3)) | -0.331553 | 0.044958 | -7.374729 | 0.0858 |
| * p-value incompatible with t-Bounds distribution. | ||||
| Levels Equation | ||||
| Case 2: Restricted Constant and No Trend | ||||
| Variable | Coefficient | Std. Error | t-Statistic | Prob. |
| LOGEFP_POS | 2.894025 | 0.224304 | 12.90225 | 0.0492 |
| LOGEFP_NEG | -19.90851 | 2.708544 | -7.350261 | 0.0861 |
| LOGCLIMCH_POS | 0.566024 | 0.123114 | 4.597565 | 0.1363 |
| LOGCLIMCH_NEG | 6.961280 | 1.131313 | 6.153276 | 0.1026 |
| LOGGENERGY_POS | -26.62569 | 4.496385 | -5.921578 | 0.1065 |
| LOGGENERGY_NEG | -16.12905 | 2.307894 | -6.988646 | 0.0905 |
| LOGEDU_POS | 1.677275 | 0.310257 | 5.406087 | 0.1164 |
| LOGEDU_NEG | 1.246426 | 0.083065 | 15.00540 | 0.0424 |
| C | 10.39663 | 0.993941 | 10.46001 | 0.0607 |
| EC = LOGDEV – (2.8940*LOGEFP_POS -19.9085*LOGEFP_NEG + 0.5660 | ||||
| *LOGCLIMCH_POS + 6.9613*LOGCLIMCH_NEG -26.6257 | ||||
| *LOGGENERGY_POS -16.1291*LOGGENERGY_NEG + 1.6773 | ||||
| *LOGEDU_POS + 1.2464*LOGEDU_NEG + 10.3966 ) | ||||
| F-Bounds Test | Null Hypothesis: No levels relationship | |||
| Test Statistic | Value | Signif. | I(0) | I(1) |
| Asymptotic: n=1000 | ||||
| F-statistic | 65.95321 | 10% | 1.85 | 2.85 |
| K | 8 | 5% | 2.11 | 3.15 |
| 2.5% | 2.33 | 3.42 | ||
| 1% | 2.62 | 3.77 | ||
| Actual Sample Size | 46 | Finite Sample: n=50 | ||
| 10% | -1 | -1 | ||
| 5% | -1 | -1 | ||
| 1% | -1 | -1 | ||
| Finite Sample: n=45 | ||||
| 10% | -1 | -1 | ||
| 5% | -1 | -1 | ||
| 1% | -1 | -1 | ||
NARDL ERROR CORRECTION RESULT
| ARDL Error Correction Regression | ||||
| Dependent Variable: D(LOGDEV) | ||||
| Selected Model: ARDL(4, 4, 4, 4, 4, 4, 4, 4, 4) | ||||
| Case 2: Restricted Constant and No Trend | ||||
| Date: 05/24/24 Time: 16:55 | ||||
| Sample: 1971 2021 | ||||
| Included observations: 46 | ||||
| ECM Regression | ||||
| Case 2: Restricted Constant and No Trend | ||||
| Variable | Coefficient | Std. Error | t-Statistic | Prob. |
| D(LOGDEV(-1)) | -0.545780 | 0.016585 | -32.90830 | 0.0193 |
| D(LOGDEV(-2)) | 0.051212 | 0.009146 | 5.599514 | 0.1125 |
| D(LOGDEV(-3)) | 0.543395 | 0.007799 | 69.67846 | 0.0091 |
| D(LOGEFP_POS) | -1.233233 | 0.039442 | -31.26667 | 0.0204 |
| D(LOGEFP_POS(-1)) | -4.452667 | 0.059760 | -74.50947 | 0.0085 |
| D(LOGEFP_POS(-2)) | -7.307548 | 0.084014 | -86.98025 | 0.0073 |
| D(LOGEFP_POS(-3)) | -6.206134 | 0.104596 | -59.33432 | 0.0107 |
| D(LOGEFP_NEG) | -0.417774 | 0.034381 | -12.15119 | 0.0523 |
| D(LOGEFP_NEG(-1)) | 1.796481 | 0.066946 | 26.83475 | 0.0237 |
| D(LOGEFP_NEG(-2)) | -3.515464 | 0.070793 | -49.65809 | 0.0128 |
| D(LOGEFP_NEG(-3)) | -1.779968 | 0.043848 | -40.59447 | 0.0157 |
| D(LOGCLIMCH_POS) | 1.033537 | 0.014410 | 71.72176 | 0.0089 |
| D(LOGCLIMCH_POS(-1)) | 1.524048 | 0.020054 | 75.99718 | 0.0084 |
| D(LOGCLIMCH_POS(-2)) | 1.093029 | 0.014989 | 72.92080 | 0.0087 |
| D(LOGCLIMCH_POS(-3)) | 0.674619 | 0.010542 | 63.99557 | 0.0099 |
| D(LOGCLIMCH_NEG) | -0.728503 | 0.012484 | -58.35414 | 0.0109 |
| D(LOGCLIMCH_NEG(-1)) | -3.293272 | 0.045094 | -73.03184 | 0.0087 |
| D(LOGCLIMCH_NEG(-2)) | -1.339298 | 0.019710 | -67.95074 | 0.0094 |
| D(LOGCLIMCH_NEG(-3)) | -0.532327 | 0.007673 | -69.37673 | 0.0092 |
| D(LOGGENERGY_POS) | -7.456751 | 0.090054 | -82.80338 | 0.0077 |
| D(LOGGENERGY_POS(-1)) | -2.900301 | 0.056521 | -51.31355 | 0.0124 |
| D(LOGGENERGY_POS(-2)) | -9.660807 | 0.130216 | -74.19069 | 0.0086 |
| D(LOGGENERGY_POS(-3)) | -6.434982 | 0.104856 | -61.36984 | 0.0104 |
| D(LOGGENERGY_NEG) | 7.595722 | 0.074971 | 101.3160 | 0.0063 |
| D(LOGGENERGY_NEG(-1)) | 19.41122 | 0.270851 | 71.66755 | 0.0089 |
| D(LOGGENERGY_NEG(-2)) | 13.53844 | 0.167710 | 80.72518 | 0.0079 |
| D(LOGGENERGY_NEG(-3)) | 4.888048 | 0.066615 | 73.37809 | 0.0087 |
| D(LOGEDU_POS) | 0.262084 | 0.004318 | 60.70146 | 0.0105 |
| D(LOGEDU_POS(-1)) | -0.345077 | 0.007033 | -49.06814 | 0.0130 |
| D(LOGEDU_POS(-2)) | 0.302682 | 0.004671 | 64.80128 | 0.0098 |
| D(LOGEDU_POS(-3)) | 0.479785 | 0.009338 | 51.38236 | 0.0124 |
| D(LOGEDU_NEG) | 1.320259 | 0.009958 | 132.5879 | 0.0048 |
| D(LOGEDU_NEG(-1)) | 1.567950 | 0.022707 | 69.05038 | 0.0092 |
| D(LOGEDU_NEG(-2)) | 0.770985 | 0.012496 | 61.69767 | 0.0103 |
| D(LOGEDU_NEG(-3)) | -0.331553 | 0.008044 | -41.21519 | 0.0154 |
| CointEq(-1)* | -0.560073 | 0.006896 | -81.21158 | 0.0078 |
| R-squared | 0.999951 | Mean dependent var | 0.036254 | |
| Adjusted R-squared | 0.999779 | S.D. dependent var | 0.147913 | |
| S.E. of regression | 0.002199 | Akaike info criterion | -9.362154 | |
| Sum squared resid | 4.84E-05 | Schwarz criterion | -7.931043 | |
| Log likelihood | 251.3295 | Hannan-Quinn criter. | -8.826051 | |
| Durbin-Watson stat | 3.130818 | |||
| * p-value incompatible with t-Bounds distribution. | ||||
| F-Bounds Test | Null Hypothesis: No levels relationship | |||
| Test Statistic | Value | Signif. | I(0) | I(1) |
| F-statistic | 65.95321 | 10% | 1.85 | 2.85 |
| K | 8 | 5% | 2.11 | 3.15 |
| 2.5% | 2.33 | 3.42 | ||
| 1% | 2.62 | 3.77 | ||
NARDL HETEROSKEDASTICITY TEST
| Heteroskedasticity Test: Breusch-Pagan-Godfrey | ||||
| F-statistic | 0.342663 | Prob. F(44,1) | 0.9054 | |
| Obs*R-squared | 43.13880 | Prob. Chi-Square(44) | 0.5084 | |
| Scaled explained SS | 0.063766 | Prob. Chi-Square(44) | 1.0000 | |
| Test Equation: | ||||
| Dependent Variable: RESID^2 | ||||
| Method: Least Squares | ||||
| Date: 05/24/24 Time: 17:08 | ||||
| Sample: 1976 2021 | ||||
| Included observations: 46 | ||||
| Variable | Coefficient | Std. Error | t-Statistic | Prob. |
| C | 1.75E-05 | 0.000282 | 0.062015 | 0.9606 |
| LOGDEV(-1) | -5.08E-05 | 6.48E-05 | -0.785194 | 0.5762 |
| LOGDEV(-2) | 5.57E-05 | 6.03E-05 | 0.924005 | 0.5251 |
| LOGDEV(-3) | -1.22E-05 | 4.27E-05 | -0.285132 | 0.8232 |
| LOGDEV(-4) | 2.55E-05 | 3.34E-05 | 0.765626 | 0.5840 |
| LOGEFP_POS | -8.35E-05 | 0.000150 | -0.558187 | 0.6759 |
| LOGEFP_POS(-1) | -9.82E-06 | 0.000118 | -0.083038 | 0.9473 |
| LOGEFP_POS(-2) | -0.000207 | 0.000175 | -1.183546 | 0.4466 |
| LOGEFP_POS(-3) | -7.72E-05 | 0.000142 | -0.544173 | 0.6827 |
| LOGEFP_POS(-4) | 0.000316 | 0.000369 | 0.856880 | 0.5490 |
| LOGEFP_NEG | 3.34E-06 | 0.000224 | 0.014882 | 0.9905 |
| LOGEFP_NEG(-1) | -0.000113 | 0.000280 | -0.403755 | 0.7557 |
| LOGEFP_NEG(-2) | -0.000310 | 0.000359 | -0.863162 | 0.5467 |
| LOGEFP_NEG(-3) | 0.000138 | 0.000202 | 0.683661 | 0.6182 |
| LOGEFP_NEG(-4) | -0.000167 | 0.000281 | -0.595243 | 0.6582 |
| LOGCLIMCH_POS | 2.20E-05 | 4.48E-05 | 0.490948 | 0.7095 |
| LOGCLIMCH_POS(-1) | 1.38E-05 | 4.17E-05 | 0.329899 | 0.7971 |
| LOGCLIMCH_POS(-2) | -4.50E-06 | 2.42E-05 | -0.185892 | 0.8830 |
| LOGCLIMCH_POS(-3) | -1.84E-05 | 2.36E-05 | -0.779968 | 0.5783 |
| LOGCLIMCH_POS(-4) | -2.86E-05 | 4.18E-05 | -0.683983 | 0.6181 |
| LOGCLIMCH_NEG | -1.56E-05 | 4.68E-05 | -0.334210 | 0.7947 |
| LOGCLIMCH_NEG(-1) | 6.04E-05 | 6.68E-05 | 0.904259 | 0.5320 |
| LOGCLIMCH_NEG(-2) | 9.32E-05 | 8.74E-05 | 1.066907 | 0.4794 |
| LOGCLIMCH_NEG(-3) | 5.91E-05 | 5.84E-05 | 1.011453 | 0.4964 |
| LOGCLIMCH_NEG(-4) | 9.30E-06 | 3.87E-05 | 0.240195 | 0.8499 |
| LOGGENERGY_POS | -0.000330 | 0.000366 | -0.901417 | 0.5330 |
| LOGGENERGY_POS(-1) | -0.000501 | 0.000507 | -0.989434 | 0.5034 |
| LOGGENERGY_POS(-2) | -0.000385 | 0.000379 | -1.014776 | 0.4953 |
| LOGGENERGY_POS(-3) | 0.000167 | 0.000235 | 0.710217 | 0.6069 |
| LOGGENERGY_POS(-4) | 0.000231 | 0.000324 | 0.712979 | 0.6057 |
| LOGGENERGY_NEG | 0.000348 | 0.000322 | 1.080456 | 0.4754 |
| LOGGENERGY_NEG(-1) | 0.000397 | 0.000369 | 1.074367 | 0.4772 |
| LOGGENERGY_NEG(-2) | -0.000382 | 0.000369 | -1.034458 | 0.4892 |
| LOGGENERGY_NEG(-3) | -0.000281 | 0.000413 | -0.679293 | 0.6201 |
| LOGGENERGY_NEG(-4) | -0.000170 | 0.000244 | -0.698392 | 0.6119 |
| LOGEDU_POS | 1.33E-05 | 2.61E-05 | 0.511808 | 0.6988 |
| LOGEDU_POS(-1) | 1.30E-05 | 2.10E-05 | 0.617218 | 0.6480 |
| LOGEDU_POS(-2) | 4.45E-05 | 3.71E-05 | 1.198897 | 0.4426 |
| LOGEDU_POS(-3) | 2.80E-05 | 2.66E-05 | 1.052294 | 0.4838 |
| LOGEDU_POS(-4) | 2.81E-06 | 2.37E-05 | 0.118719 | 0.9248 |
| LOGEDU_NEG | 2.64E-05 | 4.04E-05 | 0.655084 | 0.6308 |
| LOGEDU_NEG(-1) | 6.09E-05 | 6.41E-05 | 0.949027 | 0.5166 |
| LOGEDU_NEG(-2) | -5.95E-05 | 5.46E-05 | -1.089699 | 0.4727 |
| LOGEDU_NEG(-3) | -3.50E-05 | 5.90E-05 | -0.592570 | 0.6594 |
| LOGEDU_NEG(-4) | -2.74E-05 | 2.88E-05 | -0.951503 | 0.5158 |
| R-squared | 0.937800 | Mean dependent var | 1.05E-06 | |
| Adjusted R-squared | -1.799002 | S.D. dependent var | 2.66E-06 | |
| S.E. of regression | 4.45E-06 | Akaike info criterion | -23.68002 | |
| Sum squared resid | 1.98E-11 | Schwarz criterion | -21.89113 | |
| Log likelihood | 589.6404 | Hannan-Quinn criter. | -23.00989 | |
| F-statistic | 0.342663 | Durbin-Watson stat | 3.130818 | |
| Prob(F-statistic) | 0.905374 | |||
NARDL CUSUM TEST RESULT
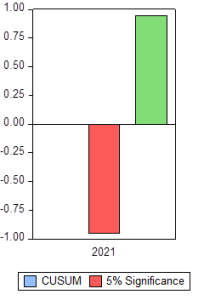
NARDL CUSUM SQUARE TEST RESULT
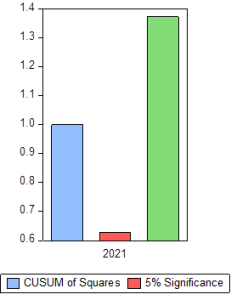
NARDL NORMALITY TEST RESULT