
Democracy and Inclusive Growth in Sub-Saharan Africa
- Desiree Sama-Lang
- 824-834
- May 20, 2024
- Economic Development
Democracy and Inclusive Growth in Sub-Saharan Africa
Desiree Sama-Lang
Pan-African University of Governance, Humanities and Social Sciences – Yaoundé, Cameroon.
DOI: https://doi.org/10.51244/IJRSI.2024.1104061
Received: 23 April 2024; Accepted: 06 May 2024; Published: 20 May 2024
ABSTRACT
This research explores the link between democracy and inclusive growth in Sub-Saharan Africa (SSA). A fixed-effects model is used to analyse how the Freedom in the World Index (FIW) score, along with other economic, institutional, and demographic factors, affects a composite index of inclusive growth. The findings challenge the simplistic notion that democratic improvements directly lead to more inclusive growth. Overall, the FIW score exhibits a negative association with inclusive growth across SSA. However, further analysis reveals a potential threshold effect. For countries with highly developed democratic institutions (high FIW score), the FIW score is not statistically significant. Conversely, for countries with less developed democracies (low FIW score), the FIW score has a negative and significant coefficient. This latter finding might be due to reverse causality, where economic decline prompts calls for democratic reforms. For future research, it may be necessary to look deeper into the threshold effect and explore alternative measures of democracy relevant to the SSA context. Additionally, analysing the influence of specific democratic features on various dimensions of inclusive growth (economic, social, and sustainability) could be fruitful. Finally, policymakers should consider the specific level of democratic development in each SSA country when formulating policies aimed at fostering inclusive growth. This study contributes to a nuanced understanding of how democratic institutions can be leveraged to achieve equitable and sustainable development in SSA.
Keywords: Inclusive Growth, Democracy, Sub-Saharan Africa
INTRODUCTION
The global quest for prosperity depends not just on economic growth, but on how inclusive this growth can be. Though economic expansion is imperative for any society, the equitable distribution of its benefits fosters long-term stability, sustainability, and societal well-being. For this reason, many more countries have been striving to attain more than just economic growth (Sugden, 2012; Jalles & Mello, 2019; Stawska & Jablonska, 2022). The Sub-Saharan Africa region has experienced a surge in economic growth in recent years (Christiansen & Devarajan, 2013; Rodirk, 2014; George, Corbishley, Khayesi, Haas, & Tihanyi, 2016). However, the onset of the coronavirus pandemic negatively impacted several economies in the region as economic activities contracted by approximately 3.2 percent in 2020 (World Bank, 2020). Despite this, the region has experienced some post-pandemic recovery albeit slow due to several factors including the emergence of new COVID-19 variants, price increases from global inflation, supply chain disruptions in the aftermath of the pandemic, and the war in Ukraine that have created new economic shocks.
Whether SSA’s growth is inclusive has been a subject for research. Adeosun, Olomala, Tabash, and Anagreh (2022) conclude that SSA’s growth has not been inclusive. In contrast, (Thorbecke, 2014; Suttie & Benfica, 2016; Messono & Homere III, 2020) opine that SSA countries have had inclusive growth and propose certain factors as determinants of inclusive growth. However, none of these countries focused on whether the presence or absence of democracy will promote or hinder inclusive growth.
In theory, democracy offers a fertile ground for inclusive growth and shared prosperity. Mechanisms like citizen participation, accountability, and checks and balances can lead to policies that promote equal opportunities and reduce inequalities. However, there is a possibility that the reality may be more nuanced, particularly in Sub-Saharan Africa. Basedau (2023) reveals that democracy indices for SSA show a strong increase in democratic practices since 1990 notwithstanding the recent regressive trends that have not offset the past gains. This suggests that the overall trajectory of democratic development in SSA remains positive despite ongoing challenges. With this positive trajectory, it is crucial to assess whether the democratic practices of SSA countries have led to economic growth being inclusive.
Thus, this research probes into the relationship between democracy and inclusive growth in the SSA region. By conducting this research, a deeper understanding of how democratic governance can be leveraged to achieve a more equitable distribution of economic resources in SSA can be obtained. It seeks to provide insights that can inform policy decisions and strategies aimed at fostering inclusive growth.
CONCEPTUALIZING INCLUSIVE GROWTH
The inclusive growth concept has garnered significance since the drive for sustainability began in the late 20th century. More researchers and policy advisors have been proposing broad-based economic opportunities and development. There has also been increased advocacy that the dividends from growth be shared fairly amongst individuals and social groups. The definition of inclusive growth has evolved from being a one-dimensional concept focused uniquely on poverty to becoming a multidimensional concept. Several researchers have come up with different contextual conceptions of inclusive growth. Ngepah (2017) portrays inclusive growth in Africa as a concept that aims to involve low-income individuals and households more actively in wealth-creation processes through labour-absorbing growth and increased productivity of those employed. Ifzal and Hyun (2007) conceptualize it as an increasing social opportunity function, which depends on the average opportunities available and the distribution of these opportunities amongst people in the population. Perhaps one of the most common definitions of inclusive growth is by the IMF which defines it simply as the pace and pattern of growth (Ianchovichina & Lundstrom, 2012). Inclusive growth may summarily be described as being characterized by shared prosperity, broad-based opportunities, equity and fairness, and sustainability.
For this research, inclusive growth will be considered to be an interconnection of three pillars: an economic pillar, a social inclusion pillar, and a sustainability pillar.
- The economic pillar here represents traditional economic growth that focuses on expanding the size of the pie and not on how the benefits of the pie are distributed. It is based on factors including increased productivity and innovation, job creation and rising wages, and improved access to markets, resources, and opportunities.
- The social inclusion pillar focuses on the distribution of the benefits from economic expansion and ensures that everyone gets a slice of the pie. It focuses on creating a more equitable society where everyone has a fair shot at participating in and benefitting from economic growth. The core objectives of this pillar include reducing poverty and inequality, expanding access to basic needs, empowering marginalized groups, and increasing social mobility.
- The sustainability pillar goes beyond simply maintaining economic growth in the present. It ensures that the pie is not only big enough for everyone today, but it continues to provide for future generations. It aims to ensure that growth is achieved in a manner that safeguards the environment and resources for future generations while promoting long-term societal well-being. Its core tenets are environmental sustainability, resource management, climate change mitigation and adaptation, and long-term perspective.
In summary, viewing inclusive growth based on these three pillars is about baking a pie, sharing it more equally, and ensuring the recipe is sustainable for future generations. The strength of the connections between these pillars is crucial. A strong economic base can fund social programs and environmental initiatives, while social inclusion fosters a stable and productive workforce. Environmental sustainability ensures long-term economic viability and a healthy future for all.
HISTORICAL TRENDS OF DEMOCRACY IN SUB-SAHARAN AFRICA
The trend of democracy in Sub-Saharan Africa has been complex and marked by progress, setbacks, and challenges. This trend can be broken into the following phases: pre-colonial legacy and the colonial disruption, one-party states and military rule, the third wave of democratization, and the current landscape.
1. Pre-Colonial Legacy and the Colonial Disruption:Traditional African societies exhibited an array of political systems. While empires like Mali and Ghana had centralized monarchies, decentralized chiefdoms, and councils existed like the Igbos of Nigeria and the Great Lakes region of East Africa. Although these systems did not replicate modern democracies, they emphasized consultative leadership, accountability, and community participation (Mazrui, 1980). This foundation was however disrupted by colonization. European colonialism imposed a centralized and often authoritarian rule that either dismantled or marginalized the existing structures in the pre-existing states (Mamdani, 1996). Emphasis was placed on resource extraction and administrative control prioritized efficiency over democratic participation. The colonial administration imposed their democratic values on the continent where the indigenes were hardly involved in decision-making and were not even allowed to participate in key political activities (Benson, Zuure, & Achanso, 2021). This colonial legacy continues to shape contemporary challenges with artificial borders exacerbating ethnic tensions while weak institutions hinder democratic consolidation.
2. One-Party States and Military Rule: Following the wave of independence of most SSA countries in the mid-20th century, many SSA countries adopted one-party states or succumbed to military rule (Martin, 1995; Rowley, 2000). Several newly independent states in SSA inherited weak political institutions and deeply entrenched social inequalities from former colonial masters. Furthermore, the colonial powers often drew artificial borders that disregarded ethnic and tribal affiliations thus creating tension and instability. Leaders seeking to forge national unity opted for one-party states and argued that it fostered stability and rapid economic development (Ibhawoh, 2021). These one-party states, often led by charismatic figures, however, became vehicles for authoritarian rule. Such leaders suppressed dissent, rigged elections, and concentrated power in their own hands like in Kenya under Jomo Kenyatta and Zambia under Kenneth Kaunda (Kashimani, 1995).
Frustrated by economic stagnation, corruption, and ethnic marginalization, the military in some countries sought to seize control. Coup d’états became a frequent occurrence often disrupting nascent democratic processes. Military regimes, while promising order and reform, often resorted to similar authoritarian tactics as one-party states, further hindering democratic development (Ali & Analoui, 2023)
This period also coincided with the Cold War period that further solidified these trends as the superpowers, the United States of America and the former Soviet Union backed regimes that aligned with their ideologies.
3. The Third Wave of Democratization: This wave was during the late 20th century when there was a general global resurgence of democracy referred to as the “third wave”. This period saw the dismantling of the one-party system and military regimes and was replaced by multi-party politics and attempts to establish democratic institutions (Van de Walle, 2001).
Several factors contributed to the third wave of democratization. Internal pressures such as growing civil society activism and demands for political participation played a key role (Diamond, 1997). The end of the Cold War further weakened the legitimacy of authoritarian regimes as external support often hinged on ideological alignment (Levitsky & Way, 2006). Furthermore, the Bretton Woods institutions and other international aid donors in a bid to encourage democracy attached conditionalities of democratic reforms to aid packages (Zindela & Oguunibi, 2017).
Scholars debate the long-term impact of the third wave of democratization. Some argue that democratic institutions have remained fragile with some tending to backslide to authoritarian rule. Others point to the gradual strengthening of democratic norms and a growing citizenry demanding accountability.
4. The Current Landscape: The third wave undeniably brought positive changes. Competitive elections are more frequent and have fostered a sense of political participation. Constitutional frameworks have been established and independent media outlets play a growing role. However, the legacy remains contested. Electoral manipulation, weak rule of law, and the persistence of ethnic tensions continue to undermine democratic consolidation (Cheeseman & Klaas, 2018). Recent years have witnessed a worrying trend of democratic backsliding in some SSA countries. Leaders manipulate term limits to extend their stay in power while opposition voices are silenced through intimidation and violence (Okurut, 2018). Furthermore, economic inequalities and resource exploitation have fuelled instability and undermined democratic processes (Ferreira, Gisselquist, & Tarp, 2022). There has also been a surge in military coups especially in former French colonies since 2010.
Despite these challenges, there are reasons for cautious optimism. Civil society activism remains vibrant, demanding accountability and pushing for democratic reforms. Additionally, a growing youth population more exposed to democratic ideals could be a force for positive change. Economic growth in some countries could also have fostered a more stable environment conducive to democratic consolidation.
LITERATURE REVIEW
The relationship between democracy and inclusive growth is a multifaceted topic that has been studied extensively, yet it remains complex and nuanced. The research spans various dimensions of how democratic institutions and processes influence economic growth and the distribution of its benefits.
Barro (1996) opines that the overall effect of democracy on economic growth is weakly negative when controlling for variables such as the rule of law and human capital, with a nonlinear relationship suggesting that more democracy can enhance growth at low levels of political freedom but may depress growth at higher levels. Doucouliagos and Ulubasoglu (2008) inferred that democracy does not have a direct impact on economic growth, but has significant positive indirect effects through higher human capital, lower inflation, lower political instability, and higher levels of economic freedom. Tavares and Wacziarg (2001) from their research deduce that democracy can foster growth by improving human capital accumulation and lowering income inequality but may hinder growth by reducing physical capital accumulation and increasing government consumption to GDP ratio. Feng (1997) found that democracy positively influences growth indirectly by affecting the probabilities of regime change and constitutional government change, with different types of political instability having varying effects on growth. Xi (2017) obtained from their findings that inclusive institutions, indicated by political democracy, positively affect consumption share, which in turn is associated with higher rates of total factor productivity (TFP) growth, especially in countries with higher income levels. The analysis of (Colagrossi, Rossignoli, & Maggioni, 2020) revealed that the relationship between democracy and growth is not homogeneous across world regions and decades, with democracy having a positive and direct effect on economic growth. Comeau (2003) inferred that democracies with a tradition of democratic governance and socio-political stability are more conducive to growth, with economic freedom and high-level human capital also being favourable for growth. Ma and Ouyang (2016) deduced that the impact of democracy on growth is asymmetrical and depends on a country’s historical experience with democracy; prolonged democratic experiences can promote growth.
In conclusion, while democracy does not directly cause economic growth, it contributes to growth through various indirect channels such as human capital development, economic freedom, and political stability. The effect of democracy on growth is complex and can vary depending on a country’s level of political freedom, historical experience with democracy, and other socio-political factors. Overall, the presence of democratic institutions is generally not detrimental to economic growth and can be beneficial under certain conditions.
However, the studies observed above, have all been focused on the economic pillar of inclusive growth with little or no attention given to the social inclusion and sustainability pillar. Emphasis has been placed on the pace of growth while neglecting how the benefits of this growth are distributed. Thus, this research aims to cover this gap by deducing how democracy affects inclusive growth with a focus on SSA countries.
METHODOLOGY
The data used for this research of panel nature with annual data collected over ten years from 2012 to 2022. The data was for 45 Sub-Saharan countries except Djibouti, Eritrea, Liberia, Somalia, and South Sudan. The sample was not selected based on probability but was strictly dependent on data availability for the variables used for the analysis. Data was collected from the World Bank’s World Development Indicators and Freedom House’s Freedom in the World.
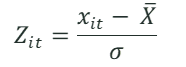
The dependent variable for this research is inclusive growth. A composite index based on the economic, social, and sustainability pillars is created as the metric for inclusive growth. The index is a combination of three measures including GDP per capita growth, Women, Business, and the Law Index, and the percentage of population with access to clean fuels and technologies that represent the economic, social, and sustainability pillars respectively. Since these three indicators are measured in different units, they had to be normalized to a common scale through standardization. Z-score standardization, that is standardization across all units, was used. This method creates standardized scores, with a mean of 0 and a standard deviation of 1 for the entire dataset. This allows the normalized value developed for each of the three indicators to be comparable across all countries and periods on a common scale.
 …….. equation 1
Equation 1 explains the process of standardization. is the standardized Z-score and represents the normalized value for GDP per capita growth, Women, business and the law index, and access to clean fuels and technologies for country i at time t. represents the value of the indicator for country i at time t. represents the overall mean for all countries and all time periods. is the overall standard deviation of the indicator for all countries and all time periods.
After normalizing the data, the composite index is developed by aggregating the standardized scores into a single value. An equal weight of 1 is assigned to each of the standardized indicators. So, a simple average of the three scores is calculated to obtain the composite index of inclusive growth across each country and across all time periods as shown in Equation 2.
 ……equation 2
Democracy, the main independent variable, is measured using the aggregate value of Freedom House’s Freedom in the World Index. This index comprises of subjective ratings including political rights, civil rights, electoral process, political pluralism and participation, functioning of government, political rights, freedom of expression and belief, associational and organizational rights, rule of law, personal autonomy and individual rights, and civil liberties. The control variables are categorized under economic, institutional, and demographic variables. The economic variables include GDP per capita in constant 2015 US Dollars, the GDP deflator (to measure inflation), net inflows of Foreign Direct Investment as a percentage of GDP, and trade as a percentage of GDP. The institutional variables include the control of corruption index (to measure government quality) and general government final consumption expenditure (to measure government size). The demographic variable is the urban population growth rate. The GDP per capita variable is transformed into its logarithmic form to ease interpretation and will thus be interpreted as an elasticity.
Table 1: Hausman Test
| Chi-Squared (8 df) | 40.07 |
| Prob>Chi-Squared | 0.000*** |
Source: Author’s Computations (2024)
(H0 here in simple terms is that the random effects model is efficient. df stands for the degrees of freedom. *** shows that the result is significant at 1%)
Upon conducting the Hausman test, the results shown in Table 1 reveal that the null hypothesis is rejected. Hence the fixed effects model is a better fit for estimation. It has the advantage of controlling for unobserved time-invariant effects, reducing the omitted variables bias, focusing on within-panel variation, and lessening measurement errors in independent variables (Wooldridge, 2016). The fixed effect model is particularly relevant for this study on democracy and inclusive growth in SSA in that it can control for the heterogeneity that exists across different SSA countries such as in terms of historical background, and cultural factors. These factors can influence the variables used in our study but are not included in the data. The fixed effect model handles this unobserved heterogeneity. This model also addresses reverse causality as countries that promote inclusive policies may lead to more democratic institutions and vice versa. The fixed effect model can help mitigate this by focusing on within-country changes.
The data, an unbalanced panel of 432 observations, is analysed using the Stata/MP 17.0 software.
RESULTS
The results of the estimated fixed effect model are presented in table 2.
Table 2: Estimated Fixed Effects Model
| Independent variable: Composite Index of Inclusive Growth | |
| Freedom in the World Index | -0.032556 |
| (0.040)** | |
| Log GDP per capita | 0.3128562 |
| (0.002)*** | |
| GDP Deflator | -0.010449 |
| (0.000)*** | |
| Foreign Direct Investment | -0.038635 |
| (0.047)** | |
| Trade | 0.006457 |
| -0.518 | |
| Control of corruption Index | 0.2010157 |
| (0.001)*** | |
| General Government Consumption Expenditure | 0.085693 |
| (0.030)** | |
| Urban Population Growth | -0.085092 |
| (0.001)*** | |
| Constant | -2.195366 |
| (0.003)*** | |
Source: Author’s Computations (2024)
p-values are in brackets. *** significant at 1% ** significant at 5%
The Freedom in the World Index has a negative significant coefficient of 0.032556. This coefficient suggests a negative association between democracy and inclusive growth within each SSA country over time. This outcome, though different from the results from other studies, is plausible. Most SSA countries conduct frequent elections, but the policies of some leaders hardly focus on closing the gap between the rich and the poor. There is also the issue of dominant party systems where one party remains in power for extended periods and constitutes a bourgeoisie class. These parties might prioritize maintaining their power over policies that focus on broad-based development. This may be a possible explanations for the negative association. This gives room for further analysis by separating the SSA countries into two groups. One group will be countries with an average FIW index score above 50 for the period under review and the other group will be those below 50. This analysis is conducted below.
The GDP per capita variable has a significant positive coefficient that implies a positive relationship between a country’s initial level of development and the composite inclusive growth index. This result aligns with the economic convergence theory that countries with lower initial GDP per capita have more potential for growth due to factors like the catching-up effect. The GDP deflator, representing inflation, has a significant negative relationship with the composite index. Although the size of the relationship is negligible, the direction of the relationship can be backed by economic theory since inflation has the potential to erode the purchasing power of households, particularly those with low and fixed incomes thus, reducing inclusive growth. The net inflow of FDI variable has a significant negative association with the composite index. This may suggest that there may be limited spill over effects for the broader economy across SSA countries. The benefits of FDI may be concentrated in specific sectors or might be captured by elites and so benefits might be limited to just a cross-section of the population.
For the institutional variables, the control of the corruption index has a positive significant association with the composite index. This aligns with theoretical expectations since corruption diverts resources away from productive activities and investments that could benefit the broader population. By reducing corruption, resources can be more efficiently allocated, leading to a fairer distribution of resources that can help reduce income inequality and promote inclusive growth. The general government consumption expenditure variable is positive and significant highlighting a positive association with inclusive growth. Most SSA governments have in recent years devoted a significant portion of their expenditure to productive investments like education, healthcare, and infrastructure that can benefit the broader population and promote inclusive growth. However, further analysis is needed to ascertain the specific mechanisms at play.
Urban population growth and the composite index have a negative association as revealed by the analysis. This is plausible because rapid urbanization in most SSA countries tends to outpace the available resources in urban areas, hindering productivity and economic growth. There is also a decline in the quality of life for urban residents that potentially hinders inclusive growth.
Table 3: Countries with high Average FIW Index (more democratically developed) vs Countries with low Average FIW Index (less democratically developed)
| Independent variable: Composite Index of Inclusive Growth | ||
| High Average FIW | Low Average FIW | |
| Freedom in the World Index | -0.019077 | -0.050166 |
| -0.206 | (0.085)* | |
| Log GDP per capita | 0.4723102 | 0.2937762 |
| (0.001)*** | (0.038)** | |
| GDP Deflator | -0.0008652 | -0.0003055 |
| (0.071)* | -0.537 | |
| Foreign Direct Investment | -0.0016957 | -0.0035449 |
| -0.389 | -0.209 | |
| Trade | 0.0004625 | 0.0020543 |
| -0.64 | -0.184 | |
| Control of corruption Index | 0.2457842 | 0.3270363 |
| (0.000)*** | (0.007)*** | |
| General Government Consumption Expenditure | 0.0257086 | -0.0152507 |
| (0.000)*** | (0.009)*** | |
| Urban Population Growth | -0.0056166 | -0.1401594 |
| -0.891 | 0 | |
| Constant | -3.79859 | -1.856783 |
| (0.000)*** | -0.061 | |
Source: Author’s Computations (2024)
p-values are in brackets. *** significant at 1% ** significant at 5% *significant at 1%
Table 3 presents the results for when the countries are divided into high and low average FIW indexes. The analysis shows that the FIW index is not significant for countries with a high score but the index has a negative significant coefficient for countries with a low score. The insignificant coefficient for countries with high average FIW scores could be because of the ceiling effect. These countries might have already achieved a certain level of inclusive growth due to their democratic institutions and further improvements in the FIW index may not lead to substantial additional gains. Furthermore, there may be other factors that might be playing a significant role in influencing inclusive growth in these countries such as control of corruption, government spending, and the level of economic development, amongst others. The countries with a low score follow the same pattern as when all the countries are analysed together. This may be a case of reverse
causality as economic decline or stagnation in these countries may lead to calls for democratic reforms. So, democratic improvements might appear to precede lower growth but not necessarily cause it.
These results show that there might be a threshold effect at play. Improvements in democracy might only translate into positive growth effects after reaching a certain level of democratic development (which the high FIW countries might have already surpassed).
CONCLUSION
This research investigated the relationship between democracy and inclusive growth in SSA. It employed a fixed effects model to analyse the impact of the FIW index score, alongside other economic, institutional, and demographic factors, on a composite index of inclusive growth. The overall analysis showed a negative association between the FIW score and inclusive growth across SSA countries suggesting that improvements in democracy may not directly translate into inclusive growth. Further analysis revealed a potential threshold effect. For countries with a high average FIW score (more developed democracies), the FIW index was not statistically significant. This suggests that democratic institutions might need to reach a certain level of maturity before they translate into positive growth effects. In contrast, for countries with a low average FIW score (less developed democracies), the FIW index had a negative and significant coefficient. This finding requires further investigation, but it could be due to reverse causality, where economic decline drives calls for democratic reforms. Based on these findings, several recommendations for future research and policy considerations emerge:
- There may be a need to further investigate the threshold effect to identify the specific level of democratic development at which democratic institutions begin to positively influence inclusive growth in SSA.
- It may also be imperative to consider using alternative indices or measures of democratic quality that might better capture aspects relevant to inclusive growth in the SSA context.
- More in-depth insights could be obtained by analysing the impact of specific democratic features (e.g., citizen participation, checks and balances) on different dimensions of inclusive growth (economic, social, sustainability).
LIST OF ABBREVIATIONS
- COVID-19 – Coronavirus disease
- FIW Index – Freedom in the World Index
- GDP – Gross Domestic Product
- IMF – International Monetary Fund
- SSA – Sub-Saharan Africa
- TFP – Total Factor Productivity
LIST OF REFERENCES
- Adeosun, O., Olomala, P., Tabash, M., & Anagreh, S. (2022). Investment and inclusive growth in Sub-Saharan Africa. Journal of Economic and Managment Studies, 13(4), 525-550.
- Ali, A., & Analoui, F. (2023). Decentralisation by military regimes and challenges to citizen participation: an empirical reflection from Pakistan. Humanities and Social Sciences Communications, 10(337). Retrieved from https://doi.org/10.1057/s41599-023-01780-1
- Barro, R. (1996). Democracy and Growth. Journal of Economic Growth, 1, 1-27.
- Basedau, M. (2023). Under Pressure: Democratization Trends in Sub-Saharan Africa. GIGA Institute for Africa Affairs(4). Retrieved from https://doi.org/10.57671/gfaf-23042
- Benson, H. G., Zuure, D. N., & Achanso, A. S. (2021). Student and Africa’s Democratization Process: From Colonial to Post-Independence Eras. The International Journal of Humanities and Social Studies, 9(1).
- Cheeseman, N., & Klaas, B. (2018). How to rig an election. Yale: Yale University Press.
- Christiansen, L., & Devarajan, S. (2013). Making the Most of Africa’s Growth. Current History, 112(754), 181-187. Retrieved from https://doi.org/10.1525/curh.2013.112.754.181
- Colagrossi, M., Rossignoli, D., & Maggioni, M. A. (2020). Does democracy cause growth? A meta-analysis (of 2000 regressions). European Journal of Political Economy, 61.
- Comeau, L. (2003). Democracy and Growth: A Relationship Revisited. Eastern Economic Journal, 29(1), 1-21.
- Diamond, L. (1997). Civil Society and the Development of Democracy. Estudio Working Paper.
- Doucouliagos, H., & Ulubasoglu, M. A. (2008). Democracy and Economic Growth: A Meta Analysis. American Journal of Political Science, 52(1), 61-83.
- Feng, Y. (1997). Democracy, political stability and economic growth. British Journal of Political Science, 27(3), 391-418.
- Ferreira, A. I., Gisselquist, R. M., & Tarp, F. (2022). On the Impact of Inequality on Growth, Human Development, and Governance. International Studies Review, 24(1).
- George, G., Corbishley, C., Khayesi, J., Haas, M., & Tihanyi, L. (2016). Bringing Africa In: Promising Directions for Management Research. Acadamy of Management Journal, 59(2). Retrieved from https://doi.org/10.5465/amj.2016.4002
- Ianchovichina, E., & Lundstrom, S. (2012). What is Inclusive Growth? In R. Arezki, C. A. Patillo, M. G. Quityn, & M. Zhu, Commodity Price Volatility and Inclusive Growth in Low-Income Countries (pp. 147-160). Washington D. C.: International Monetary Fund.
- Ibhawoh, B. (2021). Socialist Regimes and Economic Planning . Oxford Research Enclycopedia of African History.
- Ifzal, A., & Hyun, H. (2007). Measuring Inclusive Growth. Asian Development Review, 24(1), 11-31. Retrieved from https://doi.org/10.1142/S0116110507000024
- Jalles, J. T., & Mello, d. L. (2019). Cross-country evidence on the determinants of inclusive growth episodes. Review of Development Economics, 23(4), 1818-1839. Retrieved from https://doi.org/10.1111/rode.12605
- Kashimani, E. M. (1995). Zambia: The disintegration of the nationalist coalitions in UNIP and the imposition of the one-party state, 1964-1972. Transafrican Journal of History, 24, 23-69. Retrieved from http://www.jstor.org/stable/24328653
- Levitsky, S., & Way, L. A. (2006). Linkage versus Leverage: Rethinkng the international dimension of regime change. Comparative politics, 38(4), 379-400.
- Ma, T. C., & Ouyang, L. (2016). Democracy and Growth: A Perspective from Democratic Experience. Economic Inquiry, 54(4), 1790-1804.
- Mamdani, M. (1996). Citizen and Subject: Contemporary Africa and the legacy of late colonialism . Princeton University Press.
- Martin, M. L. (1995). The ‘Lifecycle’ of Military Rule in Sub-Saharan Francophone Africa. In A. Kirk-Greene, & D. (. Bach, State and Society in Francophone Africa since Independence. London: Palgrave Macmillan.
- Mazrui, A. (1980). The African Condition: A Political Diagnosis . Massachussets: Cambridge University Press.
- Messono, O., & Homere III, N. (2020). Composite Index of Inclusive Growth in Sub-Saharan Africa: The Inclusion of the Informal Sector. South Asian Journal of Social Studies and Economics, 6(2), 1-16. Retrieved from https://doi.org/10.9734/sajsse/2020/v6i230161
- Ngepah, N. (2017). A review of theories and evidence of inclusive growth: an economic perspective for Africa. Environmental Sustainability, 24, 32-57. Retrieved from https://doi.org/10.1016/j.cosust.2017.01.008
- Okurut, E. (2018). Eliminating Presidential term limits in Africa: The new form of dictatorship. University of Botswana Law Journal, 22(5).
- Rodirk, D. (2014). An African Growth Miracle? NBER Working Paper Series(20188). Retrieved from https://www.nber.org/papers/w20188
- Rowley, C. K. (2000). Political Culture and economic performance in sub-saharan Africa. European Journal of Political Economy, 16(1), 133-158. Retrieved from https://doi.org/10.1016/S0176-2680(99)00051-8
- Stawska, J., & Jablonska, M. (2022). Determinants of Inclusive Growth on the Context of the Theory of Sustainable Finance in the European Union countries. Sustainability, 14(1). Retrieved from https://doi.org/10.3390/su14010100
- Sugden, C. (2012). Is Growth in Asia and the Pacific Inclusive? ADB Working Paper Series(317), 1-49. Retrieved from http://ssm.com/abstract=2221744
- Suttie, D., & Benfica, R. (2016). Fostering inclusive outcomes in Sub-Saharan Africa agriculture: Improving Agricultural Productivity and Expanding Agribusiness Opportunities. IFAD Research Series(3).
- Tavares, J., & Wacziarg, R. (2001). How Democracy affects Growth. European Economic Review, 45(8), 1341-1378.
- Thorbecke, E. (2014). The structural anatomy of inclusive growth in Sub-Saharan Africa. WIDER working paper(2014/041). Retrieved from https://doi.org/10.35188/UNU-WIDER/2014/762-2
- Van de Walle, N. (2001). The impact of multi-party politics in Sub-Saharan Africa. Forum for Development Studies, 28(1), 5-42.
- Wooldridge, J. (2016). Introductory Econometrics: A Modern Approach. Michigan: Cengage Learning.
- World Bank. (2020). Global Economic Prospects. Washington DC: World Bank.
- Xi, T. (2017). Inclusive institutions and economic growth: comparative perspective and policy implications for China. China Economic Journal, 10(2), 108-127.
- Zindela, Z., & Oguunibi, O. (2017). Democratisation of Africa: Reflections of Theory and Practice in Ghana. Journal of Conflict and Social Transformation, 6(1), 121-144.