
Determinants of Electricity Demand in Nigeria: A Non-Linear Autoregressive Distributed Lag (NARDL) Analysis
- Najeem O. Bashiru
- Muideen A. Isiaka
- Sulaimon A. Lawal
- 767-783
- May 20, 2024
- Business Management
Determinants of Electricity Demand in Nigeria: A Non-Linear Autoregressive Distributed Lag (NARDL) Analysis
1Najeem O. Bashiru*, 1Muideen A. Isiaka 2Sulaimon A. Lawal.
1Department of Economics & Actuarial Sciences, Crescent University, Abeokuta Ogun State, Nigeria
2Centre for Petroleum Energy Economics & Law, CPEEL, University of Ibadan, Ibadan Oyo State Nigeria
*Correspondence Author
DOI: https://doi.org/10.51244/IJRSI.2024.1104056
Received: 06 April 2024; Accepted: 13 April 2024; Published: 20 May 2024
ABSTRACT
The study empirically identifies determinants of electricity demand in Nigeria while taking into account their long run effects on the nation. Secondary data covering a time frame of thirty eight (38) years (1980- 2018) were used in the study. In order to investigate the asymmetric and nonlinear long-term effects of determinants of electricity demand on its consumption, the study adopts the multivariate nonlinear ARDL method propounded by Shin et al. (2014). Results show that negative shock in the average price of electricity leads to increased electricity demand however; positive shock does not decrease electricity demand either. A percentage increase in Electricity Access causes electricity demand to rise by 3.4% while its reduction causes electricity demand to reduce by 6.26%. A percentage increase in power supply enhances electricity demand to rise by more than hundred percent, while its reduction causes electricity demand to drop. At 5% level of significance Wald test confirms that positive and negative shocks among the variables are not the same in the long run. Also the series never experienced structural break. The study recommends tenacious government effort towards improving electricity supply and access rate beyond the current rate (56.5%.), rather than influencing tariff that is being charged.
Keywords: NARDL, Electricity demand, Asymmetry, Shock
INTRODUCTION
Electricity supply in Nigeria has been significantly inadequate without being able to meet basic household and industrial needs for several years such that its demand has always been in excess of supply across all sectors of the economy. The difference between electricity generation and its demand has never been less than over 5,000 megawatt in each succeeding year, since over forty years ago. In 2012 precisely, the industry struggled to distribute just 5,000 megawatts across every user, while the required power was put at about 40,000 megawatts to sustain the economy. Ironically, the already insufficient generated power is seldom taken up by the Distribution Companies for onward distribution to consumers, largely because of problems of load under-utilization and inability to duly collect tariffs. Households and businesses resorts to high cost alternative sources to power their properties and investments. However as the population of the country continue to grow, thereby stretching various infrastructure and economic activities, electricity problem become more daunting. The United Nations annual population growth rate estimate of 2.5% for the country indicates that the nation will continue to face this challenge in the future to come, if the power terrain is not meaningfully transformed.
The endemic power problem in the country has adversely affected several sectors of the economy that are capable of enhancing growth. Such sectors include large industries, hospitals and universities that require regular electricity supply to undertake high level research and development works. Further, many electricity-dependent small manufacturing firms are not able to meet up with their operating cost and thereby causing most of them to fold up. The steady and regular power supply needed for various type of growth imbued industries, where goods, appliances, tools, instruments, machines, modern communication equipment and gadgets are manufactured are therefore suffering.
The country’s electricity problem has been known to be in existence for a long time but meaningful efforts never came towards the Nigerian Power sector earlier than during the Fourth Republic. However, the various intervention programmes and projects instituted by the government to ameliorate the situation cannot be said to have achieved their objectives. In 2005, the government introduced the Electricity Power Sector Reform (EPSR) Bill, and later passed it into law in 2006. To that effect the Power Holding Company of Nigeria was created, so also was the Nigeria Electricity Regulatory Commission. The bill also ensured the appointment of a legal firm through the Bureau of Public Enterprises and creation of the Power Consumer Assistance Fund (Aremu, 2019). In spite of all these, the problem persists.
The notion that energy switch take a direct and continuous pattern has been extensively discussed (Masera, Saatkamp and Kammen, 2000; Reddy & Reddy, 1994). However, the choice of energy use in a developing economy is asymmetry and never a linear phenomenon for two reasons. First is that income is not the only influencing factor that determines energy substitution, especially in Nigeria (Babatunde and Enehe, 2011). A complete switch from one source of energy to another is hardly made, rather various available sources are combined and used as the situation may demand or arise. Second is that irregular income, which is common in a developing economy such as Nigeria, could also be a factor for energy stacking (Kroon, Brouwer and Beukering, 2011).
Empirically, various works have been done on energy demand and factors affecting it (Kayode, Akhavan, and Ford, 2013; Masera et. al., 2011; Kowsari and Zerrifi, 2011; Babatunde and Enehe, 2011) however, the studies did not adequately capture the asymmetry nature or behavior of the factors affecting energy demand. This beclouds the actual effects of these factors on energy demand because the in-depth representation is missing in models adopted in these studies. Recommended policies in this regard, are also likely to have inherited from the flaw. It is against this backdrop that this study contributes to the body of knowledge by addressing this lacuna. The adopted Non-linear analysis permits the incorporation of possibilities of asymmetric effects of both direct and inverse shocks emanating from determinants of electricity demand on the power consumption. In this context, this allow for segregation of components of energy demand as captured by the adopted independent variables and their respective impacts on the dependent variable under examination. The study therefore impacts a great deal by presenting a more scientific representation in the area of energy demand and its determinants in Nigeria.
Having observed that electricity demand has always been in excess of its supply with the attendant adverse effect on all aspects of the economy, rendering various government efforts inadequate, it becomes imperative to ask the following questions; What are the factors determining electricity demand in Nigeria? What is the long-run effect of electricity determinants on its demand in Nigeria?
This study empirically identifies the factors influencing demand for electricity in Nigeria. It examines the short-run and long-run effects of these determinants and also establishes causal relationship between them.
REVIEW OF LITERATURE
The Energy Transition model narrative, on the one hand, portends that consumers’ energy choice and switching is critical in explaining the transition process, given the assertion that direct relationship exist between refined or modern energy consumption and economic productivity – Energy Ladder. On the other hand, it indicates that it is not only economic status that determines energy-use pattern when transition occurs – Energy Stack model. The Energy Ladder model assume consumers, both firms and households will switch to more effective and modern energy carriers, given price and income, to maximize their utility (Hosier & Dowd, 1987). The act of scaling up the energy stairs portends a linear or direct movement from one energy source to a more sophisticated or modern energy source. As such, consumers are bound to substitute better energy sources such as gas and electricity for the less efficient ones. However, the Energy Stack model suggests that energy consumption may not necessarily follow a linear movement while consumer utility is being maximized, multiple fuel use is equally found among consumers, be it firms or households, (Masera, et. al., 2000).
The Distributed Lag Dynamic Electricity Demand (DED) model incorporates the effects of previous electricity demand and past consumers’ income, as additional variables that influences electricity demand. The DED model is based on Nerlove’s Stock Adjustment Principle which tells that current demand decision is a function of previous levels of consumer electricity demand and their past income. For durable items where appliances such as machines, refrigerator, fan and so forth belong, the past purchases constitutes a ‘Stock’ and therefore influences users’ present and future purchases. For non-durable items where electric power belong, past purchases tend to show a ‘behaviour or habit’ which accrues overtime from the purchases of electric power, which is directly used by the landed electrical appliances that in turn generate utility or production, as the case may be. However, the more recent previous levels of electricity demand and consumers’ income have greater effects on current power consumption pattern than the far past values. A consumer’s previous year’s income could have caused it to acquire more electrical appliances than what it earned in the past ten years. This tends to influence the current demand for electricity. A general distributed lag model of demand and income may be expressed thus;
Qt = f( Pt, Pt-1, – – -, Qt-1, Qt-2, – – -, Yt, Yt-1, – – -) eq (2.1)
Where;
Qt = Current quantity/unit of electric power purchase
Pt = Current price/tariff of electric power
Pt-1 = Price/tariff in the previous period
Qt-1 and Qt-2 = Quantity/unit of electric power purchased in previous periods
Yt = Current income of the consumer
Yt-1 = Past income of the consumer
The general distributed lag demand function can be segregated into a demand function for durable and non-durable commodities. The model for durables takes the form
Qt = aYt + bQt-1 eq (2.2)
Equation (2.2) indicates that a preferred level of electrical appliances Qt* exist, and it is determined by the present income Yt
Qt* = cYt eq (2.3)
Given that the desired level of electrical appliances cannot be instantly purchased by consumers’ at once due to limited income, it is indicated in (3.3) that c represents a parameter/proportion of current income, therefore, spent on electrical appliances as he makes gradual purchase in each period. The habit formation principle is applied in the model for non-durables. In the demand function, the current demand for non-durable such as electric power (Qt), depends on the past purchases of other commodities, based on habit, (Qt-1). The demand function takes the form;
Qt = a + b1Pt + b2ΔPt + b3Yt +b4ΔYt + b5Qt-1 eq (2.4)
In (3.4), Qt = demand for electric power, a = constant, Pt = current price/tariff, ΔPt = change in price/tariff, Yt = current consumer income, ΔYt = change in consumer’s income, and b1 to b5 = coefficients. The demand function for non-durables is derived from the demand for durables, which in any period depends on current price, the stock of durables, and the stock of habits for non-durables and on current income level.
In order to determine how income, family size, population growth and other socioeconomic factors affect household energy demand, various works have been done both in the developed economies and in the Global South. In the renowned work of Masera, et. al., (2000), they studied fuel switching strategies among the four Mexican states and one illustrative village, using cross sectional data between 1992 and 1996. The authors’ were able to show that the multiple fuel model more accurately depicts energy use pattern in household’s decision making under conditions of resource scarcity, by integrating cultural preferences, health impact, technical features of energy appliances and the economics of fuel types and access conditions. In order to identify and examine the major determinants of households’ electricity demand in Nigeria, Babatunde and Enehe, (2011), gathered information on 404 households across Lagos, Oyo, Kaduna and Anambra states in Nigeria between March and November, 2010. The gathered data were analysed using the OLS regression method. The study made three key findings; first was that average time of power supply, size of household and rooms per house are the factors affecting household electricity demand in the country. Further, it found that electric power consumption was income inelastic and finally, electricity was identified to be one of the important basic needs of households in the country.
Adetunji, Adesinyan and Sanusi, (2007), conducted a study to assess the pattern of electric power consumption among households in Oshogbo LGA, Osun State Nigeria. The study adopted systematic random sampling to gather information from 120 households, through structured questionnaire. While the properties of the observations were examine through descriptive statistics, the relationships between personal features of respondents and energy consumption pattern were tested using regression and correlation analyses. The study found, at 5% significant level, that about 57% and 35% of the households earned income of N2,000 and N4,000 respectively. The major energy in use in the study area was found to be firewood.
At the industry level, Lu, (2016) examines causation between electric power consumption and growth of economy in Taiwan using Seventeen industries. The study covered a time frame of 16 years, between 1998 and 2014. The study used Panel co-integration to ascertain the long-run relationship of the variables and used Granger test to check for causality. Equilibrium was found between the variables in the long-run while economic growth and electric power consumption granger-causes each other. The regression result shows that increase in electric power demand has positive effect on outputs from industries. Similarly, Abid and Rafaa, (2014), examined causality between power consumption and outputs from industries using time series. The research was conducted in Tunisia between 1980 and 2007. Result only establishes causality from electricity demand to industry GDP.
Ugwoke, Christopher and Paul, (2016), investigated the impact of electricity consumption on industrial output in Nigeria, using a secondary data set covering a period of 24 years, (1980 to 2014). A double-log linear model was used to examine the responsiveness of output to electricity consumption. The results show that electricity impact industrial production negatively in Nigeria, however the estimate is not statistically significant. In the comparative study done by Karisma and Noor, (2016) on electricity consumption behavior between business and non-business households in Malang city of Indonesia, a panel analysis was conducted using observations on income, location, price of electricity and other socioeconomic variables. The adopted variables were analysed using multiple linear regression model and the Chow test. The study found that electricity consumption pattern of non-business household is not the same with the consumption of business households. While electricity consumption of businesses is important for production and may not be influenced by tariff, non-businesses consumption is mainly influenced by ability to pay. Otsuka, (2015), estimated and delineate electric power demand functions comparing the industrial and commercial sectors in Japan. Using panel data, partial adjustment approach was employed in the analysis. The study results revealed that in both sectors, responsiveness of electricity demand to change in tariff was very low. However, responsiveness to electric power demand is higher than price elasticity, indicating that elasticity tariff does not influence electricity demand fluctuations.
At the national level, Ubani, (2013), worked on factors responsible for the dynamics of electric power consumption in Nigeria using secondary data set 1985-2005. Multiple Linear Regression (MLR) technique was used in the work. The R2 value of 0.992 indicates that about 99% of the variation in consumed electricity is captured by the adopted socioeconomic factors. Glauco De Vita and Hunt, (2005) estimated long run responsiveness of electricity demand in Namibia using various energy types, between 1980 and 2002. The study made use of end-user data on electricity, petrol and diesel drawn from Nampower Internal Accounting Records and GDP data from Namibian National Planning Commission. The result revealed a direct association between GDP and power consumption while there exist an inverse relationship between energy prices and its consumption.
Ebere, Rufai Okedina and Afodu (2018), examined the determinants for electricity demand in Nigeria between 1970 and 2015 using electric power demand, Per capita Income, tariff per unit of electricity and urbanization as key variables. Time series were sourced from NERC, Central bank and the National Bureau of Statistics. Multiple linear regression technique and test for causality were adopted. While the study established existence of co-integrating relationship among adopted variables, ECM coefficient indicated that the speed at which disequilibrium in electricity demand in Nigeria adjusts during the period under study is 118% annually. In the same vein, Ngutsav and Aor, (2014) analysed the factors affecting electricity consumption in Nigeria using secondary data on electricity consumption, RGDP, Income per capita and population. Results of the Error Correction analysis indicates that Per capita Income, industrial output and population are key drivers of electricity consumption. Tariff does not influence electricity demand
Energy transition theory is the theoretical framework for this study as informed by the work of Heltberg, (2005). The author asserts that the consumption of refined energy is an indication of fuel stacking during the development process. However, at the top end of the ladder when a user is fully developed he switches completely from primitive/less efficient energy sources. The indication of this is that stacking of fuel is not continuous but a transient process.
MATERIALS AND METHODS
Type and Sources of Data
The research employs the use of annual time series. The data covers a time frame of thirty eight (38) years between 1980 and 2018. The study uses the following variables in the course of its analysis: Electricity consumption in Nigeria, Electric power Supply, Tariff per unit of electricity (average price), Degree of urbanization in Nigeria overtime, Households with electric power connection in the country during the period of study and number of major manufacturing firms in Nigeria. Data used in the study are sourced from annual publications of the CBN Statistical Bulletin and the Nigerian Electricity regulatory Commission data base.
Estimation Technique
Descriptive statistics is carried out on the collected data to examine their properties. The Phillip-Perron and ADF tests for unit root were used to check for long-run equilibrium in the data set. On the one hand, both tests are employed to correct for the random walk inherent in the series and thereby avert biasedness in empirical results that could occur from using series with unit root problem (Dickey and Fuller,1981; Perron, 1989). On the other hand, adopting the two tests helps to guide against result ambiguity as the asymmetric treatment of structural breaks are checked, Kim & Perron, (2009)
In this paper, the Nonlinear Auto regressive Distributed Lag analysis is used as propounded by Shin, Yu and Greenwood-Nimmo, (2014). It helps to effectively capture the non linearity and asymmetric relationship (both near and distant influences) inherent between influencing factors of electric power demand and its consumption. The NARDL analysis is a variant of the linear ARDL model developed by Pesaran et al. (2001) which examines short and long run asymmetry linkages between variables. This approach helps to test for cointegration among variables that determines electricity consumption among households in Nigeria, in a single equation. Also, the model relaxes the restriction that the adopted variables (time series) should be of the same order. This therefore gives room for the possibility of combining series that have different order of integration. Further, the NARDL model also helps to test and detect if cointegrated relationships between some series have been omitted in the course of analysis, (Granger and Yoon, 2001).
Causality among the employed variables is tested with the aid of the Toda-Yamamoto (T-Y) granger causality test. It does occur that time series are integrated of different orders, integrated of the same order, or both. In any of such case, the normal granger causality method will not be adequate to capture true direction of causation among adopted series. Toda and Yamamoto, (1995), hence developed an alternative test which adequately captures causality, regardless of the integration order of the series, or even when cointegration does not exist among the series. This test is referred to as the Toda and Yamamoto, (1995) augmented Granger causality. This test for causality is adopted because it conveniently circumvents challenges of asymptotic critical values in series whose order of integration are other than I(0) or when there is no continuous equilibrium between variables. This test also keeps in check the chances of wrongly detecting integration order of adopted variables or series.
Various diagnostic tests are also employed to validate the study results. These include the Breusch-Godfrey statistics/test for heteroskedasticity, the Ramsey RESET test for model specification and the Cumulative Sum of square test for parameter stability, (CUSUM).
Model Specification
– The NARDL Model
In order to provide a simple means of analyzing joint, long and short-run asymmetries, Yongcheol Shin and Byungchul Yu, (2004) introduced an asymmetric long-run regression, which exposes the possible effects of an explanatory variable on an explained variable as thus;
Yt = β+X t+ + β−Xt − + εt eq. (3.1)
∆Xt = Yt eq. (3.2)
From the above, Yt and Xt are integrated of order (I).The variable Xt capturing factor influencing electric power demand is split into Xt = X0 +X t+ +X t−. X t+ and X t − represents partial addition processes of positive and negative impulses in the influencing factors, that is;
Xt+= ∑∆Xj+ =∑max (∆Xj, 0)
Xt− =∑∆Xj− =∑min (∆Xj, 0) eq. (3.3)
Compactly, the NARDL model derived hereafter is given by
Yt = ∑ αj Yt-j + ∑( βj+X +t-j + β–X –t-j ) + εt eq. (3.4)
In eq. (3.4), α is the autoregressive estimator, β+ and β– are the parameters capturing the impulses, while εt is the stochastic random process. Following the Shin et al. (2014), method of NARDL model, this study estimated the below model in its analysis;
∆ECN𝑡 = 𝛽0 + 𝛽1ECN𝑡−1 + 𝛽2PS+𝑡−1 + 𝛽3PS−𝑡−1+ 𝛽2PRE+𝑡−1 + 𝛽3PRE−𝑡−1+ 𝛽2MAN+𝑡−1+ 𝛽3MAN−𝑡−1 + 𝛽2HH+𝑡−1+ 𝛽3HH−𝑡−1 + 𝛽2URB+𝑡−1+ 𝛽3URB−𝑡−1 + ∑𝜑𝑖∆ECN𝑡−𝑖 + ∑(𝜃𝑖+∆PS+𝑡−𝑖 + 𝜃𝑖−∆PS−𝑡−𝑖) + ∑(𝜃𝑖 +∆PRE+𝑡−𝑖 + 𝜃𝑖−∆PRE−𝑡−𝑖 ) + ∑(𝜃𝑖+∆MAN+𝑡−𝑖 + 𝜃𝑖−∆MAN−𝑡−𝑖 ) + ∑(𝜃𝑖 +∆HH+𝑡−𝑖 + 𝜃𝑖−∆HH−𝑡−𝑖 ) +∑(𝜃𝑖 +∆URB+𝑡−𝑖 + 𝜃𝑖−∆URB−𝑡−𝑖 ) +ε𝑡 eq. (3.5)
Where;
ECN = Electricity Consumption in Nigeria (Kwh)
PS = Power Supply (Kwh)
PRE = Average tariff per unit of electricity (kobo/kw)
HH = Number of Households with Electricity connection in Nigeria
MAN = Number of major manufacturing firms/industries per state
URB = Degree of Urbanization (percent)
The Toda-Yamamoto Causality Model
Causality among adopted variables is tested following the below equations in accordance with the T-Y augmented Granger causality test
Xt = α+ ∑βiXt -i + ∑∅iYt – i + εt eq. (3.6)
Yt = α + ∑ λiYt – i + ∑δXt – i + εt
Definition of Variables
Electricity Consumption is taken as the electrical energy per unit time, consumed by used appliances, such as a home appliance, office equipment and industrial machines. Its unit of measurement is either watts (W) or kilowatts (kW). Electric power consumption in the study is represented by actual power production minus distribution, transmission, and transformation losses and own use by heat and power equipment/plants. It is the regressand upon which test of other variables are examined, in this paper
Power Supply is the process of delivery of electricity, which is generated from other sources of primary energy, to consumers. This primary energy sources can be water, gas, sun, steam, wind, fossil or waste. Electricity supply is measured in watt (W) or kilowatt (kW). Power supply is one of the independent variables in the study.
Average tariff per unit of electricity is estimated as the ratio of total internally generated revenue in the country to actual consumed electricity. It is one of the explanatory variables, measured in kobo/kw. Degree of urbanization is proxied for using urban population as a percent of total population.
RESULTS
Descriptive Analysis of Variables
The characteristics of the adopted series in the study are described by the descriptive statistics below.
Table 1: Descriptive Statistics
| APR_E | E_ACCESS | ECN | MAN | P_SUPPLY | POP | |
| Mean | 0.018922 | 46.25373 | 3.221169 | 5.405033 | 10.31422 | 2.575057 |
| Median | 0.019365 | 47.10199 | 3.241272 | 5.303205 | 10.32449 | 2.579037 |
| Maximum | 0.040877 | 59.30000 | 3.583482 | 5.991983 | 10.49729 | 2.677659 |
| Minimum | 0.006163 | 27.30000 | 2.946305 | 5.298873 | 10.12914 | 2.488183 |
| Std. Dev. | 0.008533 | 7.896266 | 0.212089 | 0.216527 | 0.127126 | 0.069737 |
| Skewness | 0.923949 | -0.379579 | 0.191054 | 1.761662 | 0.073589 | 0.119233 |
| Kurtosis | 3.921557 | 2.420622 | 1.531035 | 4.421197 | 1.478280 | 1.471954 |
| Jarque-Bera | 5.152330 | 1.102000 | 2.783834 | 17.44062 | 2.824230 | 2.890081 |
| Probability | 0.076065 | 0.576373 | 0.248598 | 0.000163 | 0.243627 | 0.235737 |
| Sum | 0.548732 | 1341.358 | 93.41389 | 156.7460 | 299.1123 | 74.67665 |
| Sum Sq. Dev. | 0.002039 | 1745.828 | 1.259483 | 1.312745 | 0.452511 | 0.136172 |
| Observations | 29 | 29 | 29 | 29 | 29 | 29 |
Author’s Computation, 2020
The descriptive statistics reports the mean of Average Price of Electricity, Electricity Access, Electricity Consumption, Manufacturing Industries, Power Supply and Population growth as 0.018922, 46.25373, 3.221169, 5.405033, 10.31422 and 2.575057, respectively. The maximum values of the series are 0.040877, 59.30000, 3.583482, 5.991983, 10.49729 and 2.677689 respectively, while the respective minimum values of the series are shown to be 0.006163, 27.30000, 2.946305, 5.298873, 10.12914 and 2.488183. The Jarque-Bera probability Statistics for all adopted series, except Manufacturing Industries, are not statistically significant, therefore indicating that they are normally distributed.
Trends of Electric Power
The installed capacity of the Nigerian Transmission Company (TCN) network is large enough to wheel over 7,000MW of power, but the Power generation challenges faced by the country has kept the actual wheeled power far below this capacity. This has been the trend over the years up to the period of study.
Table 2: Installed Electric Capacity, Generation and Consumption in Nigeria
| Year | Installed Capacity MW/h | Total Generation MW/h | Consumption MW/h |
| 2013 | 12232 | 3297.5 | 2898.7 |
| 2014 | 12232 | 3348.1 | 3006.3 |
| 2015 | 13148 | 4165.9 | 3832.5 |
| 2016 | 13148 | 3806.7 | 3643 |
| 2017 | 13363 | 3516.8 | 2898.3 |
| 2018 | 13502.8 | 3712.2 | 3080.2 |
Figure 1: Trends of Electric Power Generation and Consumption in Nigeria
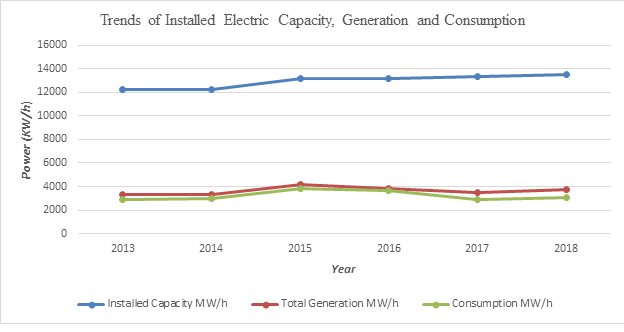
Source: Compiled by Author from Central Bank of Nigeria’s Annual Reports, 2020
Stationarity Test Results
Results of the test for existence or otherwise of random walk among the time series used for the analysis is presented below
Table 3: Stationarity Test Results
| AUGMENTED DICKEY FULLER | PHILLIP-PERRON | |||
| VARIABLE | STATISTICS | REMARK | STATISTIC | REMARK |
| APRE | -272.2688***a
(0.0001) |
I(0) | -154.8031***a
(0.0001) |
I(0) |
| EACCESS | -4.94682***a
(0.0006) |
I(1) | -17.44133***a
(0.0001) |
I(1) |
| ECN | -10.56895***a
(0.0000) |
I(0) | -7.127015***a
(0.0000) |
I(0) |
| MAN | -16.39634***a
(0.0000) |
I(1) | -4.571566***a
(0.0007) |
I(0) |
| PSUPPLY | -7.232770***a
(0.0000) |
I(1) | –7.241124***a
(0.0000) |
I(1) |
| POP GRWTH | -2.047589**c
(0.0405) |
I(1) | -3.107427**a
(0.0344) |
I(0) |
*** Significance at 1% a with Intercept
** Significance at 5% b with Trend and Intercept
* Significance at 10% c None
Author’s Computation, 2020
All variables examined are statistically significant at either 1% or 5%, hence the absence of unit root problem in the data set. While Average Price of Electricity (PRE), Electricity Access (EA), Electricity Consumption (ECN) and Power Supply (PS) are stationary at the same level, as shown in the results from both test, Manufacturing Industries and Population Growth (POP) are I(1) series in the ADF test but stationary at level when Phillip-Perron test was used.
In summary, both test revealed that the time series are combination of I(0) and I(1), without any I(2) variable.
The NARDL Test Result
The fitted asymmetric Autoregressive model examines direct and inverse effects (shocks) of the independent variables on electricity consumption, following a preliminary optimum lag selection process. The long run effects/shocks are presented below.
Table 4: The Long Run Coefficients
| VARIABLE | COEFFICIENT | STD ERROR | T-STATISTICS | PROB* |
| APREPOS | 8.341993 | 3.945026 | 2.114560 | 0.0881 |
| APRENEG | -18.600395 | 7.625105 | -2.439362 | 0.0587 |
| EACCESSPOS | 0.034356 | 0.014659 | 2.343764 | 0.0661 |
| EACCESSNEG | 0.062559 | 0.025423 | 2.460714 | 0.0572 |
| MAN POS | 0.588507 | 0.224684 | -2.619261 | 0.0471 |
| MAN NEG | 0.359985 | 0.160388 | 2.244461 | 0.0748 |
| P SUPPLY POS | 1.406424 | 0.383862 | 3.663875 | 0.0145 |
| P SUPPLY NEG | 5.228468 | 2.563754 | -2.039380 | 0.0969 |
| POP GRWTH POS | -2.044168 | 1.702903 | -1.200402 | 0.2837 |
| POP GRWTH NEG | -2.994885 | 1.866589 | -1.604470 | 0.1695 |
| C | -46.118833 | 19.747343 | -2.335445 | 0.0668 |
Source: Author’s Computation, 2020
From the result, a decrease (negative shock) in the average price of electricity (-18.600395) leads to increased electricity demand however, positive shock does not seem to decrease electricity demand. A percentage increase in electricity access (0.034356) causes electricity demand to rise by 3.4% while a reduction in electricity access (0.062669) causes electricity demand to reduce by 6.26% during the period of study. A rise or increase in the number of manufacturing industries (0.588507) causes electricity demand to rise by about 59% while about 36% reduction (0.359985) in electricity demand is experienced when there is a decrease in the number of manufacturing industries in the period.
During the period, the result also show that a percentage increase in power supply enhances electricity demand to rise by 1.406424, that is by almost 140%, and its reduction causes electricity demand to drop. Increase in population growth rate causes electricity demand to reduce while reduction in the rate of growth of population causes electricity demand to increase.
Bound Test Results
The F statistics (14.32294) of the bound test result is more than upper bound (3.86, 3.5, 3.24 and 2.94) at 1%, 2.5%, 5% and 10%, respectively, therefore long run equilibrium among the series is established, hence the validity of the fitted NARDL cointegrating long run model.
Test for Asymmetry
The plotted Multiplier Graphs and the Wald test examine the validity of the long run positive and negative shocks that adopted explanatory variables exert on electricity demand.
The Multiplier Effect
The multiplier effects of adopted explanatory variables as they influence electricity demand in the long run are shown below.
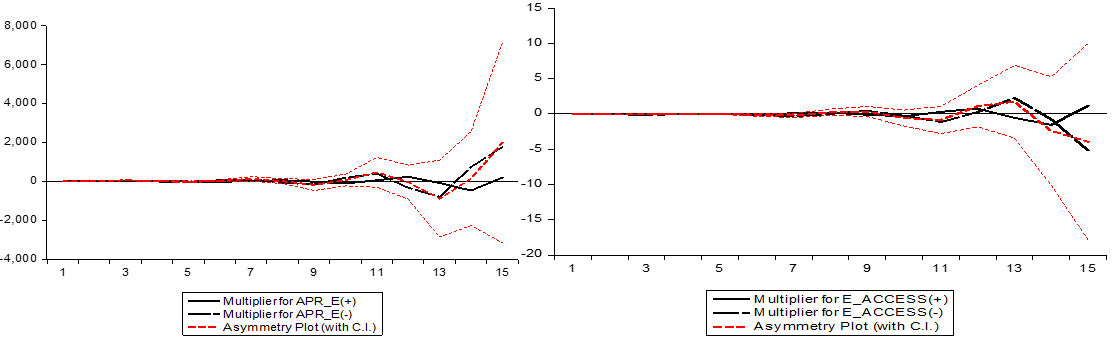
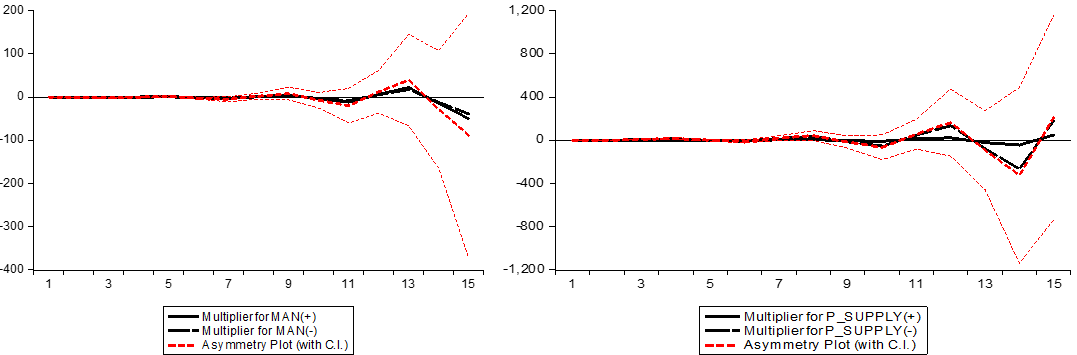
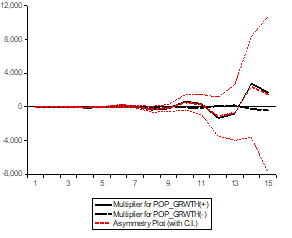
Figure 2: Multiplier Graphs for Asymmetric Variables
The positive multiplier shows the adjustment of electricity demand towards positive shock caused by the exogenous variable, over the horizon, while the negative multiplier shows the adjustment of electricity demand towards negative shock over time. The difference between the dynamic multipliers shock/effect on electricity demand is reflected by the asymmetry plot. The plots show non-existence of asymmetry movement between electricity demand and all the independent variables in the short run, given that the zero line falls within boundaries of the asymmetry plot indicating insignificance curvilinear relationship. However, the change in electricity demand to both direct and inverse effects/shocks in the explanatory variables is more pronounced in the long run.
Demand for electricity showed an inverse response to positive shock in electricity tariff in the long run, showing a slight digression below the asymmetry plot, and responds positively to negative shock from average price of electricity. The magnitude of increase in electricity demand due to negative shock from average electricity price is higher than the magnitude of decrease in electricity demand caused by positive shock in the average price of electricity. On the part of electricity access, positive shock leads to increase in electricity demand while negative shock leads to decrease in electricity demand. Although the magnitude of decrease in electricity demand caused by the negative shock is higher than the magnitude of increase in electricity demand caused by the positive shock.
Both positive and negative shocks from manufacturing industries, in the long run, have negative effect on electricity demand. While the positive multiplier for power supply indicates that electricity demand increases, the negative multiplier initially has a decreasing effect on electricity demand but later displayed an upward trend at the end of the study period, however no clear cut asymmetry is shown. The positive multiplier for population growth has alternating effect on electricity demand – first, with a decreasing effect, followed by increasing effect, and so on. The negative population growth multiplier, on the other hand, does not show a long run effect as it aligns with the asymmetry plot.
The Wald Test Result
The Wald test establishes if there is difference in the direct and inverse shocks of the influencing factors on electricity demand. The null hypothesis (H0) that effects of the direct and inverse shocks on the regressand are the same is stated as HSLR: β+ = β –, (Shin et al., 2011). Since the F statistics is significant at 5% for all the tested positive and negative shocks, except for Power Supply, the null hypothesis is rejected. In the long run direct and inverse effects of the influencing factors on electric power demand are asymmetry.
Test for Structural Stability
Structural fluctuation leading to any form of truncation or discontinuous change in the adopted time series was checked. The CUSUM of square test shows that there is no digression away from the 5% significance level boundary, indicating that the adopted time series did not experience structural break during the period under study. The Chow breakpoint statistics value of 1.254084 is insignificant. This shows that we cannot reject the null, because at all points in the time series, there is no break.
Diagnostic Checks
The F statistics of the Breusch–Godfrey test is significant at 5%. The null hypothesis for presence of autocorrelation is rejected, hence the estimated parameters in the model are optimal and underscores good inference. The coefficient of square of the fitted Ramsey RESET is 0.149591 with an insignificant probability value of 0.8561. The estimated model is free of non-linearity.
Toda-Yamamoto Granger Causality Test
Regardless of the fact that adopted series are stationary at different levels, the presence of non-stationarity does not diminish the validity of the causality estimates.
Table 5: Toda-Yamamoto Granger Causality Test Results
| Model | d | Null | Wald – Statistics | Probability |
| 1 | 2 | ECN does not cause APR E | 0.186931 | 0.9108 |
| 2 | APR E does not cause ECN | 3.104745 | 0.2117 | |
| 2 | ECN does not cause E ACCESS | 0.630227 | 0.7297 | |
| 2 | EACCESS does not cause ECN | 0.082389 | 0.9596 | |
| 2 | ECN does not cause MAN | 3.625944 | 0.1632 | |
| 2 | MAN does not cause ECN | 1.347065 | 0.5099 | |
| 2 | ECN does not cause PSUPPLY | 2.314110 | 0.3144 | |
| 2 | PSUPPLY does not cause ECN | 3.109819 | 0.2112 | |
| 2 | ECN does not cause POPGRWTH | 5.978600** | 0.0503 | |
| 2 | POPGRWTH does not cause ECN | 1.9960 | 0.3686 | |
| 2 | 2 | APRE does not cause EACCESS | 15.76150*** | 0.0004 |
| 2 | EACCESS does not cause APRE | 0.877826 | 0.6447 | |
| 2 | APRE does not cause MAN | 8.713646** | 0.0128 | |
| 2 | MAN does not cause APRE | 5.183483* | 0.0749 | |
| 2 | APRE does not cause PSUPPLY | 4.137776 | 0.1263 | |
| 2 | PSUPPLY does not cause APRE | 8.926155** | 0.0115 | |
| 2 | APRE does not cause POP GRWTH | 4.386434 | 0.1116 | |
| 2 | POP GRWTH does not cause APRE | 2.751415 | 0.2527 | |
| 3 | 2 | MAN does not cause EACCESS | 8.892028** | 0.0117 |
| 2 | E ACCESS does not cause MAN | 1.101725 | 0.5765 | |
| 2 | MAN does not cause P SUPPLY | 2.565695 | 0.2772 | |
| 2 | P SUPPLY does not cause MAN | 6.671408** | 0.0356 | |
| 4 | 2 | MAN does not cause POP GRWTH | 13.72257*** | 0.0010 |
| 2 | POP GRWTH does not cause MAN | 2.196020 | 0.3335 | |
| 5 | 2 | P SUPPLY does not cause POP GRWTH | 5.680062** | 0.0504 |
| 2 | POP GRWTH does not cause P SUPPLY | 0.068348 | 0.9664 |
*** Significance at 1%
** Significance at 5%
* Significance at 10%
Source: Author’s computation, 2020
Out of all the variables, Electricity demand only granger cause’s population growth at 5% level of significance. However, the causality was uni-directional. There exist uni-directional causality from Average tariff of electricity to electricity access, and this is significant at 1%. A bi-directional causality exists between Average tariff of electricity and Manufacturing Industries. While a uni-directional causality from power supply to average price of electricity exist, population growth and average price of electricity does not granger cause each other. No causality is observed between electricity access and power supply, so also is for population growth and electricity access. Manufacturing industries shows uni-directional causality towards electricity access, at 5% level of significance. There also exists uni-directional causality from the former to population growth, however. Uni-directional causalities are observed from power supply to manufacturing industries and to population growth, respectively.
DISCUSSIONS
Findings
Decrease (negative shock) in the average price of electricity leads to increased electricity demand however, positive shock does not seem to decrease electricity demand. This translates that regardless of increased electricity tariff, it does not diminish electricity demand by the Nigerian citizens. Further, positive effect of manufacturing industries causes increase in electricity demand indicating that when the rate of industrial activities in Nigeria rises, demand and consumption of electric power by manufacturing plant and equipment increases. Negative shock, on the other hand, which imply reduction in industrial activities will cause electricity demand to reduce. Also, increased (positive shocks) electricity access and power supply are key variables that enhances increase in electricity demand. Their reduction (negative shocks) tends to reduce electricity demand. While the study noted equilibrium between demand for electric power and all factors that affects it, there exist asymmetry in the effects of the variables as their respective positive and negative influences are not the same on electricity demand. There is structural stability during the period of study.
Electricity demand causes population growth. Power supply spurs the growth of manufacturing industries in Nigeria and population growth, during the study period, as indicated in the Toda-Yamamoto granger Causality test result. Access to electricity and population growth are granger caused by manufacturing industries. There exists bi-directional causality between average price of electricity and manufacturing industries.
Comparison of Results
Shocks in average tariff of electricity do not cause its demand to reduce. This finding supports result of the study conducted by Ngutsav and Aor, (2014), which found that tariff charged on electric power was not a key factor influencing electric power demand given that consumers already acquire other sources of electric power at higher prices, compared to the current tariff that they pay. Kayode et. al., (2013), also found that increased tariff on electricity has positive effect on its consumption. Increase in number of manufacturing industries has the potentials to increase electricity demand while the negative shock does otherwise. Obinna, (2013), Ngustav and Aor, (2014), Karisma and Noor, (2016) and Ebere et. al., (2018), also establishes that as activities in the industrial sector increases, there follows a corresponding increase in demand and consumption of electric power by manufacturing plants. Increase in power supply tends to encourage higher electricity demand. This observation is in line with past studies, (Obinna, 2013; Ebere et. al., 2018; Kayode et. al., 2013; Obinna, 202013; Ngutsav and Aor, 2014; Glauco De Vita, and Hunt, 2005; Ngutsav and Aor, 2014). Across the literature, it is this study that brings it out that there is a difference between the positive and negative shocks emanating from variables affecting electricity demand. So also the absence of structural break in the series indicates that no upheaval or sudden occurrence causes a discontinuous change in trend of the adopted series during the period of study.
CONCLUSION
The study examines determinants of electricity demand in Nigeria, and note that growth in manufacturing industries, electricity access and prompt and adequate power supply which are key indicators of electricity demand in Nigeria, have long run effect on increased demand for electric power. As such, the indicators deserve long term policy preference. The fact that increased electricity tariff does not seem to diminish electricity demand could be as a result of the fact that consumers already acquire other sources of electric power at higher prices, compared to the current tariff that they pay.
Having established that electricity access enhances the demand for electricity and given that current Electricity Access is about 56.5% in Nigeria, with about half of its citizens across the country having no access to electricity from the national grid, the study recommends tenacious effort by the government towards improving the rate beyond the current state, so as to bring electricity to people irrespective of their location in the country. Government should place emphasis on areas such as electric power supply and access, rather than influencing prices/tariff being charged. When there is adequate power supply with majority of the people having access to it, adequate price to be charged will emerge from the interaction of demand and supply of electricity. Government policies targeted towards improving factors that enhances increased electricity demand should be seen and implemented as a long term development plan. This is because most of the influencing factors tend to yield effect over a long period of time. If implement on the short run basis, however, there might not be desired results.
REFERENCES
- Mehdi Abid & Rafaa Mraihi, 2015. “Energy Consumption and Industrial Production: Evidence from Tunisia at Both Aggregated and Disaggregated Levels,” Journal of the Knowledge Economy, Springer;Portland International Center for Management of Engineering and Technology (PICMET), vol. 6(4), pages 1123-1137, December
- Babatunde, A. M. & Enehe, J. E. (2011) “Determinants of household electricity demand in Nigeria.” Economic and Financial Review, Vol.49 No.2
- Adetunji, M.O., Adesinyan, I.O. and Sanusi, W.A. 2007. “Household Energy Consumption Pattern in Osogbo Local Government Area of Osun State.” Pakistan Journal of Social Sciences. 4 (1); 9 – 13.
- Ngutsav .A and Aor .R 2014. “Analysis of Determinants of Electricity Consumption in Nigeria.” The Nigerian Journal of Energy and Environmental Economics. Volume 6, Issue No 1
- Besanko, D. and Braeutigam, R., 2011. Microeconomics. 4th ed. New Jersey: John Wiley and Sons, Inc. ISBN 978-0-470-56358-8. 111 River Street, Hoboken NJ, USA.
- Boniface, O. A. and Chudi J. E. 2014. “The Negative Impact of High Electricity Tariff on Consumers/End-Users in Some Developing Countries.” IOSR Journal of Electrical and Electronics Engineering (IOSR-JEEE) e-ISSN: 2278-1676,p-ISSN: 2320-3331, Volume 9, Issue 3 Ver. III
- Ebere, C., Rufai, A.A., Okedina, I.M. and Afodu, O.J. 2018. “Determinants of Electricity Demand in Nigeria from 1970-2016. Error Correction Mechanism Approach.” Journal of Economics and Finance (IOSR-JEF). e- ISSN: 2321-5933, p-ISSN: 2321-5925. Volume 9, Issue 4.
- Electricity Demand in Nigeria, Nigerian Electricity Regulatory Commission, NERC. Plot 1387, Cadastral Zone A00, Central Business District, Abuja, F.C.T, Nigeria
- Glauco D., Klaus E. and Lester C.H. 2005. An Empirical Analysis of Energy Demand in Namibia. Surrey Energy Economics Centre (SEEC). Department of Economics SEEDS, University of Surrey. 110 ISSN 1749-8384
- Heltberg, R. 2005. Factors determining household fuel choice in Guatamala. Environment and Development Economics, 10, 337-361.
- Hosier, R.H. & Dowd, J. 1987. Household fuel choice in Zimbabwe: An empirical test of the Energy Ladder. Journal of Resources and Energy, 9, 347-361.
- Ibenegbu, G. 2018. Poor Power Supply in Nigeria: What is the Reason? Ask Legit. Retrieved 2018 from, https://www.naija.ng/1170127-poor-power-supply-nigeria-reason.html#1170127
- International Energy Outlook. Energy Information Administration Office of Integrated Analysis and Forecasting U.S. Department of Energy, Washington, DC 20585. June 2006
- JICA, February 2007. The Master Plan Study for Utilization of Solar Energy in the Federal Republic of Nigeria, Final Report, Volume 1, p. 3-20
- Johnson, O.A. 2019. Epileptic Electric Power Generation and Supply in Nigeria: Causes, Impact and Solution. Journal of Contemporary Research in Social Sciences ISSN: 2641-0249. Vol. 1, 73-81201.
- Kautsari, A.K, Ghozah, M. and Noor, I. 2016. Analysis of Electricity Consumption Behaviour: Case Study of Non Business and Business households in Malang City. International Journal of Social and Local Economic Governance. Vol 2, No 2, pp 168-176.
- Kayode, O., Benjamin, C., McLellan, I., Seiichi, O. and Tetsuo, T. 2018. Estimating Residential Electricity Consumption in Nigeria to Support Energy Transitions. Journal of Sustainability Volume 10, 1440; doi:103390/su10051440 www.
- Kayode, R., Akhavan, F.M. and Ford, A. 2013. Analysis of Household Energy Consumption in Nigeria. Being a paper presented in the Department of Environment and Architecture, School of Built, London South Bank University.
- Kowsari, R. and Hisham, Z. 2011. Three Dimensional energy profile: A Conceptual Framework for Assessing Household Energy Use. Elsevier Journals Ltd. Energy Policy 39, 7505–7517.
- Kroon B., Roy B. and Pieter B. 2011. The Energy Ladder: Theoretical Myth or Empirical Truth? Results from a meta-analysis. IVM Institute for Environmental Studies. VU University Amsterdam, De Boelelaan 1087 1081 HV AMSTERDAM. The Netherlands.
- Mankiw, N. Gregory. 2018. Principle of Microeconomics: 8th Edition. South Western Cengage Learning. 20, Channel Centre Street, Boston MA 02210, USA
- Masera, O.R. 2000. From linear fuel switching to multiple cooking strategies: A Critique and Alternative to the Energy Ladder Model. World Development Report, 28(12) 2083-2103.
- Masera, O.R., Barbara, D.S. and Daniell, M.K. 2000. From Linear Fuel Switching to Multiple Cooking Strategies: A Critique and Alternative to the Energy Ladder Model. Elsevier Journals Ltd. World Development Vol. 28, No. 12, pp. 2083-2103.
- Mawejje, J. and Mawejje, D.N. 2016). Electricity consumption and sectoral output in Uganda: An Empirical Investigation. Journal of Economic Structures, No 2
- Mekonnen, A. and Kohlin, G. 2009. Determinants of Household Fuel Choice in Major Cities in Ethiopia”. Working Paper in Economics, No 399. ISSN 1403-2473 (print), ISSN 1403-2465 (online). Department of Economics, School of Business, Economics and Law at University of Gothenburg Vasagatan 1, PO Box 640, SE 405 30 Göteborg, Sweden
- Mirza, B. and Kemp, R. 2011. Why the Rural Rich Remain Energy Poor. The Journal of Sustainable Development. Vol. 6, Iss. 1, Pp. 133–155
- Molem, C. S. and Ndifor, R.T. 2016. The Effect of Energy Consumption on Economic Growth in Cameroon. Asian Economic and Financial Review. Volume 6 pgs 510-521. ISSN (e): 2222-6737/ISSN(p): 2305-2147.
- Nigerian Power Sector: Opportunities and Challenges for Investment in 2016. Latham & Watkins Africa Practice. February 23, 2016 | Number 1930
- Ochayi, C. 2017. 80 million Nigerians lack access to electricity – World Bank. Vanguard. Retrieved 2017 from https://www.vanguardngr.com/2017/12/80-million-nigerians-lack-access-electricity-world-bank/
- Otsuka, A. 2015. Demand for Industrial and Commercial Electricity: Evidence from Japan. Journal of Economic Structures. ISSN 2193-2409, Springer, Heidelberg, Vol. 4, pp. 1-11
- Parkin, M. 2012. Microeconomics, Tenth Edition. Pearson Education, Inc. 501 Boylston Street, Suite 900, Boston, USA
- Reddy, A.K.N. and Reddy, B.S. 1994. Substitution of Energy Carriers for Cooking in the Metropolis of Bangalore. Elsevier Journals Ltd Energy for Sustainable Development. Volume 5, Issue 3.
- Shin, Y. and Yu, B. 2004. An ARDL Approach to an Analysis of Asymmetric Long-run Cointegrating Relationships. Mimeo: Leeds University Business School.
- Shin, Y., Yu, B. and Greenwood-Nimmo, M. 2014. Modelling Asymmetric Cointegration and Dynamic Multipliers in a Nonlinear ARDL Framework. In: Festchrift in Honour of Peter Schmidt: Econometric Methods and Applications, Horrace, W.C and R.C Sickles (Eds). Springer, NewYork, USA ISBN: 978-1-4899-8007-6 pp: 281-314
- Ubani, O. 2013. Determinants of the Dynamics of Electricity Consumption in Nigeria. Organization of the Petroleum Exporting Countries, OPEC Energy Review. John Wiley & Sons Ltd Publication, 9600 Garsington Road, Oxford OX4 2DQ, UK and 350 Main Street, Malden, MA 02148, USA
- Ugwoke, T., Christopher, K. and Paul O. 2016. Electricity Consumption and Industrial Production In Nigeria. Journal of Policy and Development Studies. Vol. 10, No. 2, ISSN: 157-9385
- Wen-Cheng Lu, 2016. Electricity Consumption and Economic Growth: Evidence from 17 Taiwanese Industries. Journal of Energy Sustainability. Volume 9, No 50; doi:10.3390/su9010050.
- Energypedia. 2020. Nigeria Energy Situation. Essays. Retrieved 2020 from https://energypedia.info/wiki/Nigeria Energy Situation