
Determinants of Vulnerability to Climate Change among Yam Farmers in Benue and Nasarawa States.
- Adejo, S. A.
- Amos, T. T.
- Awolala, D. O.
- 230-242
- Jul 29, 2024
- Agriculture
Determinants of Vulnerability to Climate Change among Yam Farmers in Benue and Nasarawa States.
1Adejo, S. A., 2Amos, T. T. and 2Awolala, D. O.
1Department of Agricultural Extension and Management, Federal College of Agriculture, Akure.
2Department of Agricultural and Resource Economics, Federal University of Technology, Akure.
DOI: https://doi.org/10.51244/IJRSI.2024.1107015
Received: 08 June 2024; Revised: 24 June 2024; Accepted: 26 June 2024; Published: 29 July 2024
ABSTRACT
The study examined the determinants of Vulnerability to Climate Change among yam farmers in Benue and Nasarawa States. The specific objectives were to determine the vulnerability status of yam farmers to Climate Change in the Study Area and examine the determinants of vulnerability of yam farmers to Climate Change in the study area. Primary data was utilized for the study. The vulnerability status of yam farmers was analyzed using the Principal Component Analysis (PCA) while the Ordinary least square Technique was used to analyzed the determinants of vulnerability in the study area.
The study found a CCHVI of 2.4836 for Benue State and -0.7150 for Nasarawa State. Farmers in Nasarawa state were more vulnerable because of a very low adaptive capacity compared to farmers in Benue State. Household size was the major determinant of vulnerability in Benue state with a coefficient of 0.0198 and positively statistically significant at 1% but in Nasarawa state, the major determinants of vulnerability were sex, level of Education and Years of Education with coefficients of -0.3176, -0.2419 and -0.0482 respectively all negatively statistically significant at 1%.
The study recommended the improvement of the adaptive capacity of yam farmers in Nasarawa state through the provision of support facilities such as consumer capital, good feeder roads and weather-based risk insurance and Improving the experience of farmers through climate education would be a great catalyst for reduction of vulnerability in the study area
Keywords: Vulnerability, Climate Change, determinants, adaptive capacity and principal component analysis
INTRODUCTION
1.1 Background Information
Yam as a staple food, occupies a strategic position in the diet of West Africans especially Nigerians. This assertion was further corroborated by Akinola, Oke, Adesiyan & Famuyini (2019) who stated that Yam holds an important position as food crop and industrial crop in the Nigerian Economy. It contributes over 200 dietary calories per capital daily for over 150 million people in West Africa and also acts as an important source of income for the people while its production is been dominated by small scale farmers (Baimey, 2006). Nigeria is the largest producer of yams, producing about 70-76% of world yam output (Akinola, Oke, Adesiyan and Famuyini, 2019). In 2004, the world yam output stood at 47 million metric tons of which 95% of this output is been accounted for by Africa. Nigeria accounted for 70% of the Africa’s 95% global yam output in 2004 (Food and Agricultural Organisation of the United Nations (FAO), 2006). Due to growing demand, Nigeria currently produces 31.5 million tons of yams annually.
The major effects of climate change on agriculture produce, according to Asante and Amuakwe-Mensha (2015), include changing rainfall patterns that cause reductions in agricultural production, food security, worsening water availability, decreasing fish resources in large lakes due to rising temperatures, and shifts in vector-borne diseases (IPCC, 2018). Furthermore, climate change-related sea level rise impacts low-lying coastal areas with large populations, increasing the likelihood of conflict over finite land and water resources. Many farmers in underdeveloped countries are vulnerable to the effects of climate change (Asante and Amuakwa-Mensah, 2015). Vulnerability refers to the characteristics of a person or a group of people, as well as their situation, that weakly or negatively influence their capacity to predict, cope with, resist, and recover from the effects of a natural disaster. This conceptualization of vulnerability pays attention to the role that social connections and supports play in buffering people, processes, and places when faced with exposure to natural hazards (Collins et al., 2017).
Policymakers, development planners, engineers, and researchers are all concerned about vulnerability assessment and climate change adaptation. Vulnerability assessments assist policymakers in identifying hotspots, allocating resources, and developing better adaptation plans. A vulnerability assessment is a type of risk assessment that takes into account both the biophysical and socioeconomic aspects of an environmental threat (Eriksen and Kelly, 2005; El-Zeina and Tonmoy, 2017).
The Intergovernmental Panel on Climate Change (IPCC) suggested a methodology for vulnerability assessment that encompasses exposure, sensitivity, and adaptive capability in order to reduce climate change impacts. The extent to which a socio-ecological system (SES) such as a community, region, or infrastructure system is exposed to the hazards in question is known as exposure (IPCC, 2014). The susceptibility to damage as a result of exposure is referred to as sensitivity, whereas adaptive capacity refers to the socio-ecological system’s ability to cope with and recover from the damage.
Although Nigeria is recognized as a major yam producer, Benue state situated in the Benue valley with alluvial fertile land is where most of the yams are cultivated (Shehu, Iortyer, Mshelia and Jonguy 2010; Benue State Agricultural and Rural Development Agency (BNARDA, 2015). However, BNARDA annual records of 2013, 2014 and 2015 revealed low yam output in the state as a result of climate change and vulnerability. This is because of poor knowledge of the effects of climate change and variability by farmers in the state (Nger, 2017).
Despite these assertions, the vulnerability status of yam farmers in Benue and Nassarawa states have not been critically examined. Nigeria’s Yam related researchers has focused on awareness, perception and adaptation to climate change; problems, prospects and challenges to yam production; and impact and effects of climate change, climate variability on yam production(Sunday and Nancy, 2021; Oluwatayo, 2016; Alagha, Nnadi and Uzor, 2021; Dada, Usman, Samaila and Ishaya, 2021; Bassey, 2017; Chidozie, 2017; Zakari, Muhamed, Medugu and Sandra, 2014; Okongor, Njoku, Essoka, Efiong, 2021; Olorunlana and Folasade, 2018). While state (Benue and Nasarawa) related climate studies on yam has focused on impact of climate variability (Uger, 2017; Yashim, 2019). There has been no yam specific study to explain the vulnerability status of yam farmers to climate change in Benue and Nasarawa states. hence, there is an urgent need to ascertain the vulnerability status of yam farmers to climate change in these study areas.
The specific objectives of this study are to: determine the vulnerability status of yam farmers to Climate Change in the Study Area; examine the determinants of vulnerability of yam farmers to Climate Change in the study area;
METHODOLOGY
Data for the study was collected from both primary and secondary sources. Primary data was collected through the use of a well-structured questionnaire to elicit data on the socio-economic characteristics of the yam farmers in the study area, as well as factors that predisposes these farmers to the deleterious effects of climate change and the adaptive strategies used to mitigate these changes. Secondary data on Yam production and climatic variables such as Rainfall, Sunshine, and Relative Humidity was sourced from both published and unpublished materials such as Benue Agricultural and Rural Development Agency(BNARDA), Nasarawa Agricultural Development Agency(NADP), Nigerian meteorological Agency, Makurdi(NIMET, Makurdi) and Nigerian meteorological Agency, Lafia(NIMET, Lafia).
2.1 Sample and Sampling Technique
A multi stage sampling procedure will be used for this study.
- The first stage was the purposive selection of one agro ecological zone each from the two states. This selection was based on the level of yam production within the various agro ecological zone.
- The second stage was a purposive selection of two Local Government Areas each from the total Local Government Areas within the agro ecological zone based on the level of yam production.
- The third stage was a random selection of four communities each from the four Local Government Areas. This will bring the total number of communities to sixteen.
- The last stage was a random selection of twenty-three farming households from each community. This brought the total number of respondents to Three hundred and sixty-eight but only three hundred and sixty questionnaires were accounted for.
2.2 Principal Component Analysis
The common methods for analyzing vulnerability to climate change are the econometric and indicator methods. For the purpose of this research, the indicator method was adopted because of its vast applications. This method involves the selection of indicators from a set of metrics (exposure, sensitivity and adaptive capacity metrics) and construction of composite indices.
The selection and standardization of indicators was based on literature for constructing household indices. Standardization was necessary because of the different units of the indicators selected (Ezemonye and Emeribe 2012). For the indicators that are positively related to vulnerability to climate change, the formula will be given as:
![]() …………………………………………….. (1)
…………………………………………….. (1)
For indicators negatively related to vulnerability to climate change:
![]() ……………………………………………… (2)
……………………………………………… (2)
Where Aij = denote the ith vulnerability indicator in the jth metric set. From the matrix of standardised values, the composite vulnerability index is constructed as
Vulnerability Index = {Adaptive capacity – (Sensitivity – Exposure)} …………… (3)
This is further expressed as:
![]() ………………………………………………..………………….. (4)
………………………………………………..………………….. (4)
Where Vindex is the vulnerability index, X variables are adaptive capacity metrics, and Y variables are exposure and sensitivity metrics.
Next will be to assign weight to the normalized indicators and Principal Component Analysis (PCA) was used for this purpose. Principal Component technique is a multivariate technique for finding patterns in data of high dimension.
2.3 Determination of Weight Indices
Following Awolala, Ajibefun, Ogunjobi and Miao (2021), the Iyengar and Sudarshan’s statistical method of weighting and aggregation to compute a composite vulnerability index was used.
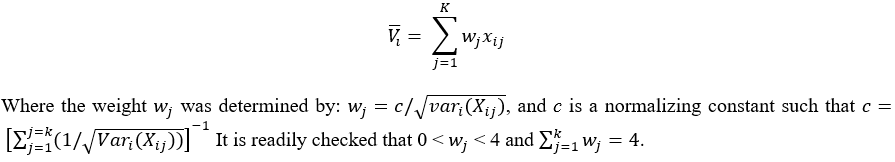
The standardized index score lies between 0 and 4. This weighted average technique was used to assign heavier weights to those indicators contributing the greater amount of variance. It is assumed that there are M states, K indicators of vulnerability and xij,i=1.2,…,M;=1,2,…,K are the normalized scores. The level of vulnerability of the ith states, Vi ̅ is assumed to be a linear sum of xij as:
This approach of selecting weights ensures that large variation in any of the indicators did not unduly dominate the contribution of the rest of the indicators and distort interregional comparisons. The vulnerability index was determined such that it lies between 0 and 4, with 4 representing highest resilience and less than 1 corresponding to least resilience (Briguglio, 2003). For classificatory purpose of characterizing the different stages of vulnerability, a fractile classification of the States from an assumed probability distribution is needed based on the indices constructed.
2.4 Ordinary Least Square Regression Analysis
After the individual vulnerability indices are constructed, determinants of vulnerability were analysed using the Ordinary Least Squares Regression technique. However, considering that the indices generated from PCA may mix positive-negative variables, a log-module transformation will be used to handle the negative values before subjecting them to ordinary least square regression analysis and this idea followed (Gbetibouo and Ringler, 2009).
Vulnerability function is specified implicitly as follows:
![]() ……………………………………………………………..(7)
……………………………………………………………..(7)
Where Vindex= vulnerability index of each farmer.
Xi = explanatory variables which include: Sex (1 for male, 0 if female), farm size (Ha), amount saved (naira), amount of credit received (naira), extension contact (1 for access, 0 if otherwise), household expenditure (naira), value of crop output (naira), level of education (years), age of household head (years), cooperative membership (1 for membership, 0 if otherwise), household size (numbers), and fragmentation (Number fragmented land owned by each respondent), non-farm income (Naira), land ownership statues (1= permanent ownership, 0 = rent only), location of farm category A(1for dryland,, 0 if otherwise)
RESULT AND DISCUSSION
3.1 Socio economic Characteristics of Respondent
The distribution of Respondents according to age of farmers in Benue shows that majority (80.57%) of respondents are within their active productive age in Benue State with a mean of 51.83 years and Standard deviation of 11.99 years while majority (64.23%) of respondents in Nasarawa State are also within their active productive age with a mean age of 56.86 years and a standard deviation 11.98 years. This finding agrees with Ariyo et al (2020) who opined that yam farming requires energy and hence farmers should be within their active age for active production for revenue as well as Odinwa et al (2019) who asserted that yam production is for farmers within the middle age because of energy requirement for yam production.
The result equally reveals a low participation of the youth in Benue and Nasarawa state which should not be unconnected to the migration of youth to urban centers due to the fact that been educated places them in an advantaged position to secure white collar jobs and hence tends to evade drudgery associated with farming and Yam production in general.
The result reveals a Majority (94.44%) of respondents in Benue State with a farming experience of more than 11years with a mean of 31.39years which shows a high experience level. Similarly, in Nasarawa state, majority (99.44%) of the respondents possess farming experience of more than 10years and a mean of 41.68years. This implies that the respondents are well experienced in farming and hence they will be exposed to good knowledge on indigenous mitigation strategies against adverse effect of climate change, variations. This finding agrees with Thompson and Amos (2010) who noted that experience gotten from first hand is better than theory studied in schools, seminars and Autio et al. (2021), who emphasized that, experience is critical in the adoption of indigenous mitigation strategies. The pooled data of farmers in both Benue and Nasarawa state reveals that majority (93.88%) of the farmers have farming experience of more than 10years with a mean of 36.49years and a standard deviation of 14.48years.
Majority (85.56%) in Benue State are literate while their contemporaries in Nasarawa state are 87.78% equally literate. This implies that farmers in Nasarawa state are more literate and will be more receptive to adopting mitigation strategies against climate change as well as understanding various innovations to mitigate these changes. Since the respondents are educated, they will be better prepared to overcome shocks associated with the deleterious effects of climate change on yam production in the study area. This finding is in support of Anabaraonye et al. (2018) who quoted UNESCO, (2010) revealed that education is a crucial aspect of global response to climate change. He noted that It helps educated people to grasp, understand and address the impact of global warming as well as encourage changes in their attitudes and behaviors while helping them adapt to climate change related trends. The pooled data equally reveals a literacy level of 88.78% among respondents implying probability of fast adaptation and mitigation of shock associated with climate change, and variations.
Table1: Socio economic Characteristics of Respondent
| Benue State | Nasarawa State | Pooled | ||||
| Age | Frequency | Percentage | Frequency | Percentage | Frequency | Percentage |
| ≤ 30 | 2 | 1.1 | 4 | 2.22 | 6 | 1.66 |
| 31-40 | 34 | 18.91 | 22 | 12.23 | 56 | 15.57 |
| 41-50 | 65 | 36.1 | 42 | 23.32 | 107 | 29.71 |
| 51-60 | 44 | 24.46 | 48 | 26.66 | 92 | 25.56 |
| ≥ 61 | 35 | 19.46 | 64 | 35.54 | 99 | 27.50 |
| Total | 180 | 100 | 180 | 100 | 360 | 100 |
| Mean | 51.83 | 56.86 | 54.33 | |||
| Std Dev | 11.99 | 11.98 | 12.24 | |||
| Farming Experience | ||||||
| ≤ 10 | 10 | 5.56 | 1 | 0.56 | 11 | 6.12 |
| 11-20 | 31 | 17.22 | 13 | 7.22 | 44 | 24.44 |
| 21-30 | 55 | 30.56 | 30 | 16.66 | 85 | 47.22 |
| 31-40 | 43 | 23.9 | 48 | 26.66 | 91 | 50.56 |
| ≥ 41 | 41 | 22.81 | 88 | 48.86 | 129 | 71.67 |
| Mean | 31.39 | 41.68 | 36.49 | |||
| Std Dev. | 13.86 | 13.09 | 14.48 | |||
| Level of Education | ||||||
| No formal Education | 26 | 14.44 | 18 | 10.00 | 44 | 12.22 |
| Primary Education | 51 | 28.33 | 49 | 27.22 | 100 | 27.78 |
| Secondary Education | 76 | 42.22 | 73 | 40.56 | 149 | 41.39 |
| Tertiary Education | 27 | 15.00 | 40 | 22.22 | 67 | 18.67 |
Source: Field Survey 2023
3.2 Vulnerability Analysis of Yam Farmers in the Study Area
3.2.1 Extraction of Component Matrix for Vulnerability Indices of Benue State
The result of the principal components shows(pc) the level of variations for Benue State is presented in table 2. The result reveals 14 components having a minimum Eigenvalue of 1 and above which is widely used as the cut off point for the principal components to be retained. These Pcs account for more variations in the components than any of these variables in standardized data.
The proportions of the principal components show the extent of variation that can be accounted for by each principal component. The components with eigenvalue of 1 and above accounted for 77.16% of variations or distortions experienced by the indicators.
Table 2: Extracted Components for Benue State
| Component | Eigenvalue | Difference | Proportion | Cumulative |
| Comp1 | 7.54453 | 3.52314 | 0.1796 | 0.1796 |
| Comp2 | 4.02139 | 1.12038 | 0.0957 | 0.2754 |
| Comp3 | 2.90101 | 0.261286 | 0.0691 | 0.3445 |
| Comp4 | 2.63972 | 0.352966 | 0.0629 | 0.4073 |
| Comp5 | 2.28676 | 0.116552 | 0.0544 | 0.4617 |
| Comp6 | 2.17021 | 0.188699 | 0.0517 | 0.5134 |
| Comp7 | 1.98151 | 0.0702918 | 0.0472 | 0.5606 |
| Comp8 | 1.91122 | 0.506615 | 0.0455 | 0.6061 |
| Comp9 | 1.4046 | 0.17165 | 0.0334 | 0.6395 |
| Comp10 | 1.23295 | 0.064536 | 0.0294 | 0.6689 |
| Comp11 | 1.16841 | 0.0435574 | 0.0278 | 0.6967 |
| Comp12 | 1.12486 | 0.105423 | 0.0268 | 0.7235 |
| Comp13 | 1.01943 | 0.0186713 | 0.0243 | 0.7478 |
| Comp14 | 1.00076 | 0.0889841 | 0.0238 | 0.7716 |
Source: Authors Computation 2022
The first component with an eigenvalue of 7.54 accounts for 17.96% variations in the samples. The component loading highest on Adaptive capacity of respondents in the study area. This is evident in the availability of insecticides and pesticides with a factor loading of 3056 and availability of electricity with a factor loading of 0.3142. Hence, since it accounts for the highest variations in the principal components, it is been adopted for this study.
Similarly, component two, has an eigenvalue of 4.02 but could account for only 9.57% of the explanation of the principal component. Cumulatively, component 1 and 2 accounts for 27.54% variations in the principal component and hence can be considered as major indicators for the vulnerability to climate change among farmers in Benue State.
3.3 Extraction of Component Matrix for Vulnerability Indices of Nasarawa State
The result of the principal components (PC) shows the level of variations for Nasarawa State is presented in table 3. It shows that 12 principal components possess either 1 eigenvalue or above. which is widely used as the cutoff point for the principal components to be retained. These PCs account for more variations in the components than any of these variables in standardized data.
The proportions of the principal components show the extent of variation that can be accounted for by each principal component. The components with eigenvalue of 1 and above accounted for 70.90% of variations or distortions experienced by the indicators.
The first component with an eigenvalue of 9.3774 accounts for 22.87% of variations in the vulnerability indicators under consideration. The highest component loadings are on the exposure components. Climate induced disease (0.2908), Drought induced disease (0.2845), Occurrence of storms (0.2844) and occurrence of drought (0.2687). All the sensitivity indicators under consideration displayed high level of sensitivity with negative indices such as high sun intensity (-0.2294), High temperature (-0.2331) and Frequent rainfall (-0.2552).
Similarly, component 2 had an eigenvalue of 3.2037 and a proportion of 7.81% of the total variation for all principal components generated. Cumulatively, component 1, 2, 3 4 and 5 accounts for 46.76% variations in the principal components and hence, indicators for the vulnerability to climate change among farmers in Nasarawa State.
Table 3: Extracted Components for Nasarawa State
| Component | Eigenvalue | Difference | Proportion | Cumulative |
| Comp1 | 9.37747 | 6.17374 | 0.2287 | 0.2287 |
| Comp2 | 3.20374 | 0.778096 | 0.0781 | 0.3069 |
| Comp3 | 2.42564 | 0.302996 | 0.0592 | 0.366 |
| Comp4 | 2.12264 | 0.0803096 | 0.0518 | 0.4178 |
| Comp5 | 2.04233 | 0.206011 | 0.0498 | 0.4676 |
| Comp6 | 1.83632 | 0.154086 | 0.0448 | 0.5124 |
| Comp7 | 1.68224 | 0.170137 | 0.041 | 0.5534 |
| Comp8 | 1.5121 | 0.160056 | 0.0369 | 0.5903 |
| Comp9 | 1.35204 | 0.0515014 | 0.033 | 0.6233 |
| Comp10 | 1.30054 | 0.160188 | 0.0317 | 0.655 |
| Comp11 | 1.14036 | 0.0678241 | 0.0278 | 0.6828 |
| Comp12 | 1.07253 | 0.0913386 | 0.0262 | 0.709 |
3.4 Weight of Vulnerability Indicators
The result of the computed weight for vulnerability indicators for the study area is presented in Table 4. These sensitivity indicators comprise of Climatic variables which shows the degree to which yam production can be affected positively or negatively due to imbalance in its supply above or below a particular threshold as could be seen with these variables displaying negative weight in Nasarawa state compared to the sensitivity indicators of Benue state. This indicates a very serious negative effects of the listed variable making the farmers very sensitive to the deleterious effect of these climatic variable unlike in Benue state which presented very sensitive figures but not like those experienced by farmers is Nasarawa State. These could be interpreted to mean farmers in Nasarawa state displays more susceptibility to these sensitivity indicators than those of Benue State.
The exposure components display the likelihood of damage due to exposure to hazards. Indicators such as Farming of yam as a major occupation and unauthorized refuse dumps, occurrence of drought and occurrence of deforestation shows to susceptibility to the exposure components in Benue state while percentage of farmers living in mud buildings, yam as a major occupation and occurrence of deforestation displays susceptibility to exposure in Nasarawa State. Farmers in Benue state with an exposure weight of 0.4487 are more exposed to hazards compared to farmers from Nasarawa state with a weight of 1.7248.
The indicators revealed a higher resilience index of 3.3338 for Benue State compared to Nasarawa state with an adaptive capacity index of 1.1423. Adaptive capacity is the economic and social capital of an individual or community that helps them absorb shock from the exposure and sensitivity indicators of vulnerability. This implies an inverse relationship with vulnerability. Therefore, a higher adaptive capacity of Benue state yam farmers implies greater resilience and ability to absorb shock from climatic hazards.
Table 4: Computed Weight for Climatic Vulnerability Indicators for the Study Area
| Sensitivity | Benue | Nasarawa |
| High Sun Intensity | 0.1165 | -0.2294 |
| High temperature | 0.1675 | -0.2331 |
| Frequent rainfall | 0.1175 | -0.2552 |
| Total | 0.4015 | -0.7177 |
| Exposure | ||
| Occurrence of drought | 0.0969 | 0.2687 |
| Occurrence of flooding | 0.1133 | 0.275 |
| Occurrence of storms | 0.1354 | 0.2844 |
| Climate induced disease | 0.0206 | 0.2908 |
| Drought induced disease | 0.1208 | 0.2845 |
| Proximity to flooding source | 0.0234 | 0.2716 |
| Occurrence of deforestation | 0.0077 | 0.0147 |
| Unauthorized refuse dump | -0.0023 | 0.2669 |
| % living in Thatch and Mud building | 0.1101 | -0.1646 |
| Household size of respondents | 0.003 | 0.0309 |
| Yam farming as major occupation | -0.1802 | -0.0981 |
| Total | 0.4487 | 1.7248 |
| Adaptive Capacity | ||
| Level of Education | 0.2129 | 0.0796 |
| Marital Status | -0.024 | -0.0161 |
| Access to Health facilities | 0.2311 | 0.1416 |
| Access to Portable water availability | 0.0755 | 0.1275 |
| Access to Agro training centres | 0.0718 | 0.0275 |
| Distance to Energy supply | 0.3108 | 0.0344 |
| Distance to Market within 1km | 0.262 | 0.1136 |
| Access to veterinary services within 1km | 0.1945 | 0.0509 |
| Distance to Police station within 1km | 0.2486 | 0.1178 |
| Access to Public transportation | 0.0753 | -0.0217 |
| Distance to Irrigation source within 1km | -0.0216 | -0.098 |
| Distance to Flooding source within 1km | 0.0515 | 0.0631 |
| Availability to Insecticide and Pesticides | 0.3056 | 0.1814 |
| Distance to improved seedlings within 1km | 0.286 | 0.1583 |
| Distance to Fertilizer supply within 1km | 0.2989 | 0.1121 |
| Distance to Weather forecasting facility within 1km | 0.0515 | -0.1497 |
| Availability of electricity | 0.3142 | 0.1244 |
| Availability of motorable roads | 0.1645 | 0.0691 |
| Availability of Mobile phones | 0.05 | 0.0268 |
| Availability of internet services | 0.2196 | -0.0636 |
| Availability of radio services | 0.0577 | -0.0518 |
| Availability of weather forecasting facility | -0.0173 | -0.0696 |
| Availability of income Diversification sources | 0.0516 | 0.1983 |
| Availability of irrigation facility | 0.0276 | -0.0035 |
| Availability of input subsidy supply source | -0.0177 | 0.0304 |
| Availability of extension services | -0.0185 | 0.0658 |
| availability of climate change information | -0.0154 | 0.0771 |
| Practice of animal rearing | -0.0874 | -0.0135 |
| Practice of cash cropping | -0.0255 | -0.1699 |
| Total | 3.3338 | 1.1423 |
Source: Authors Computation 2022
3.5 Composite Climatic Hazard of Vulnerability Indices (CCHVI) in the Study Area
The result of composite climatic Hazard vulnerability indices (CCHVI) of the study in Table 21 reveal a sensitivity of 0.4015 for Benue State and -0.7177 for Nasarawa state. This indicates that yam farmers in Nasarawa State are more sensitive to climate change than yam farmers in Benue State. It further reveals that yam farmers in Benue are more exposed with an exposure index of 0.4487 than yam farmers in Nasarawa with index of 1.7248. This is made evident in a high index of Adaptive capacity of 3.3338 for yam farmers in Benue compared to yam farmers in Nasarawa with an adaptive capacity of 1.1423. As shown by the result, the high adaptive capacity of yam farmers in Benue has helped to cushion the extent of their exposure to climate change though Nasarawa state possess more erratic climatic variables. It is revealed from this study that Yam farmers in Nasarawa State are more vulnerable to climate change with a CCHVI of -0.7150 than yam farmers in Benue state with a CCHVI of 2.4836.
Table 5: Result of Composite Climatic Hazard of Vulnerability Indices (CCHVI) of the Study Area
| State | Sensitivity Index | Exposure Index | Adaptive Capacity Index | Vulnerability Index | Degree of Vulnerability |
| Benue | 0.4015 | 0.4487 | 3.3338 | 2.4836 | Less Vulnerable |
| Nasarawa | -0.7177 | 1.7248 | 1.1423 | -0.7150 | More Vulnerable |
| Pooled | -0.3162 | 2.1735 | 4.4761 | 1.7686 | Vulnerable |
Source: Authors Computation 2023
3.6 Determinants of Vulnerability in the Study Area
The result of the determinants of Vulnerability for Benue and Nasarawa state is presented in table 6. The result reveals that Age and Household Size have a positive relationship with vulnerability in both Benue and Nasarawa state. This implies that an increase in age by 1year leads to an increase in vulnerability by 0.0051 in Benue state and 0.0023 in Nasarawa state although this is not statistically significant in both states. Therefore, this can also be interpreted to mean older people are more vulnerable to climate change in the study area. Also, it implies that an increase in household size by 1 person leads to 0.0198 and 1.07 increase in vulnerability in Benue and Nasarawa states respectively but only that of Benue state is statistically significant at 1%. This is due to the fact that large household with major source of income as Yam farming will be more exposed to climate change because their major source of livelihood is been affected. This affects their disposable income and hence, render them vulnerable.
It further reveals that Sex and Marital status all have negative relationship with Vulnerability in both Benue and Nasarawa State, except Marital Status which is positive in Nasarawa State. It reveals that females are more susceptible to climate change than males in both Benue and Nasarawa states. This could be due to the fact that women face more cultural norms or barriers and responsibilities that could predispose them to these hazards. Women are burdened with responsibilities of household energy, food, water and even care for the young and elderly therefore their adaptive capacity could be greatly reduced predisposing them to vulnerability. This is in agreement with Adeoti et al. (2016) who analysed vulnerability, perception and adaptation to climate change in kwara state, Nigeria using the fuzzy approach and noted that females are more vulnerable to climate change.
Years of Farming experience has been found to exhibit a negative relationship with vulnerability. An increase in farming experience by 1year leads to -0.0027 and -0. 0002 reduction in the level of vulnerability to climate change although not statistically significant. This implies that as farmers continue to gain experience in farming generally, they begin to adopt adaptation practices been practiced in the cultivation of other crops and apply them to Yam production. Sometimes farmers develop such indigenous adaptation strategies out of experience generally gained in the course of farming. Similarly, Years of Yam farming experience has also been found to possess a negative relationship with vulnerability with coefficients of -0.0051 and -0.0038 for Benue and Nasarawa states respectively although not statistically significant. This implies that a unit increase in years of farming experience results in adoption of adaptation strategies such as Different Planting Dates (DPD), Mulching, Use of Alternative Fallow method (UAF) and Mulching. This is because experience gained increases precision and knowledge on subject matter hence gives room for improvements in challenges such as adoption of climate change mitigation strategies to ameliorate the situation. This is in agreement with Jamshidi et al. (2019) who noted that job experience among other factors affects level of vulnerability.
It further reveals that a unit increase in level of education leads to 0.0007 and 0.2419 decrease in vulnerability for Benue and Nasarawa states respectively although only that of Nasarawa state is statistically significant at 1%. Similarly, a unit increase in the years of education leads to 0.0001 and 0.0482 decrease in Vulnerability to Climate change in Benue and Nasarawa states respectively but only that of Nasarawa state was statistically significant at 1%. This further buttress the fact that education reduces vulnerability because it makes farmers to be aware of the effect of climate change and the various adaptation strategies that can be employed to ameliorate the situation. This is in agreement with Elijah et al (2020) in his study of Yam farmers adaptation strategies towards climate change disaster in Cross River state, Nigeria who noted that education creates awareness among farmers on climate change which necessitates farmers to adopt climate change adaption strategies.
Table 6: Result of Determinants of Vulnerability of Respondents
| Benue State | Nasarawa State | |||||
| Vulnerability | Coefficient | t | P>t | Coefficient | t | P>t |
| Age | 0.0051 | 0.91 | 0.371 | 0.0023 | 0.50 | 0.620 |
| Sex | -0.0772 | -0.53 | 0.60 | -0.3176 | -2.34*** | 0.025 |
| Years of farming Experience | -0.0027 | -0.35 | 0.728 | -0.0002 | -0.05 | 0.960 |
| Years of farming Yam | -0.0051 | -0.69 | 0.498 | -0.0038 | -1.70 | 0.100 |
| Marital Status | -0.0563 | -0.45 | 0.652 | 0.0343 | 0.30 | 0.768 |
| Level of Education | -0.0007 | -0.02 | 0.986 | -0.2419 | -2.81*** | 0.008 |
| Years of Education | -0.0001 | -0.01 | 0.995 | -0.0482 | -3.81*** | 0.001 |
| Household Size | 0.0198 | 2.43*** | 0.021 | 0.0134 | 1.07 | 0.294 |
| Constant | 0.1110 | 0.27 | 0.786 | 0.1098 | 0.28 | 0.782 |
| R Square | 0.2361 | 0.4448 | ||||
| Adjusted R Square | 0.0509 | 0.306 | ||||
| Root MSE | 0.1158 | 0.1195 | ||||
*, ** and *** for 10%, 5% and 1% respectively
Source: Field Survey, 2023
CONCLUSION
The result concluded that majority of farmers are male, married and within an active age. Yam farmers in Benue state have higher adaptive capacity compared to yam farmers in Nasarawa state hence they are less vulnerable compared to yam farmers in Nasarawa state but farmers in the study area are all vulnerable to climate change while education is a strategic determinant for vulnerability. Larger household were more vulnerable to Climate Change to climate change in Benue State.
RECOMMENDATION
The State government should invest in weather forecasting facilities in the various local government areas so that accurate climatic variables for the various communities can be known forecasted and provided to farmers to mitigate poor production due to lack of information on climate.
Improving the experience of farmers through climate education would be a great catalyst for reduction of vulnerability in Nasarawa State While farmers are encourage to have a moderate household size that can support farm labour without increasing susceptibility to vulnerability in Benue State. Effort from Governments, Extension agents and Agriculturally based NGO’s should be geared toward training and retraining of farmers on forecasted climatic conditions for the year especially at the unset of the planting seasons.
REFERENCES
- Adeoti, A., Coster, A and Akanni, T. A. (2016) Analysis of farmers’ Vulnerability, Perception and Adaptation to Climate Change in Kwara state, Nigeria. International Journal of Climate Research. vol. 1, no. 1, pp. 1-16
- Akinola, A. A., Oke, J. T. O., Adesiyan, A. T., and Famuyini, C. A. (2019). Climate change and economic efficiency of yam farmers in Ekiti State, Nigeria.
- Asante, F. A., and Amuakwa, M. F. (2014). Climate change and variability in Ghana: Stocktaking. Climate, 3(1), 78-101.
- Autio, A., Johansson, T., Motaroki, L., Minoia, P., and Pellikka, P. (2021). Constraints for adopting climate-smart agricultural practices among smallholder farmers in Southeast Kenya. Agricultural Systems, 194, 103284.
- Awolala, D. O., Ajibefun, I. A., Ogunjobi, K., and Miao, R. (2022). Integrated assessment of human vulnerability to extreme climate hazards: emerging outcomes for adaptation finance allocation in Southwest Nigeria. Climate and Development, 14(2), 166-183.
- Baimey, H., Coyne, D., and Labuschagne, N. (2006). Effect of fertiliser application on yam nematode (Scutellonema bradys) multiplication and consequent damage to yam (Dioscorea spp.) under field and storage conditions in Benin. International Journal of Pest Management, 52(1), 63-70.
- Bassey, E. E. (2017). Constraints and prospects of yam production in Nigeria. Eur. J. Phys. Agric. Sci., 5(1): 55-64
- Benue State Agricultural and Rural Development Agency (2015). Annual yam data: Benue state rural development agency. Makurdi: Ministry of Agriculture. BNARDA
- Briguglio, L., and Galea, W. (2003). Updating and augmenting the economic vulnerability index.
- Chidozie, U. (2017). Climate Change and Adaptation by Yam Farmers in Anambra West Local Government Area in Anambra State, Nigeria, British Journal of Research, 04(1) 2394-3718
- Collins, J., Ersing, R., Polen, A., Saunders, M., and Senkbeil, J. (2018). The effects of social connections on evacuation decision making during Hurricane Irma. Weather, climate, and society, 10(3), 459-469.
- Dada, I., Mustapha, A., Ishaya, S. K. and Magaji, J. I. (2021). Assessment of Vulnerability of Croplands to Climate Variability in Federal Capital Territory (FCT) Abuja, Nigeria. Journal of Geography, Environment and Earth Science International, 25(2) 12-39
- Elijah S. l. T., Osuafor, O. O. and Anarah, S. E. (2018). Effects of climate change on yam production in Cross River State, Nigeria. International Journal of Agriculture and Forestry, 8(2), 104-111.
- Eriksen, S. H., Brown, K., and Kelly, P. M. (2005). The dynamics of vulnerability: locating coping strategies in Kenya and Tanzania. The Geographical Journal, 171(4):287-305.
- Ezemonye, M. N., and Emeribe, C. N. (2012). Rainfall erosivity in southeastern Nigeria. Ethiopian Journal of Environmental Studies and Management, 5(2), 112-122.
- Gbetibouo, G. A. (2009). Understanding farmers’ perceptions and adaptations to climate change and variability: The case of the Limpopo Basin, South Africa (Vol. 849). Intl Food Policy Res
- IPCC (Intergovernmental Panel on Climate Change), (2001). Technical summary: climate change 2001: impacts, adaptation, and vulnerability. A Report of Working Group II of the Intergovernmental Panel on Climate Change.
- Jamshidi, O., Asadi, A., Kalantari, K., Azadi, H., and Scheffran, J. (2019). Vulnerability to climate change of smallholder farmers in the Hamadan province, Iran. Climate Risk Management, 23, 146-159.
- Okongor, G., Njoku, C., Essoka, P., and Efiong, J. (2021). Climate Variability and Yam Production: Nexus and Projections. Sarhad Journal of Agriculture, 37(230).
- Olorunlana, F. A. (2018). Impact of climate change on yam production in Emure-ekiti, Ekiti state, Nigeria. Journal of Academia, 3(2)1-17
- Oluwatayo, B and Ojo, O. A (2016) Awareness and adaptation to climate Change among yam-based farmers in Rural Oyo state, Nigeria. The journal of developing Areas, 50(2) 97-108
- Shehu, J. F., Iyortyer, J. T., Mshelia, S. I., and Jongur, A. A. U. (2010). Determinants of yam production and technical efficiency among yam farmers in Benue State, Nigeria. Journal of social sciences, 24(2), 143-148.
- Thompson, O. A., and Amos, T. T. (2010). Climate change and food security in Nigeria. Journal of Meteorological and Climate Science, 8(2).
- Uger, F. I. (2017). Impact of climate variability on yam production in Benue State: An empirical analysis. International Journal of Innovative Research in Social Sciences and Strategic Management Techniques, 4(2), 2467-8155.
- Zakari, D. M., Mohammed, A. B., Medugu, N. I., and Sandra, I. (2014). Impact of climate change on yam production in Abuja, Nigeria. International Journal of Science, Environment and Technology, 3(2), 458-472.