
Does Firm Size Moderate the Effect of Leverage on Performance of Firms in Ghana: A Dynamic Panel Estimation Approach
- Michael Kwakye
- Edward Domina Attafuah
- 245-265
- Apr 6, 2024
- Business Management
Does Firm Size Moderate the Effect of Leverage on Performance of Firms in Ghana: A Dynamic Panel Estimation Approach
1Michael Kwakye, CA, PhD Student, 2Edward Domina Attafuah, (PhD)
1Universidad Empresarial de Costa Rica, Senior Tutor- University of Cape Coast, Code – Zenith Campus, Accra
2Accountant, University Health Service, University for Development Studies, Senior Tutor- New Life College
DOI: https://doi.org/10.51244/IJRSI.2024.1103019
Received: 09 February 2024; Revised: 25 February 2024; Accepted: 29 February 2024; Published: 06 April 2024
ABSTRACT
Leverage has been argued to be a crucial factor in determining profitability, and a number of studies have looked at its direct impact on firm performance, but the conclusions have been equivocal and contested. Using a dynamic panel model, the study attempted to contribute to the growing literature by first examining the impact of leverage on firm performance in Ghana, as well as the moderating function of firm size. The objectives that guided the study were the effect of leverage on firm performance and how firm size moderates the effect of leverage on firm performance. The study’s data came from listed companies. The study’s sample consisted of all the companies listed on the Ghana stock exchange with particular focus on the financial firms.
Dynamic panel estimation approach, specifically Arello and Bond GMM estimation technique was used for the analyses. The results show that the effect of leverage on firm performance depends on the size of the firm. For small firms, leverage has negative effect on performance. But as firms increase in size, the negative effect of increasing leverage reduces and turns positive for very large firms. The study recommended that leaders at the firm’s helms of affairs can consider diversifying their products and service in order to expand their reach and increase their size which can positively affect performance. The study finally recommended for further studies be conducted on all firms and on all financial firms listed on the Ghana stock exchange.
Key Words: Leverage Return on Assets (ROA) Return on Equity (ROE)
INTRODUCTION
Background to the Study
One of the extremely crucial elements in the operations of any organization is finance. As given by Zeitun and Tian (2020), the relevance of finance to firms can be likened to the human heart, since without adequate finance a firm will eventually cease to exist. According to empirical studies Nasimi and Fowowe (2019) have confirmed that inadequate finance can cause the eventual shutdown of a firm. A study by Jones and Edwin (2019) also show that finance has significant effect on the investment decisions and the growth potential of firms. There are two broad sources of finance open to firms in financing their operations. The first option is to issue ordinary or preference shares to the general public, otherwise known as equity financing.
The second financing option available to firms is to issuing bonds, or acquire loans from financial institutions, known as leverage financing (Wellalage & Locke 2020). The combination of leverage and equity a firm uses, is referred to as capital structure. Over the decade, varied theories have emerged to explain how leverage influence firm performance. The oldest of the theories is the capital irrelevance theory developed by Modigliani and Millerin 1963 (Modigliani & Miller 1963). Modigliani and Miller state that the amount of leverage in a firms’ capital structure has no significant influence on firm performance. Modigliani and Miller (1963) premise their explanation on the assumption that there on no taxation and perfect competition. Subsequently, Modigliani and Miller relaxed their assumption of no tax and indicated that increasing leverage in the capital structure can result in tax shield which can enhance firm value and performance. Jensen and Meckling (2019) based on the theory of agency cost also suggested a positive link between leverage and firm performance. According to them having more leverage in capital structure can help discipline managers by reducing agency cost. On the empirical level, several studies have examined leverage company performance links in both developed and advanced countries.
Although some empirical studies have reported an affirmative link between leverage and firm performance, others have reported a negative relationship (Allard, & Bauer 2018). According to O’brien, (2019), the mixed findings may be the result of contextual factors that moderate leverage performance relationship. Thus, in recent times, some empirical studies have included moderating factors in their analysis. For instance, Allard, and Bauer (2018) finds that board independence moderates the effect of leverage on firm performance. Similarly, Al-Rdaydeh (2018), also found that competitive strategies moderate the effect of leverage on firm performance.
Ghana’s capital market, like many developing countries, is underdeveloped. Consequently, most of the listed firms in Ghanarely more on leverage relative to internal sources of funding and equity to finance their operations (Akomeah et al 2018); Musah, 2017; Gatsi & Akoto 2020). Thus, it is imperative to ascertain the effect of leverage on firm performance in Ghana. Thus far, several empirical literatures have explored the linkage of leverage to firm performance (Mussah 2017; Appiaddjei 2019; Awunnyo-Vitor & Badou, 2019; Gatsi & Akoto, 2020). In the current study, we provide nuanced evidence of the relationship by examining the moderating effect of firm size on the leverage firm performance relationship. .
Statement of the Problem
Thus far, several empirical studies have examined the leverage and performance relationship. However, the results have been mixed; whereas some empirical studies show a favorable association between leverage and company success, others show the opposite. (García-Gómez et al 2021; Ravindran, & Kengatharan, 2021; Kenn-Ndubuisi, &Nweke, 2019). According to Ravindran and Kengatharan, (2021), the contrasting results may be attributed to the inability of previous studies to use robust estimation techniques capable of addressing the potential reserve causality between leverage and firm performance.
Others such as Abu-Abbas et al (2019) have attributed the contradictory results to the inability of these previous studies to include contextual factors that moderate the effect of leverage on firm performance. Thus, given these gaps in the literature, the current study makes two significant contributions. First, rather than using static models that do not address the reserve causality between leverage and firm performance as done by previous empirical studies in Ghana, this study adopts Arellano and Bond’s (1991) Generalized Method of Moment (GMM) dynamic panel estimation technique (Musah 2017; Anarfo 2015, Apiadjei 2019; Awunyo-Vitor & Badou, 2012).
This estimation approach can correct the endogeneity that emanated from the reserve causality between firm’s leverage and performance, and also the inclusion of the lag of the dependent variable in the model. Also, although some empirical studies have examined the role of contextual factors including ownership structure, and corporate governance practices, other contextual factors such as the firm size has received scanty empirical attention (González & Gonzállez 2019) Firm size can significantly influence the link between leverage and firm performance as larger firms have more capacity to acquire debt at more favorable terms, pay interest on debts without affecting their ability to make investments.
The lack of research on the moderating role of firm size on the leverage effect on firm performance in Ghana presents a research gap, which this study aims to fill.
LITERATURE REVIEW
Theoretical Review
This part of the study reviewed theories that were connected to the topic under the study’s boundaries.
Agency theory
The theory examines the problems that arise with the delegation of task from principals to agents and the potential solutions. According to the theory, both principals and agents are utility maximizers with different interests, therefore principals must institute measures (agency cost) that will ensure that agents act in their best interest(Jensen & Meckling 1976).These measures can be broadly categorized into 1) monitoring expenditure by the principal to limit any aberrant activities of the agent; (2) bonding expenditure by the agent to ensure that he will not take certain actions that could harm the principal; and (3) residual loss (Jensen & Meckling, 1976).
According to the theory, one of the bonding expenditures that the principal can take to reduce any aberrant behavior by the agent is by increasing the amount of leverage in a company’s capital structure. This is because increasing leverage reduces the amount of free capital available to mangers and also requires agents to work optimally to meet debt obligations. However, the downside in increasing leverage in a company’s capital structure is the reduction in the ability to finance new investments and the possibility of under investment. However, studies have shown that the negative impact of high leverage on investment is low for large organizations since they can easily raise additional capital from a variety of sources to fund their operations.
This therefore means that the positive benefits from increasing leverage will increase with firm size, whiles the potential negative consequences of increasing leverage may also reduce with firm size. In the context of the current study, most listed firms on the Ghana Stock Exchange (GSE) are managed by persons who are not owners of the company. Consequently, most of these firms may be exposed to several agency problems such as misappropriation of company funds, use of company time for personal activities, and other opportunistic behaviors by managers.
Firm Performance
Capital structure and performance are inextricably related. However, there is no agreement on how a firm’s performance should be characterized (Kiirby, 2019). Various stakeholders adopt different measures of performance in order to make smart decisions, hence the definition and measurement of financial success are hotly discussed. Profitability ratios, often known as accounting ratios, and market ratios are the two basic types of performance ratios (Masa`dhe et. al., 2015). The two common accounting measures usually used for measuring performance are Return on assets (ROA) and return on equity (ROE) (Titian& Phan, 2017).
Without taking into account the financing source, ROA assesses a company’s operating performance in relation to its investments (Stickney, 1996). The achievement or failure of management to maximize stockholders’ investment in the form of return is measured by ROE (Alexander and Norbes 2021). Thus, consistent with previous literature the current study measures performance using ROA.
Empirical Review
This section covers the empirical studies reviewed in the current department. It highlights the methodology employed, and the findings of the study. The study reviews studies on the effect of leverage of firm performance, and studies that focused on variables that can moderate the leverage effect on firm performance. Gatsi and Akoto, (2020) examined the effect leverage ratios on banks performance in Ghana. The study covered 14 banks over the period 1997-2006.The data for the study was analysed using static models, including fixed model, and random effect model. It was observed that most banks in Ghana are highly leveraged. Indeed, approximately, debt makes 87% of the total capital of banks in Ghana.
The regression analysis revealed a affirmative linkage between Debt-ratios and firm performance. Although an important gap is filled by the study by providing evidence on Ghana, the study has several limitations. A major drawback in this study is that the sample for this study was restricted to financial institutions and as such their findings cannot be generalized to cover firms operating in the non-financial sector in Ghana. Also, by using static models, the study failed to address the potential reverse causality between firm performance and leverage. Lastly, the study examined only the direct relationship between performance and leverage. However, the linkage between leverage firm Performances can be moderated by firm contextual factors.
Using a similar estimation technique, Tuffour, and Barnor (2014) examined the leverage effect on performance of manufacturing firms on the GSE. The study used data on the period 2007-2012. Leverage was measured using STD and TD. Per the findings, both variables have negative effect on firm performance. Similar to Gatsi and Akoto, (2020), this study did not address the problem of reverse causality. The study also did not examine the role of contextual factors. Yazdanfar and Ohman (2015) examine the effect of debt on SME output using data from Swedish businesses. 15,897 Swedish SMEs operating between 2009 and 2012 was analyzed using three-stage least squares (3SLS) and fixed-effects models. Debt-ratios in terms of trade credit, short-term debt, and long-term debt all have a detrimental impact on company profitability, according to this study.
The study was among the first to scrutinize the influence of leverage on the performance of SMEs. However, the study has some limitations. For instance, the study only examined the direct leverage effect on performance. Nguyen and Phan (2016) examine the moderating role of capital structure on firm performance relationship in Vietnam. The study employed a hierarchical regression approach effect and moderating effect of corporate governance on the relationship between leverage and firm with the firm-level dataset from Vietnam in 2013. The study reported an inverse relationship between debt and firm performance. In addition, the results also revealed that higher proportion of NEDs on Board would strengthen the adverse association between leverage and firm performance. Despite the significant contributions of the study, the study has several limitations.
For instance, the study uses static model and therefore those not address the issue of reverse causality. Again, the study limited the contextual factors to only corporate governance practices. Using a similar estimation technique to Gatsi and Akoto (2020), Moridi (2016) examine the effect of leverage on the performance of companies listed in Tehran Stock Exchange. The study population comprised of pharmaceutical companies on Tehran Stock Exchange spanning the period from 2010-2014. The findings indicated that leverage has a negative relationship company’s growth. Although the study’s findings confirm the findings of Gatsi and Akoto, (2020), it has several limitations. First, the study concentrated only on the direct effect of leverage on firm performance.
Again, the study used only static models which are unable to control for the potential reverse causality between leverage and firm performance. Kyule (2015) also looked into performance leverage relationship among manufacturing firms on the Nairobi Stock Exchange. Descriptive research design was adopted and 10 firms listed on Nairobi Stock Exchange in the manufacturing industry were selected. The findings revealed that performance was positively influenced by leverage financing. Although the finding provides empirical evidence on the effect of leverage on manufacturing firms, it has several limitations. For instance, most of the analysis was descriptive, which limits the casual interpretation of the coefficients.
Again, the study concentrated only on the direct effect of leverage on firm performance and did not examine the role of contextual factors in their analysis. Gharsalli (2019) on the other hand examined the leverage effect on performance of SMEs in France. The study adopts the quantitative research approach, and the data for the study was derived from the Bureau van Dijk–Diane database. The study used a sample of 2,636 manufacturing firms in the manufacturing sector. Per the findings, highly leveraged firms reported low performance. The study does, however, have significant flaws. Findings were acquired for only a single industry; thus, efforts should be made to investigate the issue further because it affects other industries as well. The study’s context is the second factor to consider.
This research was based on data collected from SMEs in France during a specific socioeconomic period (the global financial crisis of 2007-2008), which may restrict the generalizability of the findings in other contexts with various socioeconomic conditions. The influence of capital structure on companies’ performance in the Services industry of Botswana was investigated by Sathyamoorthi et al (2019). The study employed a descriptive research approach. All of the firms mentioned in Botswana’s consumer services sector were included in the study’s population. The study used a purposing sampling technique and spanned a seven-year period from 2012 to 2018.
Return on Assets (ROA), Return on Equity (ROE), Tobin’s Q, and Earnings per Share were the dependent variables (EPS). STD, LTD, and TD were all used to determine the capital structure. Liquidity and firm growth were used as control variables. Descriptive, and regression-analysis were used to examine the data. From results, increase in debt financing affects firm performance negatively. Specifically, the ratio of total debt to total equity affects performance metrics such as ROA, ROE, and Tobin’s Q negatively. Kenn-Ndubuisi, and Nweke, (2019) analysed the effect of leverage on firm performance in Nigeria using panel data. The sample for the study was extracted from the Nairobi Stock Exchange.
The study included 80 non-financial companies in total. Leverage was measured using the TD, cost of debt, and LTD. Similarly, performance was proxied by ROA. Data was analysed using static models. The findings showed that financial leverage affects ROA negatively. Although the study provides proof on the impact of leverage on performance of non-financial firms, the study has several limitations which limits its applicability. For instance, by using static models, the study failed to address the potential reverse causality between leverage and firm performance. The study also failed to examine the role of contextual factors. The influence of capital structure on companies’ performance in the paints and chemical industry in Nigeria was investigated by Jeleel (2017). The study employed OLS method.
Three firms mentioned Nairobi Stock Exchange were included in the study. The study used a purposing sampling technique and spanned a seven-year period from 2013 to 2017.The study reported that performance of these companies was negatively affected by leverage. Although the study provides proof on the impact of leverage on performance of non-financial firms, the study has several limitations which limits its applicability. The influence of capital structure on companies’ performance in the Services industry of Botswana was investigated by Sathyamoorthi et al (2019). The study employed a descriptive research approach. All of the firms mentioned in Botswana’s consumer services sector were included in the study’s population.
The study used a purposing sampling technique and spanned a seven-year period from 2012 to 2018.The capital structure influence on firm performance in the insurance industry was also assessed by Ftouhi et al (2015). The OLS method was employed by the study on data spanning the period 2008 to 2014. Nine firms mentioned Eswatini Stock Exchange were included. Purposing sampling technique was adopted. The study reported that performance of these companies was negatively affected by leverage. Although the study provides proof on the leverage performance relationship.
Appiah et al (2020) focused on leverage on performance of listed firms in Ghana. 19 listed companies formed the sample. The sample was based in convenience sampling approach. Per their findings, debt to equity ratio has adverse effect of firm performance. Although the study provides empirical evidence in relation to non-financial firms in Ghana, the study has several limitations. For instance, by using static models, the study failed to address the endogeneity between leverage and firm performance. Also, the study also failed to examine the role of contextual factors. Bui et al (2021) using data from the post-crises period, examines the leverage effect on firm performance of SMEs in Vietnam.
The study was based on the quantitative research approach, and correlational research design. Data for the study was acquired from a secondary source, specifically, the Ho Chi City Statistical Office. In all, the study used a sample of 4983 SMEs. The study confirmed the U-shaped relationship between leverage and firm performance. Although the study model led the dynamic effect of performance and controlled for the potential reverse causality between leverage and performance. It has several limitations. First, the study did not examine whether contextual variables can moderate the effect of leverage on firm performance.
Again, the study also concentrated only on SMEs. Given, the differences in the operating structure among listed firms and SMEs, generalizing their findings for listed firms may led to spurious conclusions. Lastly, the study was conducted in a non-Ghanaian context. According to Saliha and Abdessater,(2021) The study employed regression. 10 listed firms were included in the study. The study used a purposing sampling technique and spanned a seven-year period from 2003 to 2010.The study report that performance of these companies was negatively affected by leverage. Although the study provides proof on the impact of leverage on performance of non-financial firms, the study has several limitations which limits its applicability.
Abubakar (2021) also examine whether performance of oil and gas companies in Nigeria is affected by financial leverage. The study used data from 7 firms on Nigeria Stock Exchanges panning 2005- 2018. The study adopted an explanatory research design. The study adopted the random effects (ROE). The findings show that performance is not significantly affected but STDR and LTDR, but TDER has an adverse but substantial impact on performance as measured by ROE. Although the study provides evidence on the leverage influence on firm performance in the African context, the study has several limitations.
For instance, the study used a static estimation model (i.e. fixed and random effect models) and therefore was unable to control for the dynamic effect performance (past performance can have effect on current performance) and the potential reverse linkage between leverage and performance. Again, the study did not examine the moderating effect. Ravindran, and Kengatharan, (2021) also determine the leverage effect on firm profitability (ROA) in Sri-Lanka. Contrary to previous empirical studies, the study focused on the non-financial sector. The study used the quantitative approach, specifically, explanatory design. Sample for the study was extracted from the financial statements of the sampled firms.
In all 82 listed firms were used in the analysis. The sample was generated through convenience sampling approach. Using static models, specifically, the fixed and random effect estimation techniques, and the study found a significant adverse relationship between leverage and ROA. Although by focusing on the non-financial sector, the study feels a significant gap by providing evidence for the non-financial sector, the study has some limitations. The first and major limitation of this study is the use of static models. Static models are unable to address the dynamic nature of firm performance. More importantly, they do not address the possible reverse causality between leverage and firm performance. Also, the study did not examine whether contextual factor can moderate the relationship.
García-Gómez et al (2021) also examine how leverage affect the performance of firms in U.S. Similar to Ravindran, and Kengatharan, (2021), this study focused on the non-financial sector, specifically, the hospitality industry. However contrary to Ravindran, and Kengatharan, the study used both static model and dynamic models (specifically GMM estimation technique). 313 firms operating in the hospitality industry were used for the study, and the study reported a negative linkage between leverage and firm performance. Although the study fills a significant gap in literature by address the potential reserve linkage between leverage and performance, the study has some limitations.
There are significant differences in the operation of hospitality and manufacturing firms. Therefore, their findings may not be applicable to the manufacturing sector. Using a similar estimation strategy, Abu-Alkheil et al (2021) also studied the linkage of leverage to performance of Amman listed companies. The researchers extracted financial statements of the listed banks covering the period from 2004 to 2016. The study’s results demonstrate that leverage plays role in firm performance. Specifically, leverage has adverse effect on bank performance. The major drawback in this study is that they concentrated only on financial institutions.
Also, the study only examined the direct effect of FL on performance, and neglected to examine if contextual variables such as firm size can moderate the relationship. Ngatno et al (2021) also examine the moderating role of CS mechanisms on the leverage effect on firm performance in Indonesia. This research relies on secondary data from 506 micro finance organizations (rural banks). OLS was used to analyze the data. Capital structure financing decisions appear to have a good impact on financial success, according to the results. This, however, only applies to debt that is due in the near future. Long-term debthas an adverse influence on both ROE and ROA.
These findings back up the pecking order theory, demonstrating that there is an inverse relationship between business earnings and CS. The findings of the moderation study reveal that only the size of the board of commissioners can improve the link between capital structure and business performance, whereas board size cannot. On the Chinese capital market, Wenhao et al (2020) studied the moderating effect of Social Responsibility on the connection between company performance and leverage. For a period spanning 2010 to 2019, this work used a panel data regression approach with data composition represented by the SSE 180 index. The study used 86 large firms over a period of 10 years.
The results confirm that performance is influenced by leverage and also confirmed that CSR moderates the relationship. Ibhagui, and Olokoyo, (2018)examined whether firm size moderates the effect of leverage on performance. The study focused on listed firms on the NSE and time span of 2003 to 2007. The findings suggest that the adverse impact of leverage on performance is most pronounced and significant for small companies, and that evidence of a harmful impact lessens as a business matures, sooner or later disappearing when the firm reaches its estimated threshold size. Regardless of the Debt-ratios used, we find that this conclusion remains the same. In keeping with previous research, our findings suggest that leverage has a favorable effect on productivity for Nigerian listed companies.
Ngatno et al (2021) also examine the moderating role of capital structure mechanisms on the leverage effect on firm performance in Indonesia. This research relies on secondary data from 506 micro finance organizations (rural banks). OLS was used to analyze the data. Capital structure financing decisions appear to have a good impact on financial success, according to the results. This, however, only applies to debt that is due in the near future. Long-term debt has an adverse influence on both ROE and ROA. These findings back up the pecking order theory, demonstrating that there is an inverse relationship between business earnings and capital structure.
Al-Rdaydeh, M., (2018) based on a sample of industrial enterprises between 2007 and 2016, this study investigated the moderating influence of competitive strategy in the connection between leverage and company performance. The effects of leverage on performance was found to be influenced by competitive strategy. Finally, the findings support the hypothesis that enterprises who use a cost leadership approach benefit from tax advantages and greater efficiency as a result of debt financing and/or debt covenants. Ishtiaq et al (2017) investigate whether corporate governance, especially ownership concentration, moderated the effect of leverage on company performance among companies.
Data from a sample of Taiwanese listed corporations from 1996 to 2006 was used for the study. According to the findings, ownership concentration affects the leverage performance relationship. Although the study examined the role of contextual factors like corporate governance and firm ownership structure, the role of firm size was not examined. Oyerinde et al (2018) investigated whether corporate governance, especially CEO duality, moderated the leverage company performance relationship. Sampled Taiwanese listed corporations data from 2001 to 2010 was used for the study. According to the findings, CEO affects the leverage performance relationship.
Although the study examined the role of contextual factors like corporate governance and firm ownership structure, the role of firm size was not examined. Saputri, and Asrori, (2019) investigated whether the performance and leverage relationship are affected by presence of audit committee in mining companies. Data from a sample of Taiwanese listed corporations from 2013 to 2016 was used for the study. The findings attest that audit committees affects the leverage performance relationship. Although the study examined the role of contextual factors like corporate governance and firm ownership structure, the role of firm size was not examined.
The importance of board in dependence in the link between debt financing and emerging market performance is investigated in a paper by Pham and Nguyen (2020). We employed an empirical model in which debt, board independence, made up the moderating variable, as well as numerous control factors, are all independent variables. The study is based on a 300 Vietnam-based publicly traded companies from 2013 to 2017. Per results, profitability is negatively affected by debt financing, according to our research, and board independence decreases this adverse impact. In the light of the above discussion, it was evident that related works on the effect of leverage on performance have mostly used static models, and do not address the potential endogeneity between financial leverage and performance.
The few empirical studies that used robust dynamic models focused on developed countries. Again, although some empirical studies have examined the role of contextual factors like corporate governance and firm ownership structure, the role of firm size has not been critically examined. In view of this discoveries, the first aimis to investigate the effect of leverage on firms in Ghana using a dynamic panel estimation strategy. The second aim is to examine if firm size moderates the effect of leverage on firms’ performance.
Conceptual Framework
This section looks at the conceptual framework of the study. It shows the analysts idea on how the study is explored. As show in Figure 1, leverage is hypothesized to influence performance directly. However, the effect is expected to be moderated by firm size.
Figure 1: Conceptual Framework of the Study.
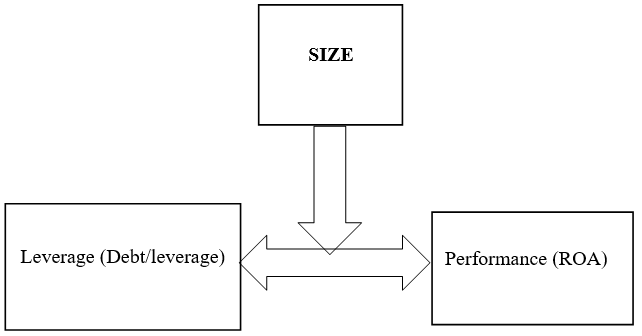
Source: Author’s Construct (2021)
RESEARCH METHODS
Research Approach
According to Berrios et al (2015) the study adopted the positivist approach. The positivist approach, which derives its bases from scientific method, and relies on statistical procedures for data collection. It employs numeric data and expresses results in numeric quantities. In contrast, positivist approach relies on case study, interview, observations, etc. and uses the descriptive narrative data analysis (Berrios et al 2015). Given the focus and objective of this study, this study adopted the positivist approach.
Research Design
The explanatory research design was adopted. This research attempted to explain the cause-and-effect relationship between and among variables. The purpose of an explanatory research, in the view of Yin (2014), is to attain two objectives. That is, it first tries to figure out which factors are causes and which variables are effects, and then it tries to figure out what kind of relationship exists between the causative variables and the effect to be predicted. Given that the research objectives of this proposal are predictive in nature, the explanatory research design was be deemed appropriate and, therefore, was utilized in the study.
Study population
The study’s data came from listed companies. All non- financial firms listed on the Ghana Stock Exchange as at March 2021 make up the population of the study.
Sample Size and Sampling Approach
The study’s data came from listed companies. The study’s sample consisted of all the companies listed on the Ghana stock exchange with particular focus on the financial firms.
Table 1: Sampled Firms
| Banking Institutions | Industry |
| 1. Fun Milk | Manufacturing |
| 2. Aluworks | Manufacturing |
| 3. Camelot | Manufacturing |
| 4. Benso Oil Plantation | Manufacturing |
| 5. Guinness Ghana | Manufacturing |
| 6. Cocoa Processing Ltd | Manufacturing |
| 7. Ashanti-Gold Limited | Extraction Industry |
| 8. Total Petroleum | Oil and Gas Industry |
Source: Kwakye (2024)
Data Type and Source
This study uses secondary data, specifically, the data is obtained from the published financial statements of companies listed on the Ghana Stock Exchange. In all a total of 8 non-financial firms listed on the Ghana Stock Exchange were used for the analysis. The data spans from 2011-2019. The choice of secondary data is based on the fact that all information needed could be easily retrieved from the financial statement of the firms.
Empirical Model Specification
Given the likelihood that past performance may influence current performance, the study will estimate a dynamic panel model of the form where performance (ROA) at time, is explained by its lagged values and a set of exogenous variables. The empirical equations are listed below;
PERit = β0 +B1 ROAit-1+ B2 LEVit + B3 FR SIZEit + B4 FR Growthit +B5 EFFit + εit (1)
PERit = β0 + B1 ROAit-1 + B2 LEVit +B3 SZit + B4 LEV*FR SIZEit + B5 FR Growthit + B6 EFFit + εit (2)
PERit = Firm Performance
ROAit = Return on Asset
ROEit = Return on Equity
LEVit =Leverage
FRSZit = Firm size
FR Growthit = Firm Growth
EFFit = Efficiency
εit =is the error term assumed to have mean zero E [εit] = 0
β0= Constant
β = 1, 2, 3…6 are parameters
i = Listed firm and t = the index of time periods.
Table 2: Definition, Measurement and a Priori Expectation of Variables
| Variables | Measurement | A-priori Sign |
| Dependent Variable | ||
| Return on Assets | Net-Income/Total-Assets | |
| Return on Equity (ROE) | Net Income/Equity | |
| Independent Variables | ||
| Leverage | Debt/Total Assets | Indeterminate |
| Efficiency ratio | Expenditure/Income | Adverse |
| Size of Firm | Natural logarithm of total assets | Positive |
| Firm Growth | Percentage changes in Assets | Positive |
Source: Kwakye (2021)
Estimation Technique for the Dynamic Panel Model
The inclusion of the lag dependent variable as an explanatory variable in equation 1 and 2 led to endogeneitydue to the correlation between the variable and the error term. There is also an additional possibility of endogeneity from the reverse causality between leverage and performance. Addressing these challenges required the use of instrumental variable estimation techniques. However, finding potential variables that qualify as suitable instruments are typical hard and unavailable in most data sets. Internal instruments as in the popular GMM estimator has gained momentum as an alternative. The study therefore employed Arellano and Bond’s (1991) proposed system Generalized Method of Moment estimator to estimate the model.
GMM is able to correct for endogeneity by using lags of both the dependent and independent variables as instruments. In order to confirm the consistency of the estimates, I performed a number of tests. I conducted the J-Hansen test of over-identification to ascertain the validity of the instruments and the serial autocorrelation test to check the absence of serial autocorrelation in the model. Failing to reject the H0 in both tests provided support for the consistency of the estimates.
Blundell-Bond system GMM estimator
According to Baltagi (2020), a dynamic model is achieved by including the lag of the dependent in the model. Thus, the typical dynamic panel model estimated using the GMM estimator is presented below:
yit= δyt-1+x’it β+ εit
With εit=μi+Vit
Where δ is a scalar
yit is the series of dependent variable across individuals.
x’it is a 1*K matrix of strictly exogenous regressors
εit is the error term
μi is the unobserved individual-specific time-invariant effect
Vit is the idiosyncratic error term
β is a K *1 matrix
Since explanatory variables contain the initial lag of the dependent variable, Equation 1 is a first-order dynamic panel model (Yi, t-1). The composed error term in parentheses combines an individual specific random effect (v), and an error that varies across both individuals and time (it).However, neither OLS nor fixed effects estimates can effectively assess this. Because the explanatory variable yt (i-1), is positively linked with the error term due to the presence of individual effects, an OLS estimator of in equation 1 is inconclusive. Because the equation is changed to eliminate the individual impact, a fixed effects estimation does not have this discrepancy. However, the fixed effect model demonstrations a unlike problem of correlation concerning the error term and lagged dependent variable.
Due to these issues, the conventional method is to select an appropriate instrument that is correlated with but uncorrelated with the potentially endogenous variable (the stronger the correlation, the better). Arellano and Bond (1991) proposed differencing the data and using the lags of the endogenous variable as instruments. This method is known as the Arellano and Bond(1991) estimator. Based on this approach the dynamic model in equation is transformed. Thus, the model becomes;
∆yit=δ∆yt-1+∆x’it β+∆vit
Post Estimation Tests
Testing for autocorrelation
The autocorrelation test is a diagnostic test developed by Arellano and Bond (1991) which is based on the assumption of serial independence in the idiosyncratic error term Vitof the difference equation. This test renders some lags invalid as instruments. The presence of autocorrelation in the GMM model means using the lags of the endogenous variable as an instrument is not appropriate. The H0 hypothesis for the autocorrelation test is that serial autocorrelation does not exist in the dataset. Consequently, a significant p-value will demand the rejection of this null hypothesis and take the alternative hypothesis, which states autocorrelation.
Sargan test of over-identification
Another equally important post estimation test that the study will undertake to check the validity and robustness of our estimated model is the Sargan test of over-identification. This test examines the exogeneity assumption of the instruments used in the model. The HO of this test is that instruments used are exogenous and therefore valid. If a significant result is achieved, then we reject the HO and concludes that the instruments are not valid.
RESULTS
Introduction
This chapter presents and discusses the results of the analysis. Beginning with the descriptive statistical results, the chapter discusses further, the results of the correlation analysis and the variance inflation test (VIF), with emphasis on explaining the degree to which variables are associated with one another. GMM is carried out to explain the relationship between capital structure and performance, and the moderating role firm size.
Descriptive Statistics for all Variables
The descriptive statistics of all the variables used under this work are presented in Table 3 below. This comprises of the dependent, independent, and control variables that are employed in the research. For each variable, we present the number of observations, the mean, standard deviation, minimum (min) and maximum (max) values of the observations.
Table 3: Descriptive Statistics of Variables
| Variable | Obs | Mean | Std. Dev. | Min | Max |
| ROA | 72 | 0.066 | 0.290 | -0.122 | 0.498 |
| ROE | 72 | 0.152 | 1.810 | -0.515 | 0.718 |
| EFF_RATIO | 72 | 0.327 | 0.143 | 0.015 | 0.751 |
| FR_SIZE | 72 | 10.85 | 3.322 | 4.51 | 15.05 |
| LEVERAGE | 72 | 0.413 | 0.360 | 0.043 | 0.89 |
| FIRM GROWTH | 64 | 0.230 | 0.213 | -0.401 | 1.563 |
Source: Kwakye (2021)
The mean for ROA is 0.006, with a standard deviation of 0.490. The minimum value for ROA for the sampled firms over the period is -0.122 and the maximum value is 0.498. The standard deviation of the ROA compared to its mean is higher, suggesting that most of the listed firms’ ROA are not close to the mean value. Similarly, the mean for ROE is 0.152, with a standard deviation of 1.810. Thus, indicating that the values for leverage are not normally distributed but rather moderately skewed. The values of ROE ranges from a minimum value of -0.515 to a maximum value of 0.718. Financial leverage (LEV) has a mean value of 0.413. The standard deviation for this distribution is 0.360. The minimum and maximum values for leverage over the sample period is 0.043 and 0.89 respectively.
The mean value of efficiency ratio (EFF_RATIO) is0.327, with a standard deviation of 0.02. 0.015 and 0.715 are the minimum and maximum values for operating efficiency. Table 3 also presents the summary statistics for firm size. In congruence with previous studies, firm size is proxied by the log of firm assets. The summary results indicate that the mean for firm size (FR_SIZE) is 10.85. 4.5 and15.05 are the minimum and maximum values for this distribution respectively.
Correlation Analysis
Table 4 contains the results for correlation analysis, which describes the relationship between the various variables used for our analysis. Starting with the dependent variables, we find a strong positive relationship between ROA and ROE. The results also show a ROE is negatively related to firm size, and leverage. Firm growth also has adverse association with ROA but this relationship is insignificant. For ROE, the results show that efficiency and firm growth have positive association with ROE, and leverage has a negative association with ROE. However, with exception of firm size these associations are not significant. Again, results show that firm growth has significant positive association with leverage and size.
In conclusion, the relationships between the control variables are very weak and do not raise concerns about multi collinearity. This is because the connections’ strength is less than 0.9.
Table 4: Correlation Analysis for control variables used in the Study
| Variables | (1) | (2) | (3) | (4) | (5) | (6) |
| (1) ROA | 1.000 | |||||
| (2) ROE | 0.652* | 1.000 | ||||
| (3) EFFICIENCY | -0.161 | -0.179 | 1.000 | |||
| (4) LOGASSETS | 0.210* | 0.440* | 0.139 | 1.000 | ||
| (5) LEVERAGE | 0.234* | 0.145 | -0.125 | 0.155 | 1.000 | |
| (6) GROWTH | 0.118 | 0.203 | 0.130 | 0.302* | 0.405* | 1.000 |
| *** p<0.01, ** p<0.05, * p<0.1 | ||||||
Source: Kwakye (2021)
GMM Results for ROA
The results for objective 1 and object 2 are contained in Table 5. The first column presents the effect of leverage on ROA, while the second column results is the moderating effect of firm size on leverage and ROA. Also, a number of diagnostic tests were performed to ascertain the validity of the two-step system GMM results. This includes the auto correlation test, multi collinearity test and the Sargan test. The results of these diagnostic tests are presented as part of Table 5. Starting with the first column, the mean VIF is 3.43 which is significantly below the threshold of 10. Also, the AR (1) test rejects the null hypothesis that first order serial auto correlation does not exist. However, the AR (2) test reveals no indication of a second order serial connection.
The results also pass the Sargan tests since the p-value is insignificant.Having passed both the auto correlation test and the Sargan validity test, we move on to discuss the results. Starting with the first column, we find that the coefficient for lag of ROA is significant 10 percent significance level.The means that previous years ROA performance has significant influence on current year’s performance. Specifically, a unit increase in performance in the precious year will result in an increase in performance by 0.030 percent. This finding provides justification for the adoption of dynamic modelling approach as previous year’s performance has significant impact on current year’s performance.
Also, in model 1, the co-efficient of leverage is significant and positive.This means that, a unit increase in financial leverage will result in an increase in firm performance of by 0.013 percent. In line with this finding was a study by Gatsi & Akoto, (2010) on firms in Ghana which established a positive link between leverage and firm performance. A more recent study by Boadi & Li (2015) examined the association of leverage to firm performance in Ghana by testing the link using GMM regression method and established a positive significant relationship between leverage and company’s performance.However, our findings differ from the findings of Bunyaminu et al(2021); Appiah et al(2020) and Yazdanfar and Hman, (2015)because all of these studies found a negative relationship between leverage and performance.
Arguments have been raised in literature to support the increase in performance by leverage. For instance, according to Bunyaminu et al (2021), increasing financial leverage can help discipline managers and ensure they use company resources as efficient as possible so as to prevent bankruptcy. Firm size also has the expected sign and significance. To be precise, the results show that a unit increase in firm size can cause an increase in ROA by 0.013 percent. This is due to the fact that, firms with large size in comparison to smaller firms can have easy access to funds, enjoy economics of scale, and have advantage that is more competitive and hence can spend more CSR to increase their performance. In addition, the findings is in line with previous evidence (Bhatia & Srivastava 2016).
Turning our attention to column 2(Model 2) which contains the results for the interaction of leverage with firm size.We find that the model passes multi collinearity test, auto correlation test and the Sargan tests. We therefore go on to interpret the results.From the results, the interaction term is positive. This suggests that increasing firm size boots the positive effect of leverage on return on assets (ROA) of manufacturing firms in Ghana. To determine the moderating effect of firm size, we estimate the net effect at representative values (Find the detailed calculations in the appendix). From the net effect calculations, we find that as non-financial firms increase in size,the positive effect of leverage on performance increases.
This perhaps is due to the fact that has firms increase in size, they are more likely to face agency problems and having more leverage in the capital structure can help address these challenges. It is also consistent with the findings of Zeitun and Tian (2014) whoused the threshold regression to examine whether firm size moderates the company productivity and FL relationship.The researchers discovered that the negative impact of leverage on company performance is most pronounced for small businesses, and that evidence of a negative impact lessens as a business grows, eventually disappearing when the firm’s size exceeds the anticipated threshold level.According to Zeitun and Tian (2014) the change in sign can be attributed to the fact that large firms are more diversified and can pay for interest on debts without compromising their investment decisions and consequently debts may not affect them negatively.
Table 5: Effect of Leverage on ROA (GMM RESULTS)
| Variable | ROA
MODEL 1 |
ROA
MODEL 2 |
| Lag ROA | 0.030**
(0.015) |
0.008
(0.008) |
| LEV | 0.013*
(0.007) |
1.529*
(0.874) |
| FR SIZE | 0.132*
(0.077) |
0.104***
(0.011) |
| LEV*FR SIZE | 0.045**
(0.015) |
|
| OE REV | -0.036
(0.041) |
-0.091
(0.078) |
| FR GWTH | 0.004
(0.002) |
0.070***
(0.02) |
| Constant | -4.232*** | 1.866 |
| (1.177) | (2.83) | |
| AR (1) | 0.009 | 0.785 |
| AR (2) | 0.825 | 0.545 |
| Sargan test | 0.182 | 0.123 |
| Mean VIF | 3.43 | 4.39 |
| Wald Test(P-value) | 292.22 (0.000) | 4.09e+06 (0.000) |
| Number of Instrument | 9 | 14 |
Source: Kwakye (2021)
GMM Results for ROE
Table 6 below contains the results for objective 3 and 4. The first column represents the results for the effect of leverage on ROE, whiles the second column contains the results for the moderation analysis. Prior to discussing the results, we performed a number of diagnostic tests to ascertain the validity of the two-step system GMM technique. This includes the multi collinearity test, auto correlation tests and the Sargan test. The results of diagnostic tests are presented as part of Table 6. Starting with model 3, we find mean VIF is 3.27 which is less than the recommended threshold (10), thus indicating that the variables are not highly correlated. Also, the model passes both the auto correlation test and the Sargan test. We therefore go on to discuss the results.
We find that the coefficient for lag ROE is significant at any of the traditional alpha values. This means that previous year’s ROE has significant influence on current year’s performance. Similar to model 1, the co-efficient of leverage is positive and significant at 5 percent significance level. This means that, a unit increase in financial leverage will result in the reduction in ROE by 0.154 percent. This finding is consistent with the empirical findings of García-Gómez et al (2021) who examined the effect of leverage on both ROE and ROA of firms in the hotel industry, and also who examined the effect of leverage on listed banks in Ghana.
Firm size also had the expected sign and significance. The coefficient indicates that a one increase in firm size will cause increase in ROE by 0.011 percent. This result is in line with Ozgulbas et al (2014), who found a positive relationship between firm size and performance. According to Ozgulbas et al., compared to small firms, large non-financial firms have less difficulty accessing funds for their operations, enjoy economics of scale, and can spend more money on CSR to increase their productivity. In addition, the findings of (Bhatia & Srivastava 2016; Mathuva 2015; Yazdanfar 2013) also demonstrate that firm with larger size have more capital and cost advantage in terms of bargaining Power over input costs resulting in higher performance.
The results also show that operational expense revenue ratio has significant negative influence on ROE. Specifically, the results show that a unit increase in operational expense revenue ratio `reduces return on equity by 0.045. This result implies that firms that are able to increase their operational efficiency can expect higher return on equity. This finding is in line with the findings of Gill et al (2014) who examined the effect operational efficiency on the performance on Indian manufacturing firms. Turning our attention to column 2(Model 4) which contains the results for the interaction of leverage with firm size. We find that the model also passes multi collinearity test, auto correlation test and the Sargan tests. We therefore go on to interpret the results. The results show that the interaction term is positive.
This suggests that increasing firm size boots the positive effect on return on equity of manufacturing firms in Ghana. To better appreciate the results, we calculate the net effect (Find calculation in the appendix). From the net effect calculations, we find that the positive effect of leverage on performance of manufacturing firms increases as firms increase in size. These results confirm our hypothesis that the effect of leverage on performance depends on the size of the firm.
Table 6: Effect of Leverage on ROE (GMM Results)
| Variable | ROE
MODEL 3 |
ROE
MODEL 4 |
| Lag ROE | 0.006**
(0.002) |
0.008
(0.008) |
| Leverage | 0.003*
(0.002) |
0.027
(0.023) |
| Firm Size | 0.011*
(0.005) |
0.003*
(0.002) |
| Lev*Firm Size | 0.044**
(0.021) |
|
| Operating Efficiency | -0.045**
(0.015) |
0.004
(0.007) |
| Firm Growth | 0.269
(0.173) |
0.001
(0.001) |
| Constant
|
0.273 | 0.091 |
| (0.284) | (0.078) | |
| AR (1) | 0.192 | 0.074 |
| AR (2) | 0.706 | 0.968 |
| Sargan test | 0.078 | 0.111 |
| Mean VIF | 3.27 | 4.68 |
| Wald Test(P-value) | 3.62e+13 (0.000) | 5.03e+09(0.000) |
| Number of Instrument | 8 | 14 |
Source: Kwakye (2021)
SUMMARY, CONCLUSIONS & RECOMMENDATIONS
Summary of Findings
The study assessed the effect of financial leverage, firm size, on performance. Specifically, the study examined, first, the effect of leverage on performance of companies in Ghana. Secondly, the study examined the moderating role of firm size. In addressing the above-mentioned objectives, the study reviewed relevant empirical and theoretical literature related to the topic. The concept of performance was reviewed. The Agency Theory, was discussed in the theoretical review section. In the empirical section, relevant studies form Ghana and other countries were discussed. The study adopted the quantitative research approach, and using causal and explanatory design, the study explained how leverage affect productivity and the moderating role of firm size.
Based on data retrieved from the financial statements of various listed firms on the GSE, the study estimated static dynamic models using the GMM estimation technique. In terms of the first objective, leverage together with other control variables were regressed on ROA. The study found that the coefficient for leverage had significant positive coefficients. For the second objective, the study interacted the leverage variable with firm size variable and derived the net effect at various representative values. The results show that as non-financial firms increase in size, the positive effect of leverage on firm performance is enhanced. In terms of the third objective, which sought to determine the effect of leverage on ROE.
Conclusions
Based on the aforementioned results, the following conclusions are made; First, leverage has been revealed to be a significant determinant of performance (both ROA and ROE) of listed firms. We can conclude that the effect of leverage on performance is influenced by the size of the firm. Specifically, as non-financial firms increase in size, the positive effect of leverage on performance is enhanced.
Recommendations
Following the conclusions made above, the following recommendations are made to various stakeholders:
- Non-financial firms, particularly large firms can finance their assets using debt since it has positive effect on their performance. However, in doing so, non-financial firms must also ensure they effectively manage the risks associated with high debt.
- Finally, leaders at the firm’s helms of affairs can consider diversifying their products and service in order to expand their reach and increase their size which can positively affect performance.
Suggestions for Further Research
The study posited that the firms in financial sector of the nation’s economic activity can be seen as an avenue where further research can be conducted.
REFERENCES
- Abu-Abbas, B. M., Alhmoud, T., & Algazo, F. A. (2019). Leverage and firm performance evidence from Amman stock exchange. The European Journal of Comparative Economics, 16(2), 207-237.
- Abu-Alkheil, A., Alomari, M., & Set-Abouha, B. (2021). The effect of leverage on banks’ performance: empirical evidence from a frontier market-the Amman Stock Exchange. Afro-Asian Journal of Finance and Accounting, 11(2), 198-221.
- Abubakar, A. (2021). Leverage and financial performance of oil and gas companies in Nigeria: A re-examination. Turkish Journal of Computer and Mathematics Education, 12(3), 4170-4180.
- Akomeah, E., Bentil, P., & Musah, A. (2018). The Impact of capital structure decisions on firm performance: The case of listed non-financial institutions in Ghana. International Journal of Academic Research in Accounting, Finance and Management Sciences, 8(4), 1-15.
- Allard, A., & Bauer, C. (2018). The possible effects of the blue economy on gender equality in the Republic of Seychelles.Research Journal of Finance and Accounting, 5(20), 40-43.
- Arellano, M and Bond, A., (1991). Some test of specification for panel data: Monte Carlo evidence and an application to employment equations. The Review of Economic Studies, 58(2): 277-297
- Alexander, D., and Norbes, C., (2021). Financial Accounting: An international Introduction Harlow: Financial Times, Prentice Hall.
- Alchian, A. A., and Demsetz H., (2022).Production, Information Cost and Economic Organization: American Economic Review, LXII 5, 777-795.
- Al-Rdaydeh, M. (2018). Moderating effect of competitive strategies on the relation between leverage and performance: Evidence from Jordan. Business and Economic Horizons, 14(3), 626-641.
- Anarfo, E. B. (2015). Determinants of capital structure of banks: Evidence from Sub-Sahara Africa. Asian Economic and Financial Review, 5(4), 624-631.
- Appiadjei, E. A. (2019). Capital structure and firm performance: Evidence from Ghana stock exchange. Research Journal of Finance and Accounting, 5(16), 37-43.
- Appiah, K. O., Gyimah, P., & Abdul-Razak, Y. (2020). Leverage and corporate performance: Does the duration of the debt-ratio matters? International Journal of Business and Emerging Markets, 12(1), 31-45.
- Awunyo-Vitor, D., & Badu, J. (2012). Capital structure and performance of listed banks in Ghana. Journal of Finance and Accounting, 8 (19), 77-83.
- Banchuenvijit, W., & Phuong, N. T. H. (2012). Determinants of firm performance of Vietnam listed companies. Academic and Business Research Institute.4(2)1-7.
- Baltagi, B.H., (2005). Econometric Analysis of Panel Data. (Third edition). John Wiley & Sons 361.
- Berrios R., Totterdell, P., & Kellett, S. (2015). Investigating goal conflict as a source of mixed emotions. Cognition & emotion,29(4),755-763
- Brigham, E &. Houston, F., (2011). Fundamentals of Financial Management. Dasar-Darsar Manajemen Keuangan. Edisi 10. Jakarta; Salemba Wmpat.
- Bhatia, S &. Srivastava, A., (2016). Working Capital management and Firm Performance in Emerging Economies: -Evidence from India. Journal of Management and Labour Studie,41(2)
- Boadi, E.K., & Li. Y., (2015). An Empirical Analysis of Leverage and Financial Performance of Listed Non -Financial Firms in Ghana. International Journal of Economics and Finance 7(9)
- Bui, T. D., Nguyen, H. H., & Ngo, V. M. (2021). Leverage and performance of SMEs in Vietnam: Evidence from the post-crisis period. Economics and Business Letters, 10(3), 229-239.
- Bunyaminu, A., Yakubu, I. N., & Bashiru, S. (2021). The effect of leverage on profitability: An empirical analysis of recapitalized banks In Ghana. International Journal of Accounting & Finance Review, 7(1), 93-102.
- Demir E, &Díez-Esteban (2021). The impact of geopolitical risk on cash holdings of hospitality companies: Evidence from emerging countries. J Hospitality Tourism Manage 39:166-174
- Fowowe, B. (2017). Access to finance and firm performance: Evidence from African countries. Review of development finance, 7(1), 6-17.
- Ftouhi, K., Ayed, A., & Zemzem A., (2015). Tax Planning and firm value: Evidence from European companies. International Journal Economics &Strategic Management of Business Process, 4(1), 73-78.
- García-Gómez, C. D., Bilgin, M. H., Demir, E., &Díez-Esteban, J. M. (2021). Leverage and performance: The case of the US hospitality industry. Quantitative Finance and Economics, 5(2), 228-246.
- Gatsi, J. G., &Akoto, R. K. (2010). Capital structure and profitability in Ghanaian. SSR N Journal.
- Gharsalli, M. (2019). High leverage and variance of SMEs performance. The Journal of Risk Finance, 28(7),213-224
- Gill, A., Singh, M., Mathur, N., & Mand, H. S. (2014). The impact of operational efficiency on the future performance of Indian manufacturing firms. International Journal of Economics and Finance, 6(10), 259-269.
- González, V. M. (2013). Leverage and corporate performance: International evidence. International Review of Economics & Finance, 25(3), 169-184.
- Ishtiaq, M., Latif, K., Khan, A. N., & Noreen, R. (2017). Corporate Social Responsibility and firm Performance: The moderating effect of ownership Concentration. Journal of Managerial Science, 11(3),353-386.
- Ibhagui, O. W., & Olokoyo, F.O., (2018). Leverage and firm performance: new evidence on the role of firm size. The North American Journal of Economics and Finance, 45(1),57-82.
- Jesen, M. C., & Meckling W. H., (1976). Theory of the Firm: Managerial
- Behavior, Agency Cost and Ownership Structure. Journal of Financial Times,3(4),305-360.
- Jeleel, A. (2017). Effect of leverage on firm performance in Nigeria: A case of listed Chemicals and paints firms in Nigeria. Global Journal of Management and Business Research., 24(5),49-88
- Jones, A. S., & Edwin, O. A. (2019). Effect of Debt Financing on the Corporate Performance: A Study of Listed Consumer Goods firms in Nigeria. International Journal of Academic Accounting, Finance and Management Research, 3(5), 31-46.
- Kenn-Ndubuisi, J. I., &Nweke, C. J. (2019). Leverage and firm financial performance in Nigeria: A panel data analysis approach. Global Journal of Management and Business Research.
- Kirby, J. (2005). Toward a theory of high performance. Harvard Business Review,83(7),30-39.
- Kyule, J. M. (2015). Impact of liquidity and solvency on financial performance of firms listed at the Nairobi securities exchange (Doctoral dissertation, University of Nairobi).
- Le, T. P., & Phan T.B (2017). Capital Structure and firm performance: Empirical evidence from small transition country. (Research in international Business and Finance 42:710-26).
- Margaritis, D., & Psillaki, M. (2010). Capital structure, equity ownership and performance. Journal of banking & finance, 34(3), 621-632.
- Masa’dhe (2015). User adoption of online Banking in Nigeria: A Quantitative study. Journal of internet banking and commerce, 20(3), 132.
- Modigliani, F., & Miller, M.H., (1963). Corporate Income taxes and cost of Capital: A Correction. American Economic Review, 433-443.
- Moridi, H. (2016). The Effect of Leverage on the Growth of the Companies Listed in Tehran Stock Exchange. Journal of Natural and Social Sciences, 5(3), 132-145.
- Musah, A. (2017). The impact of capital structure on profitability of commercial banks in Ghana. Asian Journal of Economic Modelling, 6(1), 21-36.
- Nasimi, A. N. (2016). Effect of capital structure on firm profitability (an empirical evidence from London, UK). Global Journal of Management and Business Research.
- Ngatno, Apriatni, E. P., & Youlianto, A. (2021). Moderating effects of corporate governance mechanism on the relation between capital structure and firm performance. Cogent Business & Management, 8(1), 15-27.
- Nguyen, D. T., & Phan, A. T. (2016). Corporate governance, leverage and performance of privatized firms in Vietnam. In The 8th Thailand-Japan International Academic Conference (pp. 1-7).
- O’brien, J. P. (2003). The capital structure implications of pursuing a strategy of innovation. Strategic Management Journal, 24(5), 415-431.
- Opter Tim, H. (2009). The Debt-Equity Choice. Journal of Financial and Quantitative Analysis.
- Oyerinde A. J., Olatunji O.C., &Adewale O. A., (2018). Corporate Social Responsibility and Performance of Oil and Gas Industry in Nigeria. EKSU Journal of the Management Scientist 2(1).
- Ozenbas, D., & Portes, L. S. V. (2011). Does firm size matter? The relationship between firm level volatility, GDP volatility and capital structure decisions for firms of different size groups. The Business Review, 17(2), 35-41.
- Pham, H. S. T., & Nguyen, D. T. (2020). Debt financing and firm performance: The moderating role of board independence. Journal of General Management, 45(3), 141-151
- Ravindran, M., & Kengatharan, L. (2021). Impact of Leverage on Firm Profitability: Evidence from Non-Financial Firms Listed in Colombo Stock Exchange-Sri Lanka. European Journal of Economic and Financial Research,1(1), 80-91.
- Saliha, T., & Abdessatar, A. (2011). The determinants of financial performance: an empirical test using the Simultaneous Equations Method. Economics and Finance Review,1(10) 1-9
- Saputri, L., & Asrori, A. (2019). The Effect of Leverage, Liquidity and profitability on Financial Distress with the Effectiveness of the Audit Committee as Moderating Variable. Accounting Analysis Journal 8(1),38-44
- Sathyamoorthi, C. R., Pritika, S. B., Dzimiri, M., & Wally-Dima, L. (2019). Capital structure and its effect on firm performance: an empirical study on the listed consumer services sector organizations in Botswana. European Journal of Economic and Financial Research.
- Stickney, C. P., (1996). The effects of Business Environment and Strategy on Firm’s Rate of Return on Assets. Financial Analyst Journal,43-52
- Tuffour, K. J., & Barnor, C. (2014). The effect of leverage on profitability of manufacturing companies listed on the Ghana Stock Exchange. Journal of Business Research, 8(1), 56-65.
- Tugas, F. C. (2012). A Comparative Analysis of the Financial Ratios of Listed Firms Belonging to the Education Subsector in the Philippines for the Years 2009-2011. International Journal of Business and Social Science, 3(21), 321-331.
- Umar A (2012). Effects of wages, motivation and job satisfaction on the performance of workers in the manufacturing industry in the city of Makassar. Journal of Aplikasi Manajeman, 10(2), 406-418
- Voulgaris, F., Asteriou, D., & Agiomirgianakis, G. (2004). Size and determinants of capital structure in the Greek manufacturing sector. International Review of Applied Economics, 18(2), 247-262.
- Wellalage, N. H., & Locke, S. (2015). Impact of ownership structure on capital. Journal of Finance and Accounting, 9 (22), 22-27.
- Wenhao M., Jaidi J., & Mohidin, R. (2020). The Relationship between Capital Structure and Firm Performance: Under the Moderating Role of CSR, Eurasian Journal of Social Science 8(3), 85-95.
- Yazdanfar, D., & Ohman, P. (2015). Debt financing and firm performance: an empirical study based on Swedish data. The Journal of Risk Finance.
- Yin, R.K., (2014). Case study Research: Design and methods. Los Angeles, CA: Sage.
- Zeitun, R., & Tian, G. G. (2014). Capital structure and corporate performance: evidence from Jordan. Australasian Accounting Business & Finance Journal