
Dynamics of Nitrate- Nitrogen of Poultry and Sheep Manures Amended Degraded Ultisols in Ihiagwa, Southeastern, Nigeria.
- Saka Habeebah Adewunmi
- Uzoho Bethel Ugochukwu
- Ahukaemere Chioma Mildred
- Nkwopara Ugochukwu Nnamdi
- 59-72
- Sep 5, 2023
- IJRSI +1 more
Dynamics of Nitrate- Nitrogen of Poultry and Sheep Manures Amended Degraded Ultisols in Ihiagwa, Southeastern, Nigeria.
*Saka Habeebah Adewunmi, Uzoho Bethel Ugochukwu, Ahukaemere Chioma Mildred and Nkwopara Ugochukwu Nnamdi
Department of Soil Science and Technology, PMB 1526, School of Agriculture and Agricultural Technology, Federal University of Technology, Owerri, Imo State, Nigeria
DOI: https://doi.org/10.51244/IJRSI.2023.10806
Received: 25 June 2023; Revised: 01 August 2023; Accepted: 09 August 2023; Published: 05 September 2023
ABSTRACT
Nitrogen is the most important nutrient element whose deficiencies have been widely reported and constitute crop most limiting factors in the tropics. This experiment was a 3 × 3 factorial arranged in randomized complete block design, replicated three times. The rates equivalent of 0, 30 and 60 % N of both poultry and sheep manures were incorporated. Nitrate- nitrogen (NO3–– N) was determined from four soil depths (0 – 5, 5 – 10, 10 – 20 and 20 – 40 cm) at different weeks (1, 2, 3, 4, 6, 8 and 12 weeks) after manures application (WAMA) in early and late seasons of 2019 and 2020. Soil NO3–– N was different with poultry and sheep manures rates only and the interaction of both manures at various soil depths, seasons and years. Concentrations of NO3–– N in most soil depths at both seasons and years were better with 30 % then 60 % N of poultry and sheep manures alone and with interactions of both manures (P30S60) better than single incorporation. Averaged over soil depths and seasons after manure applications, the soil NO3–– N was higher in late than early seasons and in 2020 than 2019. The result showed that NO3–– N decreased with increase in soil depth. Averaged over soil depths, manure rates, seasons and years, concentrations of NO3–– N varied and better at 12th week after manure application for 2019, but first week in 2020. Consequently, this research revealed that addition of poultry and sheep manures improved soil NO3–– N than the control with integration better than single dose. Further study is recommended to illuminate this fact.
Key words; Dynamics, nitrate- nitrogen, poultry manure, sheep manure, Ultisol
INTRODUCTION
Nitrogen (N) is the most important nutrient elements whose deficiencies have been widely reported and constitute crop most limiting factors in the tropics [25]. It also plays significant roles in soil and water pollution as well as in global warming phenomenon and as such of serious environmental concern [38]. The forms in the soil include organic and inorganic [5] but could be transformed into one another through certain biochemical processes. Due to their complex chemistry, variations often exist in their solubility, availability, activity and functions with the extent depending on the individual development, carbohydrate utilization, protein and chlorophyll synthesis in plants [44]. Its environmental impact includes eutrophication of surface and groundwater systems, soil acidification and global warming through emission of nitrous oxide, a potent greenhouse gas ([4], [12], [17], [22]).
The organic forms include proteins, amino sugars, nucleic and amino acids while the inorganic forms consist of ammonium and nitrate- nitrogen, with the former being about 90 and the later 2% of total soil N ([8], [44]). Whereas the organic form could be transformed through a mineralization process into the inorganic form, the inorganic could be converted into organic through an immobilization process. Inorganic N (NH4+– N and NO3–– N) constitutes the fraction usually utilized by plants and microbes. Usually, amount and forms of mineralized inorganic N available in soil solution often varies with time.
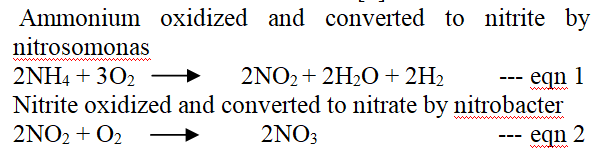
Nitrification is the conversion of ammonium ions to nitrate by autothrophic bacteria [39]. It describes the oxidation of ammonium (NH4+) or ammonia (NH3) to nitrate by living organisms and is a primary activity within the nitrogen (N) cycle. The oxidation of ammonium to nitrate is a two-step process involving the transformation of ammonia or ammonium to nitrite and the conversion of nitrite to nitrate [3].
Nitrite is toxic to plants and animals while Nitrate is negatively charged anion. It moves with soil water and can easily be leached or lost through denitrification [45]. Nitrification occurs at pH between 5.5 and 10 with optimum being around pH 7 [21]. Nitrification in soil converts relatively immobile NH4+– N to highly mobile NO3–– N and this has implications on N – use efficiency by Agricultural systems [36]).
Nitrification is affected by such factors as soil temperature, moisture, pH, NH4+ concentration, and the presence of nitrification inhibitors, aeration [36]. Generally, nitrification rates increase with temperatures from 0 – 30 oC. The activities of nitrifying bacteria cease below 0 oC and perform very slowly when the soil temperature is below 5 oC. The optimum temperature for nitrification is between 20 – 30 oC. Increase temperature above 30 oC increases the volatilization of NH3 [13]. The optimum soil moisture content for nitrifying bacteria is about the same as the optimum moisture for plant growth. The optimum moisture for nitrification differs slightly among soils with the rate declining as soil moisture decreases. Nitrification generally increased with soil pH over the range of 4.9 – 7.2 [45].
Understanding the form of N, amount and the biochemical processes involved in the release is essential in planning nutrient application to synchronize peak plant uptake with nutrient release. This will help minimize nutrient losses, promote crop yield and ensure manure use efficiency. Manure is a tool to improving the nutrient composition of the soil. Manure has been used for improving soil reaction, fertility and increasing crop productivity but a dearth of knowledge on the use of integration of poultry and sheep manures necessitated this study. The objective of this study was to determine the dynamics of nitrate – nitrogen at varying soil depths and periods after manure incorporation.
MATERIALS AND METHODS
Location of the Study
The study was carried out at the Teaching and Research farm of Federal University of Technology, Owerri, Imo State on Latitudes 5° 05ˈ and 5° 23ˈ N and Longitudes 7° 02ˈ and 7° 21ˈ E in the humid rain forest agro-ecological zone of Nigeria. Its mean annual rainfall, mean monthly temperature and relative humidity were 2,500 mm, 32 °C and 85 % respectively [19]. Geographical positioning system (GPS) equipment was used to determine site specific coordinates which were Latitude 50 22ʹ 55ʹʹ and N Longitude 60 59ʹ 44ʹʹ E, Latitude 50 22ʹ 23ʹʹ and N Longitude 60 59ʹ 26ʹʹ E, Latitude 50 22ʹ and 54ʹʹ N Longitude 60 59ʹ 32ʹʹ E and Latitude 50 22ʹ 48ʹʹ and N Longitude 60 59ʹ 29ʹʹ E for the first, second, third and fourth locations respectively.
Soil and Manure Sampling
Initial soil samples were collected from 0 – 5, 5 – 10, 10 – 20 and 20 – 40 cm depths in each location while post-treatment soil samples were collected per treatment plots from same depths as the former at various intervals (1, 2, 3, 4, 6,8 and 12 weeks) treatment applications in the early and late seasons of 2019 and 2020. These intervals consisted of weekly in the first month, bi-weekly in the second and ones in the third month after treatment applications and given a total of seven samplings per season (location). Both the initials and post treatments soil samples collected were prepared by air drying, sieving using a 2 mm diameter mesh and the fine earth fractions stored ready for laboratory analyses. The poultry and sheep manures were oven dried at 103 oC for 12 hours and ground using wiley and these were digested using double acid.
Laboratory Analyses
Manures, Initials and Post Treatment Soil Analyses
The poultry and sheep manures, initials and post treatment soil samples were subjected to laboratory analyses using standard methods. The initial soil samples were analyzed for particle size fractions after dispersion with calgon [14], pH in 1: 2.5 sample/ water ratio using the glass electrode pH meter, EC [35], total N [29], NH4+– N and NO3–– N [18]. Also, post treatment soil samples were analyzed for NO3–– N using the methods as above.
Statistical Analysis
All data generated were subjected to Analysis of Variance (ANOVA) and means separated using Fisher’s Protected Least Significant Difference Test at 5 % level of probability. All analyses were computed using Genstat Statistical package (discovery edition 12 software) [15].
RESULTS
- Properties of manures used for the study.
Table 1 showed chemical properties of the poultry and sheep manures used for this study. The manures were alkaline [33] with a pH of 7.8 and suggesting promoting soil pH on application [16], [20], [24]). Electrical conductivity was higher in poultry (14.23) than sheep (9.45 dS m-1) indicating the tendency of high salt concentration in the former than later. The total sodium contents of poultry and sheep manures were 0.89 and 0.79 g kg-1 respectively indicating more than 10 % higher in the former. Concentrations of nutrients such as N, P and K were higher in poultry manure while Ca, Mg and organic carbon were higher in sheep manure indicating variation in the nutrient contributions to the soils. The nutrients and pH concentrations in the manures in Table 1 in relation to the soil in Table 2 indicates that the application to the soil could promote it. [33] classified pH range of between 7.4 – 7.8 as mildy alkaline and suggesting that the manures were alkaline in reaction. It is well known that chicken manure has higher nutritional value than sheep manure [1].
Table 1: Properties of Poultry and Sheep Manures Used for the Study.
| Chemical | Poultry | Sheep |
| Properties | Manures | |
| PH | 7.8 | 7.8 |
| EC (dS m-1) | 14.23 | 9.45 |
| Total nitrogen (g kg-1) | 89.66 | 83.36 |
| Total – phosphorus (g kg-1) | 4.68 | 4.22 |
| Total potassium (g kg-1) | 9.13 | 8.93 |
| Total sodium (g kg-1) | 0.89 | 0.79 |
| Total – calcium (g kg-1) | 6.89 | 6.92 |
| Total magnesium (g kg-1) | 5.64 | 5.69 |
| Organic carbon (g kg-1) | 298.98 | 515.44 |
| Carbon: Nitrogen | 3.34 | 6.18 |
| Exchangeable acidity (cmol+ kg-1) | 0.6 | 0.6 |
The EC values of both manures were above 3.2 dS m-1 classified as very strongly saline by [23]. Its higher value in poultry manure than sheep manure could be due to the high soluble salt contents and as such might increase salt contents of applied soils. Other researchers have also noted high EC values of poultry manure than cattle and goat manures ([6], [7], [37]; [41]). The high sodium content of poultry manure than sheep manure could be responsible for its high EC value.
Nutrient concentrations especially total N, P and K were higher in poultry than sheep manure with the values equivalent to 89.66, 4.68 and 9.13 g kg-1 in poultry manure and 83.36, 4.22 and 8.93 g kg-1 for sheep manure. This corroborated the work of [41], who stated that the fertility status of the soil proved to be beneficial, with poultry manure than any other organic manure in his research. Hence, sheep manure was higher in calcium, magnesium and organic carbon with values equivalent to 6.92, 5.69 and 515.44 g kg-1 in sheep and 6.89, 5.64 and 298.98 g kg-1 in poultry manure. Mixing manure with sandy soils help to retain moisture levels. Manure produces increased soil carbon, which is an important source of energy that makes nutrients available to plants. It reduced runoff and leaching of nitrates in the soil [32]. Manure was quickly decomposed under warm, moist soil conditions [9] and this would increase the rate of mineralization.
Variations in composition of poultry and sheep manures could be due to differences in dietary intake. Sheep diet was composed of roughages while poultry consisted mainly of concentrates. Sheep manure application improves soil properties through improving physiochemical and biological conditions of the soil. Sheep manure increased soil available N and improved plant N status. The impact of diet in the manures was demonstrated by the high organic carbon and C: N contents of sheep relative to poultry manure due to its carbonaceous nature [32]. A C: N ratio of less than 30 had been noted to portend net N mineralization of soils [39] indicating the ability of the manures to promote soil N contents. Generally, these manures properties presented in Table 1 suggested their ability to improve soil fertility on application.
Some physico- chemical properties of the soil used for the study
The Physico- chemical properties of the studied soils in early and late seasons in 2019 and 2020 were presented in Tables 2a and 2b, respectively. In Table 2a, sand, silt and clay contents trends were 682.00 – 701.00, 41.00 – 48.00 and 25.70 – 28.80 and 726.00 – 741.00, 18.00 – 26.00 and 23.80 – 25.30 g kg-1 in early and late seasons of 2019, respectively. In both seasons, distribution of the various soil particles were erratic with soil depths and with mean concentrations being an increasing order of sand > clay > silt, texture of the soils between sandy loam and loam sandy in early and late seasons, respectively.
Table 2b revealed that ranges of sand, silt and clay were respectively 886.00 – 912.00, 42.00 – 72.00 and 28.00 – 62.00 (early season) and 884.00 – 902.00, 54.00 – 62.00 and 40.00 – 62.00 g kg-1 (late season), with their distributions down soil depths erratic for all fractions in the early season and increase for sand, decrease for silt and erratic for clay in late season. In both seasons and years, mean soil fractions decreased in the order sand > silt > clay with sand better than others. Generally, texture of the soils in both years (2019 and 2020) and seasons (early and late), was dominantly sandy, probably due to the nature of the parent material which is Coastal plain sand [42]. In each season, sand content decreased while clay increased with soil depths and with trend of clay being due to illuviation process. Sandiness of the soils signifies high tendency of nutrient leaching and poor soil fertility which would retard plant growth. It has been noted that the coarser the soil fractions, the higher the water and nutrient transmissible pores and the greater the tendency for nutrient leaching [11].
Table 2a (2019) presented that Soil pH, EC, TN, NH4+– N, NO3–-N ranged respectively from 4.10 – 4.80, 0.10 – 0.20 dS m-1, 1.99 – 2.07 g kg-1, 118.50 – 126.50 mg kg-1 and 11.21 – 11.73 mg kg-1 (early season) and 4.4 – 4.6,
Table 2a: Some physico- chemical properties of the soil used for the study in 2019.
| Physico chemical properties | Wet Season 2019 | Dry Season 2019 | ||||||||
| Soil Depths (cm) | Soil Depths (cm) | |||||||||
| 0 – 5 | 0 – 10 | 10 – 20 | 20 – 40 | Mean | 0 – 5 | 0 – 10 | 10 – 20 | 20 – 40 | Mean | |
| Sand (g kg-1) | 682 | 680 | 701 | 684 | 686.75 | 726 | 741 | 738 | 728 | 733.25 |
| Silt (g kg-1) | 46 | 41 | 42 | 48 | 44.25 | 21 | 18 | 24 | 26 | 22.25 |
| Clay (g kg-1) | 27.2 | 27.1 | 25.7 | 28.8 | 27.2 | 25.3 | 24.1 | 23.8 | 24.6 | 24.45 |
| Textural Class | sandy loam | Loamy sand | ||||||||
| pH | 4.8 | 4.4 | 4.1 | 4.5 | 4.45 | 4.6 | 4.5 | 4.4 | 4.5 | 4.5 |
| EC (d Sm-1) | 0.2 | 0.2 | 0.2 | 0.1 | 0.175 | 0.3 | 0.3 | 0.2 | 0.2 | 0.25 |
| Total N (g kg-1) | 1.99 | 2.07 | 2.05 | 1.99 | 2.025 | 1.79 | 1.7 | 1.77 | 1.71 | 1.7425 |
| NH4+– N (mg kg-1) | 124.6 | 118.5 | 123.8 | 126.5 | 123.35 | 116.3 | 118.8 | 120 | 119.2 | 118.58 |
| NO3 –– N (mg kg-1) | 11.66 | 11.21 | 11.42 | 11.73 | 11.505 | 10.56 | 10.7 | 10.89 | 10.72 | 10.718 |
Table 2b: Some physico- chemical properties of the soil used for the study.
| Physico chemical properties | Wet Season 2020 | Dry Season 2020 | ||||||||
| Soil Depths (cm) | Soil Depths (cm) | |||||||||
| 0 – 5 | 0 – 10 | 10 – 20 | 20 – 40 | Mean | 0 – 5 | 0 – 10 | 10 – 20 | 20 – 40 | Mean | |
| Sand (g kg-1) | 906 | `1 | 912 | 886 | 886 | 884 | 894 | 902 | 891.50 | |
| Silt (g kg-1) | 66 | 48 | 42 | 72 | 57.00 | 62 | 58 | 58 | 54 | 58.00 |
| Clay (g kg-1) | 28 | 52 | 42 | 62 | 46.00 | 52 | 62 | 40 | 48 | 50.50 |
| Textural Class | Sand | Loamy sand | ||||||||
| pH | 4.53 | 4.87 | 4.76 | 4.45 | 4.65 | 4.03 | 4.07 | 4.23 | 4.33 | 4.17 |
| EC (d Sm-1) | 0.4 | 0.4 | 0.3 | 0.2 | 0.33 | 0.3 | 0.3 | 0.2 | 0.2 | 0.25 |
| Total N (g kg-1) | 0.8 | 0.7 | 0.7 | 0.6 | 0.70 | 0.9 | 1.1 | 0.9 | 0.8 | 0.93 |
| NH4+– N (mg kg-1) | 124.6 | 118.5 | 123.8 | 126.5 | 123.35 | 116.3 | 118.8 | 120 | 119.2 | 118.58 |
| NO3 –– N (mg kg-1) | 11.66 | 11.21 | 11.42 | 11.73 | 11.51 | 10.56 | 10.7 | 10.89 | 10.72 | 10.72 |
0.20 – 0.20 dS m-1, 1.70 – 1.79 g kg-1, 118.80 – 120.00 mg kg-1 and 10.56 – 10.89 mg kg-1 (late season) (Table 4.2a). While the ranges in 2020 (Table 2b) were 4.45 – 4.87, 0.20 – 0.40 dS m-1, 0.60 – 0.80 g kg-1, 52.70 – 92.63 mg kg-1 and 27.22 – 50.39 mg kg-1 in the early season and 4.03 – 4.33, 0.20 – 0.30 dS m-1, 0.80 – 1.10 g kg-1, 71.08 – 83.44 mg kg-1 and 53.11 – 66.43 mg kg-1 in the late season (Table 2a). The values for soil pH indicated that they were slightly to moderately acidic ([2], [40]) with the degree greater down soil depth, probably due to its poor organic matter content.
It has been reported that the poorer the soil organic matter, the higher the soil acidity [16], decaying organic matter produces H+ which is responsible for acidity. In both season and years, values of the soil pH were below 5.0. This shows that the soils may suffer from aluminum toxicity [30]. However, lower values than pH 5 suggested that all volatile fatty acids were evaporated and this would be constrained by high acidity and poor fertility status [31]. In both seasons in 2019, the pH decreased down soil depth up till 10 – 20 cm probably due to depressed organic matter content that has been noted in soil which is increasingly related to its pH [34] while that of 2020 were erratic.
Mean pH of the soils were 4.45, 4.50, 4.65 and 4.17 in early and late seasons of 2019 and 2020 respectively, giving a range of 4.17 – 4.65. This showed that the soils were slightly acidic [2] and might suffered from aluminum toxicity since this occurs in soils with pH less than 5.00 and increases in intensity as the value decreases below this value [43]. The electrical conductivity decreased with depth with mean values varying as 0.18 – 0.25 d Sm-1 in early and late seasons of 2019 and 0.25 – 0.33 d Sm-1 also in early and late seasons of 2020. The range of 0.18 – 0.33 d Sm-1 indicates low salt content of the soils and this might not constitute a threat to its productivity.
Distribution of total N down soil depth was irregular in the early and late seasons of 2019 but decreased with depth in both seasons in 2020. Mean values were 1.74 – 2.03 and 0.70 – 0.93 g kg-1 in early and late seasons of 2019 and 2020 respectively, with those of 2019 greater than 2020. Mean concentrations of both seasons and years were low compared to the critical value of 12.50 g kg-1 for Southeastern Nigerian soils [10], indicating N deficiency in the soils. Mean NH4+– N in early and late seasons were 123.35 and 118.50 and 75.11 and 78.57 mg kg-1 while NO3–– N were 11.51 and 10.72 and 38.61 and 58.02 mg kg-1 in 2019 and 2020 respectively. The values of NH4+– N were greater than NO3–– N in both seasons and years; this might be due to poor nitrification process associated with poor environmental conditions. According to [26], high NH4+– N over NO3–– N could be due to low microbial population, poor aeration and high soil acidity. In both, nutrients were better in 2019 than 2020 due to high organic matter, poor leaching by rainfall in the former than later seasons and years, distributions of both NH4+– N and NO3–-N decreased with soil depth, probably due to low organic matter content down soil depth.
Nitrate-Nitrogen (NO3––N)
Soil nitrate nitrogen varied with rates of manure application. Addition of P30 and P60 poultry manures only, increased soil NO3–– N relative to the control in respectively early and late seasons at 5 – 10 and 0 – 5, 5 – 10 and 20 – 40 cm depths (2019) and 0 – 5 and 20 – 40 cm and 0 – 5 and 5 – 10 cm depths (2020) in 1st WAMA, 5 – 10, 10 – 20 and 20 – 40 cm and 5 – 10 cm (2019) and 0 – 5 and 5 – 10 cm and 0 – 5 and 5 – 10 cm (2020) respectively in 2nd WAMA, 0 – 5, 5 – 10, 10 – 20 and 20 – 40 and 0 – 5, 5 – 10 and 10 – 20 cm (2019) and 5 – 10, 10 – 20 and 20 – 40 and 0 – 5, 5 – 10, 10 – 20 and 20 – 40 cm (2020) in 3rd WAMA, 0 – 5 cm and 0 – 5, 5 – 10, 10 – 20 and 0 – 40 cm (2019) and 0 – 5, 5 – 10, 10 – 20 and 20 – 40 and all depths (2020) in 4th WAMA. It also includes 5 – 10 cm and all depths (2019) and 5 – 10, 10 – 20 and 20 – 40 and 0 – 5, 10 – 20 and 20 – 40 cm (2020) in 6th WAMA, 5 – 10, 10 – 20 and 20 – 40 and 5 – 10 and 20 – 40 cm (2019) and 10 – 20 and 20 – 40 and all depths (2020) in 8th WAMA and finally all depths in early and late seasons (2019) and 10 – 20 and 20 – 40cm and all depths in late season (2020).
Amongst all seasons of the year, poultry manure rates and weeks after application, highest and least soil NO3–– N were P30 (100.67 mg kg-1) at 0 – 5cm depths in early season of 2020 at 1st WAMA and P60 (11.17 mg kg-1) at 0 – 5cm depth in early season of 2019 at 6th WAMA respectively. However, among soil depths, highest and least NO3–– N concentrations were at 0 – 5 and 20 – 40 cm soil depths and indicating a decrease with soil depths with most manure rates, seasons of the years and weeks after application. Averaged over manure rates and soil depths, mean concentrations varied in early and late season respectively as 11.52 and 12.46 mg kg-1 (2019) and 50.96 and 70.77 mg kg-1 (2020) in 1st WAMA, 12.99 and 12.33 (2019) and 46.72 and 61.43 mg kg-1 (2020) in 2nd WAMA, 11.90 and 12.39 (2019) and 37.04 and 55.20 mg kg-1 (2020) in 3rd WAMA, 12.33 and 12.73 mg kg-1 (2019) and 30.73 and 49.56 mg kg-1 (2020) in 4th WAMA, 11.29 and 12.24 (2019) and 54.39 and 70.03 mg kg-1 (2020) in 6th WAMA, 12.65 and 12.59 mg kg-1 (2019) and 48.92 and 65.79 mg kg-1 (2020) in 8th WAMA and 13.03 and 12.76 mg kg-1 (2019) and 45.72 and 62.59 mg kg-1 (2020) in 12th WAMA. This showed an increase from the 1st to the 12th WAMA in early season of 2019 except in the 3rd and 6th WAMA with minor decreases from previous weeks, decrease from the 1st to 2nd followed by increase in the 3rd to 4th and another decrease in the 6th plus a final increase till the 12th WAMA in late season of 2019. It also decreased from 1st to 4th followed by increase in the 6th and another decrease from 8th till the 12th WAMA in early and late seasons of 2020. Also, concentrations were better in late (12.50 and 62.19 mg kg-1) than early seasons (12.24 and 44.92 mg kg-1) of both years and in the year 2020 than 2019. The NO3–– N could be lost from the soil during early seasons as a result of denitrification of NO and N2(g) to the atmosphere and leaching below the root zone of the crops [28].
Also, concentrations increased with S30 and S60 rates of sheep manures only relative to the control at all depths in early and 5 – 10, 10 – 20 and 20 – 40 cm depths in late seasons of 2019 and 0 – 5, 10 – 20 and 20 – 40 cm in early and all depths in late season of 2020 in 1st WAMA, 0 – 5 and 5 – 10 cm in early and late seasons of 2019 and all depths in early and late seasons of 2020 in 2nd WAMA, no depth in early and 0 – 5, 5 – 10 and 10 – 20 cm depths in late season of 2019 and 5 – 10,10 – 20 and 20 – 40 cm in early and late seasons of 2020 in 3rd WAMA, all depths in early and 0 – 5 and 20 – 40 cm in late seasons of 2020 in 4th WAMA, 10 – 20cm in early and 5 – 10, 10 – 20 and 20 – 40 cm in late seasons of 2019 and all depths in early and late seasons of 2020 in 6th WAMA, 5 – 10 and 20 – 40 cm in early and all depths in late seasons of 2019 and all seasons in early and late seasons of 2020 in 8th WAMA and 0 – 5 and 10 – 20 in early in all polling stations in 2019 and all depths in early and late seasons of 2020 in 12th WAMA.
| Table 3: Nitrate- Nitrogen at various Soil Depths and Weeks After Manure Application (WAMA) in Wet and Dry Seasons of 2019 and 2020. | ||||||||||||||||
| Years and Seasons | 2019 a | 2019 b | 2020 a | 2020 b | ||||||||||||
| Soil Depths | 1 | 2 | 3 | 4 | 1 | 2 | 3 | 4 | 1 | 2 | 3 | 4 | 1 | 2 | 3 | 4 |
| Manure Rates | First Week After Manure Application | |||||||||||||||
| P0S0 | 11.54 | 11.48 | 11.10 | 11.26 | 12.91 | 12.06 | 12.01 | 11.77 | 46.73 | 42.40 | 11.50 | 18.89 | 71.90 | 67.20 | 33.53 | 41.20 |
| P0S30 | 11.73 | 11.73 | 11.49 | 11.48 | 12.86 | 12.11 | 12.21 | 12.19 | 53.79 | 62.80 | 73.13 | 64.36 | 81.30 | 88.00 | 84.90 | 79.70 |
| P0S60 | 11.82 | 11.82 | 11.42 | 11.40 | 13.01 | 12.36 | 12.52 | 12.47 | 50.31 | 46.50 | 40.68 | 42.87 | 75.70 | 71.80 | 63.71 | 62.90 |
| Mean | 11.70 | 11.68 | 11.34 | 11.38 | 12.93 | 12.18 | 12.25 | 12.14 | 50.28 | 50.57 | 41.77 | 42.04 | 76.30 | 75.67 | 60.71 | 61.27 |
| P30S0 | 11.69 | 11.69 | 11.26 | 11.34 | 12.98 | 12.08 | 12.17 | 12.16 | 88.59 | 80.80 | 17.94 | 39.54 | 106.90 | 73.60 | 41.29 | 56.30 |
| P30S30 | 11.74 | 11.75 | 11.33 | 11.38 | 12.94 | 12.45 | 12.32 | 12.31 | 68.61 | 50.90 | 34.00 | 78.76 | 78.10 | 106.00 | 39.05 | 55.50 |
| P30S60 | 11.64 | 11.64 | 11.33 | 11.32 | 13.12 | 12.04 | 12.17 | 12.14 | 95.68 | 80.20 | 55.04 | 45.24 | 117.00 | 101.40 | 80.33 | 60.50 |
| Mean | 11.69 | 11.69 | 11.31 | 11.35 | 13.01 | 12.19 | 12.22 | 12.20 | 84.29 | 70.63 | 35.66 | 54.51 | 100.67 | 93.67 | 53.56 | 57.43 |
| P60S0 | 11.68 | 11.68 | 11.36 | 11.43 | 13.22 | 12.86 | 12.47 | 12.38 | 49.61 | 53.00 | 12.03 | 35.52 | 74.90 | 77.90 | 37.03 | 55.50 |
| P60S30 | 11.71 | 11.71 | 11.21 | 11.28 | 13.11 | 12.51 | 12.44 | 12.40 | 91.17 | 73.30 | 13.18 | 49.93 | 112.80 | 98.30 | 34.97 | 60.50 |
| P60S60 | 11.70 | 11.70 | 11.37 | 11.35 | 12.89 | 12.66 | 12.16 | 12.12 | 50.31 | 48.50 | 16.87 | 51.97 | 75.20 | 73.40 | 48.49 | 61.40 |
| Mean | 11.70 | 11.70 | 11.31 | 11.35 | 13.07 | 12.68 | 12.36 | 12.30 | 63.70 | 58.27 | 14.03 | 45.81 | 87.63 | 83.20 | 40.16 | 59.13 |
| S0 | 11.64 | 11.62 | 11.24 | 11.34 | 13.04 | 12.33 | 12.22 | 12.10 | 61.64 | 58.73 | 13.82 | 31.32 | 84.57 | 72.90 | 37.28 | 51.00 |
| S30 | 11.73 | 11.73 | 11.34 | 11.38 | 12.97 | 12.36 | 12.32 | 12.30 | 71.19 | 62.33 | 40.10 | 64.35 | 90.73 | 97.43 | 52.97 | 65.23 |
| S60 | 11.72 | 11.72 | 11.37 | 11.36 | 13.01 | 12.35 | 12.28 | 12.24 | 65.43 | 58.40 | 37.53 | 46.69 | 89.30 | 82.20 | 64.18 | 61.60 |
| LSDs (0.05) P | 7.77 | 7.84 | 3.74 | 4.44 | 4.98 | 7.71 | 4.31 | 19.58 | 4.82 | 8.39 | 0.61 | 1.41 | 8.32 | 8.80 | 4.77 | 7.05 |
| ” S | 7.77 | 7.84 | 3.74 | 4.44 | 4.98 | 7.71 | 4.31 | 19.58 | 4.82 | 8.39 | 0.61 | 1.41 | 8.32 | 8.80 | 4.77 | 7.05 |
| ‘ P x S | 13.47 | 13.58 | 6.47 | 7.69 | 8.63 | 13.35 | 7.46 | 33.92 | 8.35 | 14.53 | 1.06 | 2.43 | 14.41 | 15.25 | 8.26 | 12.21 |
| Second Week After Manure Application | ||||||||||||||||
| P0S0 | 12.68 | 12.85 | 12.83 | 12.82 | 13.20 | 12.48 | 11.79 | 11.75 | 44.79 | 44.82 | 13.53 | 13.43 | 50.40 | 51.73 | 36.07 | 33.36 |
| P0S30 | 13.08 | 13.12 | 12.98 | 12.92 | 13.10 | 12.52 | 11.96 | 11.98 | 86.32 | 82.94 | 30.05 | 31.80 | 94.30 | 96.99 | 44.99 | 45.39 |
| P0S60 | 12.98 | 12.99 | 13.06 | 13.01 | 12.14 | 12.14 | 12.14 | 12.17 | 63.60 | 57.59 | 34.27 | 37.34 | 74.90 | 74.86 | 45.50 | 46.92 |
| Mean | 12.91 | 12.99 | 12.96 | 12.92 | 12.81 | 12.38 | 11.96 | 11.97 | 64.90 | 61.78 | 25.95 | 27.52 | 73.20 | 74.53 | 42.19 | 41.89 |
| P30S0 | 12.93 | 12.96 | 13.07 | 13.08 | 13.18 | 12.76 | 11.91 | 11.94 | 47.10 | 40.77 | 15.74 | 17.89 | 62.40 | 57.73 | 33.55 | 37.85 |
| P30S30 | 12.84 | 13.17 | 13.09 | 13.06 | 13.21 | 12.54 | 11.86 | 11.95 | 89.24 | 85.17 | 23.37 | 27.46 | 95.90 | 99.39 | 39.99 | 45.03 |
| P30S60 | 13.15 | 13.20 | 13.03 | 13.04 | 13.02 | 12.49 | 11.95 | 11.97 | 89.26 | 88.81 | 16.07 | 19.14 | 95.20 | 103.75 | 35.62 | 37.38 |
| Mean | 12.97 | 13.11 | 13.06 | 13.06 | 13.14 | 12.60 | 11.91 | 11.95 | 75.20 | 71.58 | 18.39 | 21.50 | 84.50 | 86.96 | 36.39 | 40.09 |
| P60S0 | 12.53 | 13.07 | 13.12 | 13.11 | 12.11 | 12.26 | 11.88 | 11.98 | 61.71 | 57.81 | 14.87 | 19.56 | 76.90 | 70.04 | 38.15 | 39.47 |
| P60S30 | 12.76 | 13.01 | 12.94 | 12.92 | 13.02 | 12.52 | 12.01 | 12.03 | 69.99 | 66.33 | 52.12 | 47.79 | 86.30 | 83.18 | 62.40 | 59.03 |
| P60S60 | 12.84 | 13.13 | 13.13 | 13.11 | 13.25 | 12.62 | 11.98 | 11.97 | 81.64 | 77.55 | 19.50 | 12.50 | 82.80 | 93.26 | 39.41 | 41.40 |
| Mean | 12.71 | 13.07 | 13.06 | 13.05 | 12.79 | 12.47 | 11.96 | 11.99 | 71.11 | 67.23 | 28.83 | 26.62 | 82.00 | 82.16 | 46.65 | 46.63 |
| S0 | 12.71 | 12.96 | 13.01 | 13.00 | 12.83 | 12.50 | 11.86 | 11.89 | 51.20 | 47.80 | 14.71 | 16.96 | 63.23 | 59.83 | 35.92 | 36.89 |
| S30 | 12.89 | 13.10 | 13.00 | 12.97 | 13.11 | 12.53 | 11.94 | 11.99 | 81.85 | 78.15 | 35.18 | 35.68 | 92.17 | 93.19 | 49.13 | 49.82 |
| S60 | 12.99 | 13.11 | 13.07 | 13.05 | 12.80 | 12.42 | 12.02 | 12.04 | 78.17 | 74.65 | 23.28 | 22.99 | 84.30 | 90.62 | 40.18 | 41.90 |
| LSDs (0.05) P | 4.62 | 4.52 | 11.59 | 13.76 | 2.94 | 14.52 | 9.54 | 7.32 | 2.09 | 1.22 | 1.10 | 2.60 | 6.69 | 3.78 | 3.38 | 4.88 |
| ” S | 4.62 | 4.52 | 11.59 | 13.76 | 2.94 | 14.52 | 9.54 | 7.32 | 2.09 | 1.22 | 1.10 | 2.60 | 6.69 | 3.78 | 3.38 | 4.88 |
| ‘ P x S | 7.99 | 7.83 | 20.08 | 23.83 | 5.09 | 25.14 | 16.53 | 12.68 | 2.09 | 2.12 | 1.91 | 4.51 | 11.59 | 6.55 | 5.85 | 8.46 |
a = wet season, b = dry season, 1 = 0-5 cm, 2 = 5-10 cm, 3 = 10-20 cm, 4 = 20-40 cm depths, P = poultry, S = sheep and P x S = poultry and sheep manure interaction.
| Table 3 cont’d. | ||||||||||||||||
| Years and Seasons | 2019 a | 2019 b | 2020 a | 2020 b | ||||||||||||
| Soil Depths | 1 | 2 | 3 | 4 | 1 | 2 | 3 | 4 | 1 | 2 | 3 | 4 | 1 | 2 | 3 | 4 |
| Manure Rates | Third Week After Manure Application | |||||||||||||||
| P0S0 | 11.92 | 11.63 | 11.79 | 11.75 | 12.25 | 12.15 | 12.30 | 11.76 | 11.07 | 3.68 | 22.40 | 23.73 | 39.70 | 36.93 | 39.00 | 43.70 |
| P0S30 | 11.84 | 11.82 | 11.88 | 11.84 | 13.06 | 12.50 | 12.48 | 11.81 | 46.48 | 14.68 | 26.17 | 31.15 | 46.20 | 37.98 | 49.40 | 51.11 |
| P0S60 | 11.89 | 11.88 | 11.86 | 11.86 | 12.52 | 12.38 | 12.32 | 11.91 | 19.65 | 58.87 | 60.52 | 66.57 | 41.00 | 50.08 | 80.50 | 76.57 |
| Mean | 11.88 | 11.78 | 11.84 | 11.82 | 12.61 | 12.34 | 12.37 | 11.83 | 25.73 | 25.74 | 36.36 | 40.48 | 42.30 | 41.66 | 56.30 | 57.13 |
| P30S0 | 12.04 | 12.02 | 11.99 | 12.00 | 13.11 | 12.58 | 12.42 | 11.91 | 36.44 | 16.32 | 14.46 | 10.80 | 56.30 | 39.71 | 37.70 | 30.70 |
| P30S30 | 11.91 | 11.90 | 11.89 | 11.87 | 13.17 | 12.51 | 12.45 | 11.87 | 17.12 | 43.45 | 66.31 | 73.35 | 43.70 | 63.39 | 86.30 | 83.39 |
| P30S60 | 11.85 | 11.83 | 11.84 | 11.83 | 12.77 | 12.52 | 12.48 | 11.87 | 17.21 | 20.45 | 42.96 | 48.29 | 47.10 | 40.44 | 62.90 | 68.32 |
| Mean | 11.93 | 11.92 | 11.91 | 11.90 | 13.02 | 12.54 | 12.45 | 11.88 | 23.59 | 26.74 | 41.24 | 44.15 | 49.03 | 47.85 | 62.30 | 60.80 |
| P60S0 | 12.12 | 12.10 | 12.14 | 12.14 | 12.34 | 12.26 | 12.30 | 11.85 | 60.94 | 20.53 | 17.13 | 14.22 | 73.80 | 40.94 | 37.10 | 34.18 |
| P60S30 | 11.64 | 11.90 | 11.62 | 11.60 | 13.01 | 12.52 | 12.49 | 11.81 | 22.94 | 66.06 | 70.37 | 77.67 | 46.30 | 72.61 | 83.70 | 87.64 |
| P60S60 | 12.07 | 12.03 | 12.05 | 12.04 | 13.23 | 12.76 | 12.53 | 11.71 | 52.08 | 57.72 | 38.78 | 42.77 | 63.30 | 73.99 | 58.70 | 62.73 |
| Mean | 11.94 | 12.01 | 11.94 | 11.93 | 12.86 | 12.51 | 12.44 | 11.79 | 45.32 | 48.10 | 42.09 | 44.89 | 61.13 | 62.51 | 59.83 | 61.52 |
| S0 | 12.03 | 11.92 | 11.97 | 11.96 | 12.57 | 12.33 | 12.34 | 11.84 | 36.15 | 13.51 | 18.00 | 16.25 | 56.60 | 39.19 | 37.93 | 36.19 |
| S30 | 11.80 | 11.87 | 11.80 | 11.77 | 13.08 | 12.51 | 12.47 | 11.83 | 28.85 | 41.40 | 54.28 | 60.72 | 45.40 | 57.99 | 73.13 | 74.05 |
| S60 | 11.94 | 11.91 | 11.92 | 11.91 | 12.84 | 12.55 | 12.44 | 11.83 | 29.65 | 45.68 | 47.42 | 52.54 | 50.47 | 54.84 | 67.37 | 69.21 |
| LSDs (0.05) P | 7.00 | 7.67 | 7.58 | 9.92 | 2.68 | 16.28 | 14.20 | 3.38 | 5.04 | 1.31 | 3.30 | 1.66 | 5.49 | 5.11 | 5.87 | 4.05 |
| ” S | 7.00 | 7.67 | 7.58 | 9.92 | 2.68 | 16.28 | 14.20 | 3.38 | 5.04 | 1.31 | 3.30 | 1.66 | 5.49 | 5.11 | 5.87 | 4.05 |
| ‘ P x S | 12.13 | 13.28 | 13.12 | 17.18 | 4.63 | 28.20 | 24.59 | 5.85 | 8.74 | 2.27 | 5.71 | 2.87 | 9.51 | 8.85 | 10.17 | 7.01 |
| Fourth Week After Manure Application | ||||||||||||||||
| P0S0 | 12.49 | 13.23 | 13.19 | 13.23 | 12.58 | 12.60 | 12.60 | 12.52 | 19.32 | 19.95 | 15.07 | 17.75 | 32.63 | 32.83 | 34.97 | 37.65 |
| P0S30 | 13.27 | 13.36 | 13.30 | 13.36 | 12.58 | 12.67 | 12.71 | 12.64 | 17.20 | 12.93 | 19.46 | 16.12 | 37.10 | 48.78 | 39.36 | 35.99 |
| P0S60 | 13.29 | 13.40 | 13.40 | 13.41 | 12.72 | 12.72 | 12.60 | 12.67 | 21.77 | 35.48 | 33.09 | 28.79 | 35.89 | 36.52 | 53.06 | 48.69 |
| Mean | 13.02 | 13.33 | 13.30 | 13.33 | 12.63 | 12.66 | 12.64 | 12.61 | 19.43 | 22.79 | 22.54 | 20.89 | 35.21 | 39.38 | 42.46 | 40.78 |
| P30S0 | 13.24 | 13.32 | 13.33 | 13.40 | 12.81 | 12.79 | 12.76 | 12.73 | 34.45 | 14.34 | 16.37 | 17.47 | 54.42 | 34.31 | 36.41 | 37.44 |
| P30S30 | 13.22 | 13.21 | 13.22 | 13.25 | 12.67 | 12.74 | 12.67 | 12.76 | 12.73 | 43.77 | 71.98 | 67.99 | 41.67 | 63.67 | 82.02 | 83.29 |
| P30S60 | 13.22 | 13.31 | 13.33 | 13.31 | 12.88 | 12.85 | 12.83 | 12.78 | 16.16 | 21.72 | 39.36 | 36.04 | 36.06 | 41.69 | 59.39 | 56.01 |
| Mean | 13.23 | 13.28 | 13.29 | 13.32 | 12.79 | 12.79 | 12.75 | 12.76 | 21.11 | 26.61 | 42.57 | 40.50 | 44.05 | 46.56 | 59.27 | 58.91 |
| P60S0 | 13.32 | 13.33 | 13.32 | 13.34 | 12.86 | 12.84 | 12.83 | 12.82 | 52.89 | 23.93 | 21.59 | 17.94 | 66.13 | 43.80 | 41.63 | 37.98 |
| P60S30 | 13.22 | 13.37 | 13.38 | 13.39 | 12.79 | 12.76 | 12.76 | 12.70 | 20.02 | 57.23 | 28.18 | 24.81 | 39.92 | 73.80 | 48.14 | 44.71 |
| P60S60 | 13.31 | 13.28 | 13.29 | 13.28 | 12.82 | 12.80 | 12.80 | 12.77 | 49.36 | 52.67 | 56.12 | 52.08 | 69.26 | 69.24 | 76.09 | 72.12 |
| Mean | 13.28 | 13.33 | 13.33 | 13.34 | 12.82 | 12.80 | 12.80 | 12.76 | 40.76 | 44.61 | 35.30 | 31.61 | 58.44 | 62.28 | 55.29 | 51.60 |
| S0 | 13.02 | 13.29 | 13.28 | 13.32 | 12.75 | 12.74 | 12.73 | 12.69 | 35.55 | 19.41 | 17.68 | 17.72 | 51.06 | 36.98 | 37.67 | 37.69 |
| S30 | 13.24 | 13.31 | 13.30 | 13.33 | 12.68 | 12.72 | 12.71 | 12.70 | 16.65 | 37.98 | 39.87 | 36.31 | 39.56 | 62.08 | 56.51 | 54.66 |
| S60 | 13.27 | 13.33 | 13.34 | 13.33 | 12.81 | 12.79 | 12.74 | 12.74 | 29.10 | 36.62 | 42.86 | 38.97 | 47.07 | 49.15 | 62.85 | 58.94 |
| LSDs (0.05) P | 3.88 | 2.34 | 4.60 | 3.66 | 3.78 | 4.60 | 4.46 | 3.74 | 3.61 | 2.77 | 2.05 | 2.13 | 3.90 | 3.62 | 2.03 | 2.09 |
| ” S | 3.88 | 2.34 | 4.60 | 3.66 | 3.78 | 4.60 | 4.46 | 3.74 | 3.61 | 2.77 | 2.05 | 2.13 | 3.90 | 3.62 | 2.03 | 2.09 |
| ‘ P x S | 6.73 | 4.06 | 7.97 | 6.34 | 6.54 | 7.97 | 7.73 | 6.48 | 6.25 | 4.80 | 3.55 | 3.68 | 6.75 | 6.27 | 3.51 | 3.62 |
a = wet season, b = dry season, 1 = 0-5 cm, 2 = 5-10 cm, 3 = 10-20 cm, 4 = 20-40 cm depths, P = poultry, S = sheep and P x S = poultry and sheep manure interaction.
| Table 3 cont’d. | ||||||||||||||||
| Years and Seasons | 2019 a | 2019 b | 2020 a | 2020 b | ||||||||||||
| Soil Depths | 1 | 2 | 3 | 4 | 1 | 2 | 3 | 4 | 1 | 2 | 3 | 4 | 1 | 2 | 3 | 4 |
| Manure Rates | Sixth Week After Manure Application | |||||||||||||||
| P0S0 | 11.13 | 11.11 | 11.13 | 11.22 | 12.55 | 12.50 | 11.52 | 11.80 | 30.53 | 27.29 | 37.60 | 36.25 | 39.00 | 57.60 | 36.30 | 49.65 |
| P0S30 | 11.24 | 11.29 | 11.26 | 11.36 | 12.61 | 12.66 | 11.58 | 11.94 | 79.03 | 32.98 | 44.20 | 52.24 | 50.30 | 53.00 | 64.30 | 73.94 |
| P0S60 | 11.30 | 11.32 | 11.38 | 11.31 | 12.56 | 12.59 | 11.72 | 11.86 | 54.20 | 58.62 | 63.10 | 65.82 | 74.23 | 78.70 | 83.10 | 85.79 |
| Mean | 11.22 | 11.24 | 11.26 | 11.30 | 12.57 | 12.58 | 11.61 | 11.87 | 54.59 | 39.63 | 48.30 | 51.44 | 54.51 | 63.10 | 61.23 | 69.79 |
| P30S0 | 11.55 | 11.59 | 11.61 | 11.32 | 12.70 | 12.67 | 11.54 | 11.88 | 39.81 | 44.50 | 49.90 | 45.24 | 59.81 | 64.50 | 70.00 | 66.94 |
| P30S30 | 11.53 | 11.19 | 11.22 | 11.29 | 12.65 | 12.68 | 11.79 | 12.02 | 55.11 | 59.10 | 90.40 | 95.07 | 75.07 | 77.40 | 97.30 | 105.71 |
| P30S60 | 11.23 | 11.43 | 11.23 | 11.26 | 12.86 | 12.78 | 11.65 | 12.10 | 22.96 | 67.61 | 58.70 | 73.40 | 42.93 | 47.30 | 78.70 | 91.70 |
| Mean | 11.44 | 11.40 | 11.35 | 11.29 | 12.74 | 12.71 | 11.66 | 12.00 | 39.29 | 57.07 | 66.33 | 71.24 | 59.27 | 63.07 | 82.00 | 88.12 |
| P60S0 | 11.06 | 11.44 | 11.09 | 11.31 | 12.78 | 12.71 | 11.77 | 11.92 | 27.17 | 32.80 | 55.30 | 43.01 | 47.14 | 52.80 | 75.30 | 63.62 |
| P60S30 | 11.24 | 11.22 | 11.23 | 11.23 | 12.77 | 12.63 | 11.72 | 11.98 | 49.08 | 52.41 | 69.80 | 83.52 | 69.11 | 72.40 | 86.40 | 96.42 |
| P60S60 | 11.22 | 11.29 | 11.29 | 11.24 | 12.80 | 12.75 | 11.69 | 11.95 | 70.06 | 74.07 | 50.30 | 66.70 | 86.70 | 87.40 | 70.40 | 90.00 |
| Mean | 11.17 | 11.32 | 11.20 | 11.26 | 12.78 | 12.70 | 11.73 | 11.95 | 48.77 | 53.09 | 58.47 | 64.41 | 67.65 | 70.87 | 77.37 | 83.35 |
| S0 | 11.25 | 11.38 | 11.28 | 11.28 | 12.68 | 12.63 | 11.61 | 11.87 | 32.50 | 34.86 | 47.60 | 41.50 | 48.65 | 58.30 | 60.53 | 60.07 |
| S30 | 11.34 | 11.23 | 11.24 | 11.29 | 12.68 | 12.66 | 11.70 | 11.98 | 61.07 | 48.16 | 68.13 | 76.94 | 64.83 | 67.60 | 82.67 | 92.02 |
| S60 | 11.25 | 11.35 | 11.30 | 11.27 | 12.74 | 12.71 | 11.69 | 11.97 | 49.07 | 66.77 | 57.37 | 68.64 | 67.95 | 71.13 | 77.40 | 89.16 |
| LSDs (0.05) P | 2.89 | 38.02 | 17.80 | 6.73 | 7.09 | 7.09 | 7.42 | 4.21 | 2.50 | 4.35 | 6.89 | 2.02 | 2.64 | 9.35 | 6.73 | 4.19 |
| ” S | 2.89 | 38.02 | 17.80 | 6.73 | 7.09 | 7.09 | 7.42 | 4.21 | 2.50 | 4.35 | 6.89 | 2.02 | 2.64 | 9.35 | 6.73 | 4.19 |
| ‘ P x S | 5.01 | 65.85 | 30.84 | 11.66 | 12.27 | 12.27 | 12.85 | 7.29 | 4.32 | 7.53 | 11.93 | 3.51 | 4.58 | 16.19 | 11.65 | 7.25 |
| Eighth Week After Manure Application | ||||||||||||||||
| P0S0 | 11.26 | 12.79 | 12.89 | 12.74 | 12.65 | 12.31 | 12.48 | 12.11 | 26.01 | 29.60 | 40.30 | 39.20 | 44.98 | 42.99 | 42.60 | 39.90 |
| P0S30 | 11.38 | 13.07 | 13.21 | 12.81 | 12.62 | 12.68 | 12.73 | 12.24 | 58.35 | 52.90 | 38.60 | 44.60 | 45.97 | 50.31 | 58.70 | 64.60 |
| P0S60 | 11.31 | 13.21 | 12.81 | 13.04 | 12.73 | 12.66 | 12.68 | 12.41 | 46.86 | 52.30 | 57.40 | 60.80 | 66.96 | 72.32 | 77.40 | 80.70 |
| Mean | 11.32 | 13.02 | 12.97 | 12.86 | 12.67 | 12.55 | 12.63 | 12.25 | 43.74 | 44.93 | 45.43 | 48.20 | 52.64 | 55.21 | 59.57 | 61.73 |
| P30S0 | 11.45 | 13.38 | 13.08 | 13.02 | 12.71 | 12.52 | 12.60 | 12.54 | 34.06 | 39.20 | 51.30 | 52.70 | 54.06 | 59.15 | 66.30 | 72.60 |
| P30S30 | 11.26 | 13.36 | 13.91 | 13.21 | 12.69 | 12.51 | 12.68 | 12.46 | 49.38 | 54.70 | 81.30 | 88.70 | 69.35 | 75.08 | 71.30 | 97.30 |
| P30S60 | 11.25 | 13.27 | 13.16 | 12.84 | 12.75 | 12.71 | 12.73 | 12.85 | 21.84 | 25.90 | 46.30 | 57.30 | 45.14 | 45.88 | 94.60 | 77.30 |
| Mean | 11.32 | 13.34 | 13.38 | 13.02 | 12.72 | 12.58 | 12.67 | 12.62 | 35.09 | 39.93 | 59.63 | 66.23 | 56.18 | 60.04 | 77.40 | 82.40 |
| P60S0 | 11.32 | 13.25 | 12.97 | 12.86 | 12.54 | 12.55 | 12.54 | 12.46 | 23.46 | 29.40 | 48.30 | 59.70 | 43.43 | 51.02 | 68.30 | 65.00 |
| P60S30 | 11.25 | 13.28 | 13.16 | 13.18 | 12.73 | 12.54 | 12.45 | 12.67 | 43.32 | 46.70 | 57.80 | 69.80 | 63.35 | 66.74 | 77.70 | 89.70 |
| P60S60 | 11.23 | 13.14 | 12.88 | 13.23 | 12.70 | 12.59 | 12.61 | 12.62 | 63.43 | 69.40 | 55.30 | 45.00 | 83.45 | 89.38 | 75.30 | 79.60 |
| Mean | 11.27 | 13.22 | 13.00 | 13.09 | 12.66 | 12.56 | 12.53 | 12.58 | 43.40 | 48.50 | 53.80 | 58.17 | 63.41 | 69.05 | 73.77 | 78.10 |
| S0 | 11.34 | 13.14 | 12.98 | 12.87 | 12.63 | 12.46 | 12.54 | 12.37 | 27.84 | 32.73 | 46.63 | 50.53 | 47.49 | 51.05 | 59.07 | 59.17 |
| S30 | 11.30 | 13.24 | 13.43 | 13.07 | 12.68 | 12.58 | 12.62 | 12.46 | 50.35 | 51.43 | 59.23 | 67.70 | 59.56 | 64.04 | 69.23 | 83.87 |
| S60 | 11.26 | 13.21 | 12.95 | 13.04 | 12.73 | 12.65 | 12.67 | 12.63 | 44.04 | 49.20 | 53.00 | 54.37 | 65.18 | 69.19 | 82.43 | 79.20 |
| LSDs (0.05) P | 9.29 | 19.53 | 4.60 | 6.19 | 3.69 | 3.43 | 3.04 | 7.64 | 4.13 | 6.36 | 7.40 | 6.05 | 2.23 | 3.21 | 6.55 | 6.00 |
| ” S | 9.29 | 19.53 | 4.60 | 6.19 | 3.69 | 3.43 | 3.04 | 7.64 | 4.13 | 6.36 | 7.40 | 6.05 | 2.23 | 3.21 | 6.55 | 6.00 |
| ‘ P x S | 16.09 | 33.83 | 7.96 | 10.72 | 6.39 | 5.94 | 5.26 | 13.24 | 7.16 | 11.02 | 12.82 | 10.48 | 3.86 | 5.56 | 11.35 | 10.39 |
a = wet season, b = dry season, 1 = 0-5 cm, 2 = 5-10 cm, 3 = 10-20 cm, 4 = 20-40 cm depths, P = poultry, S = sheep and P x S = poultry and sheep manure interaction.
| Table 3 cont’d. | ||||||||||||||||
| Years and Seasons | 2019 a | 2019 b | 2020 a | 2020 b | ||||||||||||
| Soil Depths | 1 | 2 | 3 | 4 | 1 | 2 | 3 | 4 | 1 | 2 | 3 | 4 | 1 | 2 | 3 | 4 |
| Manure Rates | Twelfth Week After Manure Application | |||||||||||||||
| P0S0 | 12.06 | 13.04 | 12.81 | 12.70 | 12.09 | 12.65 | 12.65 | 12.71 | 20.90 | 25.90 | 43.20 | 46.60 | 35.60 | 35.28 | 39.00 | 36.60 |
| P0S30 | 12.91 | 13.12 | 12.88 | 12.78 | 12.25 | 12.91 | 12.91 | 12.79 | 47.30 | 46.50 | 37.20 | 44.90 | 40.90 | 45.95 | 57.30 | 64.90 |
| P0S60 | 12.95 | 13.19 | 13.15 | 12.95 | 12.42 | 12.92 | 12.94 | 12.81 | 40.90 | 45.30 | 50.40 | 54.10 | 61.00 | 65.34 | 70.30 | 74.00 |
| Mean | 12.64 | 13.12 | 12.95 | 12.81 | 12.25 | 12.83 | 12.83 | 12.77 | 36.37 | 39.23 | 43.60 | 48.53 | 45.83 | 48.86 | 55.53 | 58.50 |
| P30S0 | 12.78 | 13.38 | 12.86 | 12.95 | 12.58 | 12.76 | 12.75 | 12.78 | 33.40 | 33.80 | 47.40 | 58.90 | 53.30 | 50.38 | 67.30 | 79.00 |
| P30S30 | 13.14 | 13.34 | 12.95 | 13.16 | 12.45 | 12.91 | 12.91 | 12.68 | 40.00 | 48.00 | 55.20 | 68.00 | 60.00 | 68.00 | 75.30 | 86.30 |
| P30S60 | 13.05 | 13.27 | 13.22 | 12.80 | 12.84 | 12.84 | 12.86 | 12.81 | 21.80 | 26.20 | 57.00 | 59.60 | 45.10 | 49.46 | 77.00 | 79.60 |
| Mean | 12.99 | 13.33 | 13.01 | 12.97 | 12.62 | 12.84 | 12.84 | 12.76 | 31.73 | 36.00 | 53.20 | 62.17 | 52.80 | 55.95 | 73.20 | 81.63 |
| P60S0 | 12.98 | 13.21 | 13.07 | 12.74 | 12.46 | 12.79 | 12.81 | 12.84 | 22.10 | 28.40 | 48.20 | 56.30 | 45.30 | 48.33 | 68.30 | 76.30 |
| P60S30 | 13.82 | 13.26 | 13.06 | 13.13 | 12.66 | 12.87 | 12.89 | 12.82 | 37.00 | 44.00 | 58.00 | 65.70 | 63.60 | 64.01 | 77.90 | 85.60 |
| P60S60 | 12.96 | 13.12 | 13.22 | 13.18 | 12.65 | 12.88 | 12.88 | 12.73 | 54.70 | 61.30 | 63.30 | 54.40 | 68.00 | 81.29 | 83.20 | 74.40 |
| Mean | 13.25 | 13.20 | 13.12 | 13.02 | 12.59 | 12.85 | 12.86 | 12.80 | 37.93 | 44.57 | 56.50 | 58.80 | 58.97 | 64.54 | 76.47 | 78.77 |
| S0 | 12.61 | 13.21 | 12.91 | 12.80 | 12.38 | 12.73 | 12.74 | 12.78 | 25.47 | 29.37 | 46.27 | 53.93 | 44.73 | 44.66 | 58.20 | 63.97 |
| S30 | 13.29 | 13.24 | 12.96 | 13.02 | 12.45 | 12.90 | 12.90 | 12.76 | 41.43 | 46.17 | 50.13 | 59.53 | 54.83 | 59.32 | 70.17 | 78.93 |
| S60 | 12.99 | 13.19 | 13.20 | 12.98 | 12.64 | 12.88 | 12.89 | 12.78 | 39.13 | 44.27 | 56.90 | 56.03 | 58.03 | 65.36 | 76.83 | 76.00 |
| LSDs (0.05) P | 1.97 | 1.85 | 9.90 | 3.85 | 7.71 | 6.50 | 5.73 | 7.26 | 5.99 | 6.60 | 6.48 | 9.07 | 7.39 | 4.63 | 6.74 | 7.37 |
| ” S | 1.97 | 1.85 | 9.90 | 3.85 | 7.71 | 6.50 | 5.73 | 7.26 | 5.99 | 6.60 | 6.48 | 9.07 | 7.39 | 4.63 | 6.74 | 7.37 |
| ‘ P x S | 3.41 | 3.20 | 17.15 | 6.66 | 13.35 | 11.26 | 9.93 | 12.58 | 10.38 | 11.43 | 11.22 | 15.70 | 12.80 | 8.01 | 11.68 | 12.77 |
a = wet season, b = dry season, 1 = 0-5 cm, 2 = 5-10 cm, 3 = 10-20 cm, 4 = 20-40 cm depths, P =poultry, S = sheep and P x S = poultry and sheep manure interactions.
The Least and best concentrations were with S30 (11.23mg kg-1) at 5-10 cm depth in early season of 2019 and S30 (97.43) mg kg-1 at 5-10 cm depth in late season of 2020 respectively. Also, concentrations decreased down soil depths for most manure rates at various weeks of application in both seasons of the years. Equally, averaged over soil depths and rates of application, early and late season concentrations varied as 11.52 and 12.46 (2019) and 50.96 and 70.78 mg kg-1 (2020) in 1st WAMA, 12.99 and 12.33 (2019) and 46.72 and 61.48 mg kg-1 (2020) in 2nd WAMA, 11.90 and 12.39 mg kg-1 (2019) and 37.04 and 55.20 mg kg-1 (2020) in 3rd WAMA, 13.28 and 12.73 mg kg-1(2019) and 30.81 and 49.52 mg kg-1 (2020) in 4th WAMA, 11.29 and 12.24 mg kg-1 (2019) and 54.38 and 70.03 mg kg-1 (2020) in 6th WAMA, 13.28 and 12.78 mg kg-1 (2019) and 30.81 and 49.52 mg kg-1 (2020) in 8th WAMA and 13.03 and 12.74 mg kg-1 (2019) and 45.72 and 62.59 mg kg-1 (2020) in 12th WAMA. This showed decreased concentrations at 3rd and 6th WAMA after initial increases at other periods in early and late seasons of 2019 and increase at 6th WAMA after initial decrease at other weeks after application in both seasons of 2020. In both years, concentrations were better in late (12.52 and 59.87 mg kg-1) than early seasons (12.47 and 42.35 mg kg-1) and with 2020 better than 2019. The values of the former year were optimal while those of the later were excessive according to [27]. Equally, NO3–– N increased significantly (LSD 0.05) with integration of manure (poultry and sheep) rates relative to the control in most WAMA of both seasons of the years. Highest and least concentrations were at 0 – 5 cm depth with P30S60 (117.00 mg kg-1) in 2020 late season in 1st WAMA and 0 – 5 cm with P60S0 (11.06 mg kg-1) in 2019 early season at 6th WAMA respectively. Also, concentrations decreased with depths for most rates at various seasons, years and application times. At various manure rates concentrations in most depths, seasons and years fluctuated with weeks application. Furthermore, averaged over rates and soil depths, concentrations in both years were better in late than early seasons and with 2020 better than 2019. The higher increase in NH4+– N than in NO3–– N recorded during this experiment signified that the rate of ammonification was higher than the rate of nitrification [5]. Generally, NO3–– N increased with most manure (only poultry and sheep as well as the integration of both manure) rates probably due to the priming effects of the nutrient contents on nitrification process and with integration of manures better than single applications probably due to combined effects of both. Poultry was better than sheep among single manure applications ascribable to better nutrient enrichment. The poor contents with soil depths, early season and the year 2019 could be attributed to poor nitrification. Optimal conditions for nitrification has been noted to include adequate O2 supply, good moisture levels, temperatures of between 30 – 60 0C and rich microbial populations [45].
CONCLUSION
The Levels of N forms were considered as the major limiting factors in crop growth, development and economic yield. Generally, incorporation of poultry and sheep manures on the soils improved the NO3–– N according to the rates compared with control. This was as a result of TN, NH4+– N, NO3–– N, TP, Bray II P, soluble P, TK, exchangeable K+ and soluble K+ that were present in the manures applied. However, integration of poultry and sheep manures incorporated led to increase in the soil NO3–– N more than the single doses in the early and late seasons of 2019 and 2020. Highest values of integration of manures improved soil NO3–– N in the order P30S30 > P 30S60 > P60S30. In relation to soil depths, the NO3–– N decreased as the depth increased. Highest soil NO3–– N values were obtained at twelfth week in 2019 but first week in 2020 at almost all depths in relation to other weeks. To increase soil NO3–– N application of poultry, sheep and integration of poultry and sheep manures are recommended. Organic amendments, in particular poultry and sheep manures can represent the sustainable tool to improve soil fertility in intensive agriculture.
ACKNOWLEDGEMENTS
The authors would like to thank all that contributed to the success of this research.
REFERENCES
- Abdelrazak, A. (2002). Effect of Chicken Manure, Sheep Manure and Inorganic Fertilizer on Yield and Nutrients Uptake by Onion. Pakistan Journal of Biological Sciences, 5, 266- 268. http://dx.doi.org/10.392`3/pjbs.2002.266.268
- Adaikwu, A. O. & Ali, A. (2013). Assessment of some soil quality indicators in Benue State. Nigeria Journal of Soil Science 23(2): 6 – 75.
- Amoo, A. E. & Babalola, O. O. (2017). Ammonia-Oxidizing microoganisms: key players in the promotion of plant growth. J. Soil Sci. Plant Nutr. Vol.17 no. 4 Temuco dic. http://dx.doi.org/10.4067/s0718-95162017000400008.
- Aulakh, M. & Malhi, S. (2005). Interactions of Nitrogen with Other Nutrients and Water: Effect availability indices in a sandy clay loam soil amended with animal manures. DOI10.1007/s40093-017-0165-7. Int. J. Recycl Org Waste Agricult. 6:167-178.
- Ayeni, L. S. & Adeleye, O. E. (2014). Mineralization rates of soil forms of nitrogen, phosphorus, and potassium as affected by organomineral fertilizer in sandy loam. Advances in Agriculture, 149209(5). https://doi.org/10.1155/2014/149209 Google Scholar
- Azeez, J. O. & Van Averbeke, W. (2010a). Fate of manure phosphorus in a weathered sandy clay loam soil amended with three animal manures. Bioresource Technology 101. 6584 – 6588.
- Azeez, J. O. & Van Averbeke, W. (2010b). Nitrogen mineralization potential of three animal manures applied on a sandy clay loam soil. 101. 5645 – 5651.
- Brady, N. C. & Weil, R. R. (2008). Soil nutrients, landscape age, and sphagno-Eriophoretum vaginati plant communities in Arctic moist acidic tundra landscape. The nature and properties of soils. Prentice – Hall Inc., New Jersey.
- Christensen, P. (2017). Manure as a fertilizer. Cooperative extension. University of California. Pp 1 – 6.
- Enwezor, W. O., Ochiri, A. C., Opuwaribo, E. E. & Udoh, J. E. (1990). A review of soil fertility Investigation in Nigeria, FMAMR, Lagos 6.
- Ezeaku, P. I. (2006). Estimation of crop water requirement from climate and soil data for field Maize production in Southeastern Nigeria. J. Sustain. Trop. Agric. Res. 17: 91 – 96.
- Fan, H., Jackson, T. Yang, X, Tang, W., & Zhang, J. (2010). The factor structure of the Mayer– Salovey–Caruso Emotional Intelligence Test V 2.0 (MSCEIT): A meta-analytic structural equation modeling approach. Personality and Individual Differences, 48, 781785. https://psycnet.apa.org/record/2010-05770-003
- Fan, X. H. & Alva, A. K. (2010). Effects of temperature and soil type on ammonia volatilization from slow-release nitrogen fertilizers. Communications in Soil Science and Plant analysis. https://doi.org/10.1080/0013624.2011.566957, Pp 1111 – 1122, vol. 42, issue 10.
- Gee, G. W. & Or, D. (2002). Particle size analysis. In: Dane, JH & Topps, GC (eds). Methods of Soil analysis, Part 4. Physical methods. Soil Science Society of America Book Series NO. 5, ASA & SSSA, Madison, WI. Pp 255 – 293.
- Genstat (2012). Reference manual (Genstat Release 7.0) VSN International Limited, Oxford, UK. www.discovery.genstat.co.uk.
- Hargreaves, J. C., Adi, M. S. & Warman, P. R. (2008). A review of the use of composted municipal Solid waste in agriculture. Agriculture, Ecosystems and Environment. Vol. 123, issues 1 – 3, Pp 1 – 14. https://doi.org/10.1016/j.agee.2007.07.004
- Hirel, B., Tétu, T., Lea, P. J. & Dubois, F. (2011). Improving nitrogen use efficiency in crops for sustainable agriculture. Sustainability 3 1452–1485.
- IITA (1979). Selected methods of soil and plant analysis. Manual series 1. International Institute of Tropical Agriculture, Ibadan, Pp 1 – 70.
- IPEDC (2006). Imo State of Nigeria Statistical Year Book. Published by Imo State Planning and Economic Development Commision, State Secretariat, Port Harcourt Road, Pp 282.
- Iren, O. B., John, N. M., Imuk, E. A. (2014). Effects of sole and combined applications of organic manures and urea on soil properties and yield of fluted pumpkin (Telfaria occidentalis, Hook F.). Nigerian Journal of Soil Science, 24(1): 125 – 133.
- James, J. C. (2001). Nitrogen in soil and fertilizer. First Published in the: Science Turfgrass Foundation News. 8(1): 6 – 10.
- Jha, M. K., Schilling, K. E., Gassman, P. W. & Wolter, C. P. (2010). Targetting land use change for nitrate nitrogen load reductions in an agricultural watershed. Journal of Soil and Water Conservation, 65(6): 342 – 352.
- LAS. 2014. Soluble Salts or Electrical Conductivity of Soils and Green house Media. Litchfield Analytical Services. Pp. 1 – 2.
- Li, J. T., Zhong, X. L., Wang, F. & Zhao, Q. G. (2018). Effect of poultry litter and livestock manure on soil physical and biological indicators in a rice-wheat rotation system. Plant, Soil and Environment, 57(8): 351 – 356.
- Loks, N. A., Manggoel, W., Daar, J. W. & Manzing, D. (2014). The effects of Fertilizer residues in soils and crop performance in Northern Nigeria: A review. International Research Journal of Agricultural Science and Soil Science, vol. 419, Pp 180 – 184. Doi:http//dx.doi.org/10.14903/injas.2014.089
- 26. Ma, J., Yamaji, N., Mitani, N., Xu, X. Y., Su, Y. H., Mcgrath, S. P. & Zhao, F. J. (2008). Transporters of Arsenite in Rice and Their Role in Arsenic Accumulation in Rice Grain Proceedings of the National Academy of Sciences of the United States of America, 105, 9931-9935. http://dx.doi.org/10.1073/pnas.0802361105
- Marx, E. S., Hart, J. & Stevens, R. G. (1999). Soil Test Interpretation Guide, Oregon State University. Pp. 1 – 8.
- Maynard, L. (2015). Nitrogen loss from wet soils. Purdue University. https://vegcropshotline/article/nitrogen-loss-from-wet-soils/
- Mulvaney, R. L. (1996). Nitrogen- Inorganic forms. Cover crops and soil ecosystem services. Methods of Soil Analysis: Part 3 Chemical methods, 5.3, Book Series, Chapter 38. https://doi.org/10.2136/sssabookser
- Neenu, S. & Karthika, K. S. (2019). Aluminium toxicity in soil and plants. Harit Dhara. 2(1): 15 – 19.
- Obiefuna, J. C., Ibeawuchi, I. I., Ekong, E. A., Okoli, N. A. & Alagba, R.
- (2012). Liming efficiency of arsenite in rice and their role in arsenic accumulation in rice grain. Proceedings of the National Academy of Sciences, USA 105: 9931– 9935.
- Osama, H. M., Amro, E. G. & Salama, S. M. (2016). Effect of sheep manure application rate and method on growth, fruiting and fruit quality of Balady guava trees grown under mid- Sinai conditions. Doi: 10.9790/2380-09115972, Pp 58 – 72.
- Pam, H. and Brian, M. 2007. Interpreting Soil Test Results. What Do All the Numbers Mean? Pam Hazelton and NSW Department of Natural Resources. Pp.1 – 66.
- Prasad, R. & Chakraborty, D. (2019). Phosphorus Basics: Understanding Phosphorus Forms and Their Cycling in the Soil. Soil production. Extension. Alabama Universities.
- Richards, L. A. (ED). (1954). Diagnosis and Improvement of Saline and Alkali Soils. United State Department of Agriculture Handbook. Pp. 60.
- Sahrawat, K. L. (2008). Factors affecting nitrification inn soils. Communications in Soil Science and Plant analysis, vol. 39, issue 9- 10. Pp 1436 – 1446 https://doi.org/10.1080/00103620802004235.
- Saka, H. A., Azeez, J. O., Odedina, J. N. & Akinsete, S. J. (2017). Dynamics of soil nitrogen availability indices in a sandy clay loam soil amended with animal manures. International Journal of Recycling of Organic Waste in Agriculture. Received: 7 July 2016/ Accepted: 22 April 2017, 6: 167 – 178. DOI 10.1007/s40093-017-0165-7.
- Stubbs, M. (2016). Nutrients in Agricultural production: A water quality overview. Congressional Research Service. Pp. 1 – 29.
- Sylvia, D. M., Furmann, J. J., Hartel, P. G. & Zubere, D. A. (eds) (2004). Principles and Applications of Soil microbiology, Second Edition. Prentice Hall, Upper Saddle River, New Jersey.
- Ukaegbu, E. P. & Nnawuihe, C. O. (2020). Assessing landuse effect on soil properties in the coastal plains sand, Imo State, Nigeria. Africa Journal of Agricultural Resourses. Vol. 16(6), Pp 850 – 859. DOI: 10.5897/AJAR2018.13809
- Usman, M. (2015). Cow dung, goat and poultry manure and their effects on the average yields and growth parameters of tomato crop. Journal of Biology, Agriculture and Healthcare. Pp 1 – 3.
- Uzoho, B. U. (2010). Field and Laboratory Evaluation of dynamics in soil properties of selected land-use types in Owerri, Southeastern, Nigeria. Inter. Journ Agric & Rural Dev. 13(2): 268 – 273.
- Uzoho, B. U., Ahukaemere, C. M., Egboka, N. T., Afangide, I. A., Okoli,
- N., Irokwe, I. F. & Ubakwe, R. C. (2022). Potassium quantity intensity concepts of soils of contrasting landscape positions in the humid rain forest, Southeastern Nigeria. Advanced Journal of Science, Engineering and Technology, 7(10): 1 – 21.
- Uzoho, B. U., Ekpe, I. I., Ahukaemere, C. M., Ndukwu, B. N., Okoli, N. H., Osisi, F. A. & Chris -Emenyonu, C. M. (2014). Nitrogen Status of Soils of Selected Land-uses of Two Cropping Systems in the Humid Tropical Rainforest, Southeastern Nigeria. Adv.Life Sci.Tech.
- Zhao, C. (2013). Nitrogen and potassium dynamics of selected Indiana soils. Purdue University. http://docs.lib.purdue.edu/open_access_dissertations. Pp 1 – 205.