
Estimation of Heavy Metals Content at Traffic Inter-Change Ita-Marun Epe Lagos State Nigeria
- Adebanjo Sunday Adekunle
- Akinwunmi Akindare Maxwell
- Omobowale Adebola Abdulganiyu
- Alebiosu Samuel Olubunmi
- 64-73
- Nov 29, 2023
- Engineering
Estimation of Heavy Metals Content at Traffic Inter-Change Ita-Marun Epe Lagos State Nigeria
Adebanjo Sunday Adekunle1,2*, Akinwunmi Akindare Maxwell1, Omobowale Adebola AbdulGaniu1, Alebiosu Samuel Olubunmi3
1Department of Chemical Engineering, lagos state University, Epe campus
2Environmental Engineering reasearch laboratory, Lagos State University, Epe Campus
3Deparment of Polymer and Textile Technology, College of Technology, YABATECH
*Corresponding Author
DOI: https://doi.org/10.51244/IJRSI.2023.1011006
Received: 04 October 2023; Revised: 19 October 2023; Accepted: 25 October 2023; Published: 29 November 2023
ABSTRACT
This study assesses the vehicular and traffic emission at Ita-marun Epe Lagos State. Road traffic area contains contaminants which affects human, animals and plants. Hence, the need to investigate the concentrations of these contaminants within the selected area.
Three deposition gauges of 0.15 by 0.20 mm were planted at selected sampling site for 30 days between December 2021 and January 2022. The Lagos State University Epe campus was used as the control experiment for this research work. Deposition flux for each site was determined. The contaminants levels of the heavy metals in particulate matter were evaluated using the Enrichment Factor (EF) analysis.
Deposition fluxes determined range from 31.8269-39.7836 g/m2/month at the sampling site while it ranges 42.3934-51.0567 g/m2/month at control site. Elemental analyses of all the samples collected were determined using the Energy Dispersive X-ray Fluorescence (EDXRF). EF reveals that 7 elements Ag, Cd, Cr, In, Mn, Sn, and Zn are highly enriched at sampling site while 6 elements S, Cl, Zn, Ge, As and W at the control site respectively.
Results shows that fluxes at the control site were higher than that of the sampling site. EF also reveals that seven elements at the sampling site and six elements at the control site were anthropogenically derived. Due to the findings of this research, a clean-up of this area is highly recommended.
Keywords: Vehicular and Traffic Emission, Deposition Gauges, Deposition Fluxes, Enrichment Factor
INTRODUCTION
Air pollutants emitted by motor vehicles are the largest component of air pollution recorded as a result of human activity, posing a threat to human health and natural resources [1, 2]. Along with the intensive development of urban agglomerations, hence an increase in the number of motor vehicles, the amount of toxic pollution in urban environment increases [3, 4]. Air pollution, the source of which is transportation, is related to the emission of solid particles from combustion engines [5]. [6] predicted that the share of non-fuel particles would continue to increase and by the end of 2020 it will average around 90% of the pollutant emissions from transportation sources such as traffic interchange.
Traffic interchange baseline data is essential for assessing suburbanization and urban sprawl effects in a developing country like Nigeria. One of such baseline data is the quantity of heavy metal contamination and its migration on the roadway. Heavy metals contamination is a subject of continuous interest within the scientific community, due to the toxic effects on the entire biosphere [7]. Anthropogenic activity is one of the most important sources of heavy metal pollution. Vehicular traffic is a human induced activity and a major source of contaminants released into the natural environment [8]. The worldwide high vehicular traffic density has led to accelerated emission rates, causing contamination of roadside soils [9]. The heavy metals can impair important biochemical processes posing a threat to human health, plant growth and animal life [10]-[13].
Investigation of road dust is important for many reasons [14]. Firstly, road dusts are inhaled by those who traverse the streets/highways and those who reside in the vicinity of major roads. In road dust pollution events, metals are released into the environment. Consequently, the public is exposed to the health hazards associated with such metals [15]. Secondly, during the periods of rainfall and strong winds, dust particles are deposited into the adjoining marine environment leading to sedimentation and metal contamination, thereby posing negative ecological impacts on aquatic organisms. Consumption of metal-contaminated seafood can adversely affect the human health [16]. Intake of dust particles laden with high concentrations of heavy metals may cause respiratory and cardiovascular diseases, cancer, birth defects, central nervous system impairment and death [17].
Study area
The study was conducted in Ita-Marun, Epe LGA, Lagos state as shown in Fig. 1. It is considered as one of the important national transport hubs. The high fluidity of traffic at the selected site has a significant impact on emissions— the emission of substances when starting and braking is higher than during smooth driving. Epe is located on coordinate 6o 35’N 3o 59’E in the northern side of Lekki Lagoon [18]. It has a surface area of more than 243km2 and is sandwiched between two other lagoons, the Lekki lagoon (freshwater) in the east and Lagos lagoon (brackish water) in the west. The lagoon is connected to the sea through the Lagos Harbor [19]. Epe is best known for its construction of the motorized, shallow-draft barges that navigate the costal lagoons. By the 2006 Census the population of Epe was 181,409. It is a Yoruba town located next to the Lagos lagoon with 294 rural and 24 semi-urban communities. There are some industries that greatly pollute the environment through gaseous emission. Epe Area is polluted by both vehicular and mini-industrial activities which might contain heavy metals that can affect humans upon inhalation. Hence, the need for this study.
MATERIALS AND METHODS
Measurement of Deposited Particulate Matter
Three deposition gauges (0.2m diameter by 0.15m depth) were deployed permanently to each sampling spot in the selected area within Ita-marun for a period of one month [20]. Deposition gauge in which particles settled when left in a particular spot for a long time. The more time it is left at the sampling spot, the more the particulates that is likely to settle therein.
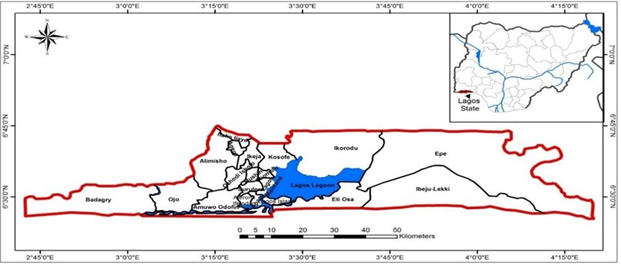
Fig. 1 Geographical map of Ita-marun interchanges Epe, Lagos State.
The sampling period covered dry seasons that are typical of Lagos State climates. The dry season was between October 2021 and February 2022.
The gauges were rinsed with distill water and sediment in the deposition gauges were collected and filtered through dry pre-weighed Whatman (125mm diameter, Cat No 1001 – 125) filter paper on digital weighing balance (model PA2102). The filter papers were desiccated in a desiccator to prevent further settlement of particles until it was completely dried. The filter paper and the particles were reweighed to determine the mass of the particles collected. The deposition flux was determined using equation 3.1 according to [20]
![]() 3.1
3.1
Where:
ΔWp = Change in weight of particulate matter (g), A = Area of the deposition gauge (m2) and t = Duration of exposure (month)
A flux is the rate of flow of particle or substances across a membrane or boundary. The samples collected after pre analysis was performed were taken to central research laboratory, Tanke Ilorin for characterization. The elemental analysis of all the samples collected were carried out using the Energy Dispersive X-ray Fluorescence (EDXRF) spectrometry. The EDXRF spectrometer (ECLIPSE Ш, AMTEK INC. MA; USA) is a self-contained miniature X-ray tube system. The detection system for all the measurements is a Model XR-100CR, which is a high-performance X-ray Detector with preamplifier and a cooler system, which uses a thermoelectrically cooled Si-PIN photodiode as an X-ray detector. The power to the XR-100CR is provided by a PX2CR power supply. The detector is coupled to the pocket MCA 8000A Multichannel Analyzer. The resolution of the detector for the 5.9 keV peak of 55Fe is 220 eV FWHM with 12μs shaping time constant for the standard setting and 186 eV FWHM with 20μs time constant for the optional setting. The optional setting was used for our measurements with the resolution of 186 eV for the 5.9 peak of 55Fe. The quantitative analysis of samples was carried out using the XRF-FP Quantitative Analysis Software package. This converts elemental peak intensities to elemental concentrations and or film thickness.
Determination of Enrichment Factor (EF)
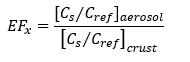
The contaminants level of the heavy metals in particulate matter study was evaluated using the enrichment factor (EF) analysis. The enrichment factor (EFx) for an element x is defined as:
 3.3
3.3
Where:
Cx and Cref are the concentrations of the element x and the reference element, while (Cx/Cref)aerosol and (Cx/Cref)crust are the proportions of the element concentrations in the particulate matter and in the Earth’s crust’ respectively. An element will be chosen as indicator based on the type of industries located in these areas for enrichment factor to be used. Therefore, Fe was chosen because it is the conventional element for the main source of the Earth’s crust [21-23]. Crustal element data were taken from [24].
RESULTS AND DISCUSSION OF RESULT
Determination of Fluxes of Ita-Marun
Fluxes were determined from the collected samples as shown in Table 1 and Table 2 for the control experiment. Spot 3 has the highest flux of 39.784 g/m2/month, Spot 1 and Spot 2 has 31.827 g/m2/month respectively. The total flux for Ita-marun as calculated from was 103.437 g/m2/month. This confirmed that particles are dispersed around as well settled at the sampling site. The results shows that anthropogenic activities around the spot 3 is on the high side. Also, the result from the control experiment carried out in LASU Epe campus shows that spot 1 which located around the cadet angle recorded 51.06 gm2/month while the spot 2 located at the old security post near the new Campus gate recorded 42.40 g/m2/month respectively [19,25].
Characterization of Collected Samples
Samples collected were processed in the analytical laboratory in the Department of Chemical Engineering Lagos State University Epe Campus and taken to Central Research Laboratory, Tanke Ilorin for characterization using the XRF. Twelve elements as shown in Table 3 were detected which are as follows Ag, Cd, Cr, Fe, Ln, Mn, Pd, Rh, Ru, Sn, Ti, and Zn.
Table 1: Dry Deposition Flux of Ita-marun Epe
| SITE | W1 (g) | W2 (g) | ∆W (g) | A (sq m) | T(month) | AT(sq m.month) | ∆W (mg) | F(g/sq m/month) |
| S1 | 0 | 1 | 1 | 0.03142 | 1 | 0.03142 | 1000 | 31.8269 |
| S2 | 0 | 1 | 1 | 0.03142 | 1 | 0.03142 | 1000 | 31.8269 |
| S3 | 0 | 1.25 | 1.25 | 0.03142 | 1 | 0.03142 | 1250 | 39.7836 |
| 103.4374 |
Table 2: Dry Deposition Flux Control Experiment LASU Epe Campus
| SITE | W1 (g) | W2 (g) | ∆W (g) | A (sq m) | T(month) | AT(sq m.month) | ∆W (mg) | F(g/sq m/month) |
| S1 | 1.6001 | 3.2043 | 1.6042 | 0.03142 | 1 | 0.03142 | 1604.2 | 51.0567 |
| S2 | 1.6201 | 2.9521 | 1.332 | 0.03142 | 1 | 0.03142 | 1332 | 42.3934 |
| 93.4501 |
Table 3: Characterized Dry Samples for Ita-marun Epe
| Elements | Molecular | Sample 1 | Sample 2 | Sample 3 | Sample 1 | Sample 2 | Sample 3 | Mean | STD |
| Mass | (ppm) | (ppm) | (ppm) | (µg/m3)106 | (µg/m3)106 | (µg/m3)106 | (µg/m3)106 | ||
| Ag | 107.8 | 94940 | 125050 | 53200 | 417.736 | 234.080 | 325.908 | 91.828 | |
| Cd | 112.4 | 15820 | 30660 | 72.578 | 140.661 | 0.000 | 106.619 | 67.541 | |
| Cr | 51.98 | 27860 | 0.000 | 59.109 | 0.000 | 59.109 | 48.262 | ||
| Fe | 56 | 97040 | 171210 | 0.000 | 454.702 | 802.241 | 628.471 | 389.602 | |
| In | 114.8 | 148930 | 43470 | 95570 | 334.333 | 97.586 | 214.545 | 215.488 | 96.654 |
| Mn | 55 | 497150 | 0.000 | 2163.110 | 0.000 | 2163.110 | 1766.172 | ||
| Pd | 106.6 | 86490 | 17740 | 376.320 | 77.187 | 0.000 | 226.753 | 179.032 | |
| Rh | 102.5 | 208470 | 54160 | 872.170 | 226.588 | 0.000 | 549.379 | 412.394 | |
| Ru | 101.07 | 33710 | 52430 | 139.064 | 216.290 | 0.000 | 177.677 | 107.317 | |
| Sn | 118.7 | 134030 | 54450 | 107410 | 649.362 | 263.805 | 520.390 | 477.852 | 160.251 |
| Ti | 47.8 | 31780 | 282380 | 0.000 | 62.003 | 550.929 | 306.466 | 266.737 | |
| Zn | 65 | 11910 | 0.000 | 0.000 | 31.598 | 31.598 | 25.800 |
It was discovered that Rh has the highest concentration of 208470 ppm in sample 1, Mn has the highest concentration of 497150 ppm sample 2 while Ti has the highest concentration of 282380 ppm in sample 3. The daily average was determined and the concentrations of Rh (872.170 (µg/m3)106) was the highest in sample 1, Mn (2163.110 (µg/m3)106) while Fe (802.241 (µg/m3)106). Characterization of samples of the control experiment (Table 4) also shows same number of elements and Fe still have the highest concentrations as well [26].
The mean and standard deviation were determined and plotted as shown in Fig. 2 and Fig. 3. Although, the fluxes were higher when calculated at the control site, the characterized concentrations at the sampling site were higher than that of the control site. This shows that the traffic inflow and out flow of the sampling site were higher coupled with the anthropogenic activities at the sampling site.
Enrichment Factor
Enrichment Factor (EF) values helps in determining whether a certain element has additional or anthropogenic sources other than its major crustal sources. Sources of metal in particulate include both natural and anthropogenic processes [27]. Iron (Fe) has the highest concentrations (Table 5 and Table 6) and was used as a reference element for the EF evaluation with respect to crustal abundance, with an assumption that the contribution of its anthropogenic source to the atmosphere is negligible [28]-[30]. According to standard, when EF < 10 is taken as an indication of crustal-derived trace metals source in the atmosphere and these are termed the non enriched elements (NEEs). In contract, an EF value of > 10 is considered to indicate non-crustal source or anthropogenically-derived trace metal source, and these are referred to as anomalously enriched elements (AEEs). [31, 32].
EF reveals from Table 5 that only two elements have EF < 10. Hence, the sampling site was greatly influenced by the human activities (anthropogenic) which has led to the increase in concentration of the of the other elements detected while EF from Table 6 shows that only 6 out of the 21 elements detected was highly enriched.
Table 4: Characterized Dry Samples for Control Experiments
| Elements | Molecular | Sample 1 | Sample 2 | Sample 1 | Sample 2 | Mean | STD |
| Mass | (ppm) | (ppm) | (µg/m3)106 | (µg/m3)106 | (µg/m3)106 | ||
| Si | 28 | 170583 | 194.9520 | 97.4760 | 97.4760 | ||
| S | 32 | 6576 | 35203 | 8.5891 | 45.9794 | 27.2842 | 18.6952 |
| Cl | 35.5 | 50121 | 38828 | 72.6243 | 56.2610 | 64.4426 | 8.1817 |
| K | 39 | 55597 | 82365 | 88.5013 | 131.1116 | 109.8065 | 21.3051 |
| Ca | 40 | 178691 | 300184 | 291.7404 | 490.0963 | 390.9184 | 99.1780 |
| Ti | 47.9 | 35155 | 37203 | 68.7316 | 72.7357 | 70.7336 | 2.0020 |
| V | 51 | 2026 | 2277 | 4.2174 | 4.7399 | 4.4786 | 0.2612 |
| Cr | 52 | 1424 | 1208 | 3.0224 | 2.5639 | 2.7931 | 0.2292 |
| Mn | 55 | 7663 | 12832 | 17.2027 | 28.8065 | 23.0046 | 5.8019 |
| Fe | 56 | 274380 | 304590 | 627.1543 | 696.2057 | 661.6800 | 34.5257 |
| Ni | 59 | 2415 | 1036 | 5.8157 | 2.4949 | 4.1553 | 1.6604 |
| Cu | 64 | 3656 | 1484 | 9.5504 | 3.8766 | 6.7135 | 2.8369 |
| Zn | 65 | 352315 | 5697 | 934.7133 | 15.1145 | 474.9139 | 459.7994 |
| Ge | 73 | 460 | 1.3706 | 1.3706 | 0.0000 | ||
| As | 74.9 | 526 | 1.6081 | 1.6081 | 0.0000 | ||
| Zr | 88 | 206 | 0.7399 | 0.7399 | 0.0000 | ||
| Sr | 91 | 728 | 943 | 2.7040 | 3.5026 | 3.1033 | 0.3993 |
| Pb | 207 | 1737 | 214 | 14.6759 | 1.8081 | 8.2420 | 6.4339 |
| W | 183.6 | 12409 | 92.9915 | 92.9915 | 0.0000 | ||
| Po | 208.9 | 834 | 1435 | 7.1111 | 12.2356 | 9.6733 | 2.5622 |
| Ac | 227 | 4272 | 2725 | 39.5814 | 25.2480 | 32.4147 | 7.1667 |
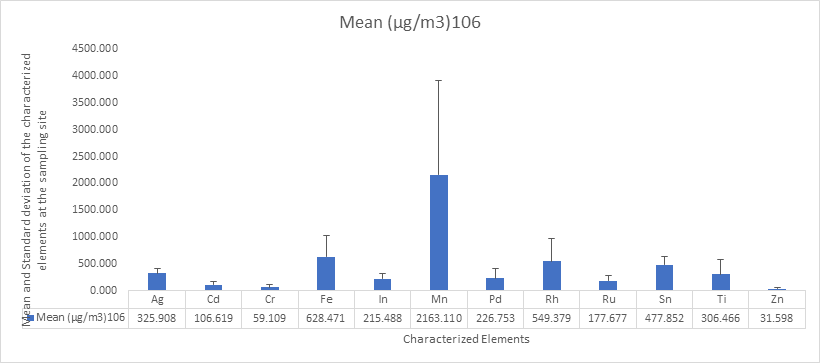
Fig.2: Mean and standard deviation of the characterized elements at Ita-marun
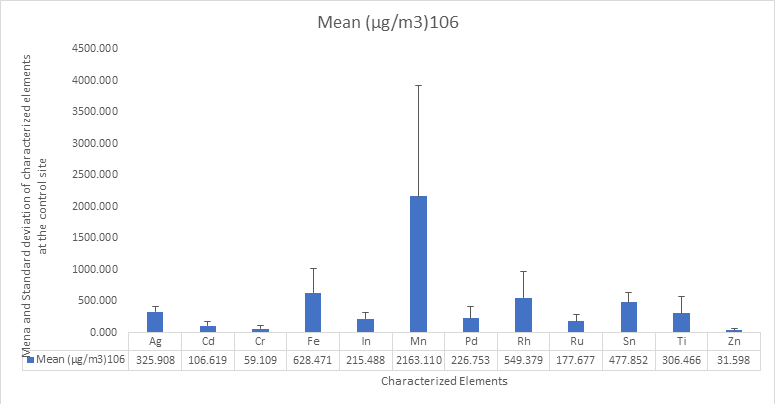
Fig.3: Mean and standard deviation of the characterized elements at LASU control Experiment
Table 5: Enrichment Factor for the Collected samples at Ita-marun
| Elements | Mean | ERS | Mean | Molecular | Mean | ERC | EF |
| (µg/m3)106 | ppm | Mass | (µg/m3)106 | ||||
| Ag | 325.908 | 0.519 | 0.07 | 107.8 | 0.000 | 0.000 | 216665.171 |
| Cd | 106.619 | 0.170 | 0.2 | 112.4 | 0.001 | 0.000 | 23793.094 |
| Cr | 59.109 | 0.094 | 100 | 51.98 | 0.212 | 0.002 | 57.046 |
| Fe | 628.471 | 1.000 | 56300 | 56 | 128.686 | 1.000 | 1.000 |
| In | 215.488 | 0.343 | 0.1 | 114.8 | 0.000 | 0.000 | 94165.451 |
| Mn | 2163.110 | 3.442 | 950 | 54.9 | 2.129 | 0.017 | 208.062 |
| Pd | 226.753 | 0.361 | 106.4 | 0.000 | 0.000 | ||
| Rh | 549.379 | 0.874 | 102.5 | 0.000 | 0.000 | ||
| Ru | 177.677 | 0.283 | 101.07 | 0.000 | 0.000 | ||
| Sn | 477.852 | 0.760 | 2 | 118.7 | 0.010 | 0.000 | 10097.732 |
| Ti | 306.466 | 0.488 | 5700 | 47.8 | 11.121 | 0.086 | 5.643 |
| Zn | 31.598 | 0.050 | 70 | 65 | 0.186 | 0.001 | 34.838 |
Table 6: Enrichment Factor for the control Experiment LASU Epe Campus
| Elements | Mean | ERSC | Mean cru | Molecular | Mean | ERC | EF |
| (µg/m3)106 | ppm | Mass | (µg/m3)106 | ||||
| Si | 97.476 | 0.147 | 281500 | 28 | 321.714 | 2.500 | 0.059 |
| S | 27.284 | 0.041 | 260 | 32 | 0.340 | 0.003 | 15.626 |
| Cl | 64.443 | 0.097 | 130 | 35.5 | 0.188 | 0.001 | 66.535 |
| K | 109.806 | 0.166 | 20900 | 39 | 33.269 | 0.259 | 0.642 |
| Ca | 390.918 | 0.591 | 41500 | 40 | 67.755 | 0.527 | 1.122 |
| Ti | 70.734 | 0.107 | 5700 | 47.9 | 11.144 | 0.087 | 1.234 |
| V | 4.479 | 0.007 | 135 | 51 | 0.281 | 0.002 | 3.099 |
| Cr | 2.793 | 0.004 | 100 | 52 | 0.212 | 0.002 | 2.559 |
| Mn | 23.005 | 0.035 | 950 | 55 | 2.133 | 0.017 | 2.098 |
| Fe | 661.680 | 1.000 | 56300 | 56 | 128.686 | 1.000 | 1.000 |
| Ni | 4.155 | 0.006 | 75 | 59 | 0.181 | 0.001 | 4.474 |
| Cu | 6.713 | 0.010 | 55 | 64 | 0.144 | 0.001 | 9.088 |
| Zn | 474.914 | 0.718 | 70 | 65 | 0.186 | 0.001 | 497.339 |
| Ge | 1.371 | 0.002 | 1.5 | 73 | 0.004 | 0.000 | 59.642 |
| As | 1.608 | 0.002 | 1.8 | 74.9 | 0.006 | 0.000 | 56.832 |
| Zr | 0.740 | 0.001 | 165 | 88 | 0.593 | 0.005 | 0.243 |
| Sr | 3.103 | 0.005 | 375 | 91 | 1.393 | 0.011 | 0.433 |
| Pb | 8.242 | 0.012 | 125000 | 207 | 1056.122 | 8.207 | 0.002 |
| W | 92.992 | 0.141 | 1.5 | 183.6 | 0.011 | 0.000 | 1608.899 |
| Po | 9.673 | 0.015 | 208.9 | 0.000 | 0.000 | 0.000 | |
| Ac | 32.415 | 0.049 | 227 | 0.000 | 0.000 | 0.000 |
CONCLUSIONS
The data obtained from the characterized samples gives evidence that heavy metals conclusion are being released by vehicular traffic and anthropogenic activities going onin the selected sampling site. It also show that the air qualty in the sampling site could be affected by the vehicular emission. The mean concentration value of the heavy metals obtained exceeded the WHO and USEPA standard. Enrichment factor show that seven (7) elements in the sampling site (Ita-marun) are non crutal derived (anthropogenic) since they are greater than 10 which was the treshold limit while six (6) elements reflect this at the control experiment site. Others are within the acceptable limits that is they are crustal derived elements. Therefore, a clean-up of the samopling is highly reccommended.
REFERENCE
- Meister, K., Johansson, C. and Forsberg, B. (2012). Estimated short-term effects of coarse particles on daily mortality in Stockholm, Sweden. Health Perspect. 120: 431–436. https://doi.org/10.1289/ehp.1103995
- European Environment Agency (EEA) (2016). Air quality in Europe — 2016 report. https://www.eea.europa.eu/publications/air-quality-in-europe-2016
- Han, N.M.M., Latif, M.T., Othman, M., Dominick, D., Mohamad, N., Juahir, H. and Tahir,N.M. (2014). Composition of selected heavy metals in road dust from Kuala Lumpur city centre. Earth Sci. 72: 849–859. https://doi.org/10.1007/s12665-013-3008-5
- Suryawanshi, P.V., Rajaram, B.S., Bhanarkar, A.D. and Chalapatirao, C.V. (2016). etermining heavy metal contamination of road dust in Delhi, India.Atmósfera 29: 221–234. https://doi.org/10.20937/ATM.2016.29.03.04
- Van der Gon, H.A.C., Gerlofs-Nijland, M.E., Gehrig, R., Gustafsson, M., Janssen, N. and Harrison, R.M. (2013). The policy relevance of wear emissions from road transport, now and in the future—An international workshop report and consensus statement. Air Waste Manage. Assoc. 63:136–149. https://doi.org/10.1080/10962247.2012.741055
- Rexeis, M. and Hausberger, S. (2009). Trend of vehicle emission levels until 2020—Prognosis based on current vehicle measurements and future emission legislation.Environ. 43: 4689–4698. https://doi.org/10.1016/j.atmosenv.2008.09.034
- Adebanjo, Sunday Adekunle, Jimoda, Adekilekun Lukuman, Alade, Abass O., Adedeji, Kasali Aderinmoye, Raji, wuraola Abake and Sonibare Jacob Ademola. (2019). Deposition fluxes of Particulate matter of some selected industrial area within Lagos State. Lasu Journal of engineering science and technology 1(1): 1-13
- Duong, T.T.T. and Lee, B.K. (2011). Determining contamination level of heavy metals in road dust from busy traffic areas with different characteristics. Environ. Manage. 92: 554–562. https://doi.org/10.1016/j.jenvman.2010.09.010
- Rokhzadi, A. and Toashih, V. (2011). Nutrient uptake and yield of chicpea (cicer aretinum L.) inoculated with plant growth- promoting rhizobacteria. Australian journal of crop Science, 5(1): 44-48.
- Järup, L. (2003). Hazards of heavy metal contamination. British Medical Bulletin,68: 167- 182.
- Lee, B. and Hieu, N. T. (2011). Seasonal Variation and Sources of Heavy Metals in Atmospheric Aerosols in a Residential Area of Ulsan , Korea. Aerosol and Air Quality Research, 11: 679–688.
- Lente, I., Ofosu-Anim, J., Brimah, A. K. and Atiemo, S. (2014). Heavy Metal Pollution of Vegetable Crops Irrigated with Wastewater in Accra , Ghana. West africa Journal of applied ecology, 22(1): 41–58.
- Qui, H., Yu, I. T. S., Tian, L., Wang, X., Tse, L. A., Tam, W. and Wong, T. W. (2012). Effects of coarse particulate matter on emergency hospital admissions for respiratory diseases: A time-series analysis in Hong Kong. Environmental Health Perspectives, 120(4): 572–576.
- EL -Sergany MM, El-Sharkawy MF. (2011). Heavy metal contamination of airborne dust in the environment of two main cities in the Eastern Province of Saudi Arabia.JKAU: Met. Env. Arid Land Agric. Sci. 22: 135–148. https://doi.org/10.4197/Met. 22-1.10
- Victoria, A., Cobbina, S.J., Dampare, S.B. and Duwiejuah, A.B. (2014). Heavy metals concentration in road dust in the Bolgatanga municipality, Ghana. Environ. Pollut. Hum. Health 2: 74–80. https://doi.org/10.12691/jephh-2-4-1
- Martin, S. and Griswold, W. (2009). Human health effects of heavy metals. Sci. Technol. Briefs Citizens 15: 1–6.
- Adewale, Farombi Abolaji Grace, Orisadare Oluseyi Obioye Ismail Olawale, Babatola babatunde keji (2010) Assessment of heavy metals in peppers sold in major markets in osogbo, osun state, southwest, Nigeria. International journal of advanced research in chemical science. Volume 7, issue 9, 2020, pp 01-08 issn no.: 2349-0403. Doi: https:// doi.org/10.20431/2349-0403.0709001
- Tchounwou, P.B., Yedjou, C.G., Patlolla, A.K. and Sutton, D.J. (2012). Heavy Metal Toxicity and the Environment, In Molecular, clinical and environmental toxicology: Volume 3: Environmental toxicology, experientia supplementum, Luch, A. (Ed.), Springer, Basel, pp. 133–164. https://doi.org/10.1007/978-3-7643-8340-4_6
- Adebanjo A Sunday, Jimoda A. Lukman, Alade O. Abass and Duduyemi O. (2020). Elemental Composition of Total Wet Particulate Matter Deposition in the selected Industrial Areas within Lagos state. Journal of Scientific and Engineering Research 7, (10): 182-192
- Jimoda L.A, Sonibare J.A. and Akeredolu F.A. (2010). Wet and Dry Deposition studies of Aerosol Hazes around a Major Sawdust Open Burning Area. Ife Journal of Technology. 19(1): 100-106
- Yadav, S. and Satsangi, P.G. (2013). Characterization of particulate matter and its related metal toxicity in an urban location in South West India. Environ. Monit. Assess. 185: 7365-7379
- Dai, Q.L. (2015) Characterization and source identification of heavy metals in Ambient PM10 and PM5 in an integrated Iron and Steel Indusutry Zone Compared with a background Site. Aerosol Air Qual. Res. : 875-887
- Rivera, M., Basagaña, X., Aguilera, I., Foraster, M., Agis, D., De Groot, E., Perez, L., Mendez, M. A., Bouso, L., Targa, J., Ramos, R., Sala, J., Marrugat, J., Elosua, R. and Künzli, N. (2013). Association between long-term exposure to traffic-related air pollution and subclinical atherosclerosis: The REGICOR study. Environmental Health Perspectives, 121(2): 223–230.
- Taylor, S.R. and McLenan, S.M. (1985). The continental Crust: Its Composition and evolution, Blackwell Scientic Publication, Carlton, 312
- Jimoda, L.A. (2012). Effects of Paticulate Matter on Human Health, The Ecosystem, Climate and Materials : A Review. Working and Living Environmental Protection, 9(1): 27–44.
- Alamu O. Adejoke, Alade O. Abass, Adebanjo A. Sunday and Jimoda L. Adekilekun,(2020),“Elemental Characterization of Aerosols in Wet Deposition along a Dense Traffic Highway in Ogbomoso, Nigeria”, Engineering Techonology and Research Journal, Vol. 5,Issue 1,Pp. 7-17 , DOI:https://doi.org/10.47545/etrj.2020.5.1.055
- Salwa, K. Hassan and Mamdouh, I. Khoder, (2016). Chemical characteristics of atmospheric PM5 loads during air pollution episodes in Giza, Egypt. Atmospheric Environment xxx: 1 – 10
- Wu, Y.S., Fang, G.C., Lee, W.J., Lee, J.F., Chang, C.C. and Lee, C.Z. (2007). A review of atmospheric fine particulate matter and its associated trace metal pollutants in Asian countries during the period 1995 – 2005. J. Hazard Matter. 143: 511 – 515
- Radin Maya Saphira Radin Mohammed, Farah Hamin Binti Chi Aziz and Amir Hashim Mohd. Kassim (2014). n assessent of selected heavy metal concentrations in university campus located industrial ARPN Journal of Engineering and Applied Sciences, 9 (12): 2724-2730
- Kothai, P., Saradhi, I. V., Pandit, G. G., Markwitz, A. and Puranik, V.D. (2011). Chemical characterization and source identification of particulate matter at an urban site of Navi Mumbai, India. Aerosol and Air quality Research, 11: 560 – 569
- Cheng, M., Lin, Y., Chio, C., Wang, C., Kuo, C. (2005). Characteristic of aerosols collected in central Taiwan during an Asian dust event in spring 2000. Chemosphere 61: 1439 – 1450
- Kong, S., Lu, B., Bai, Z., Zhao, X., Chen, L., Han, B., Li, S., Ji, Y., Xu, Y., Liu, Y. and Jiang, H. (2011). Potential threat of heavy metals in re-suspended dusts on building surfaces in oil field city. Atmospheric Environment, 45(25): 4192–4204.