
Evaluation of Access to Drinking Water Sources in Port Harcourt, Rivers State
- Joseph Chukwuka Okah
- Osuagwu Joachim C.
- 552-565
- Aug 8, 2024
- Urban and Regional Planning
Evaluation of Access to Drinking Water Sources in Port Harcourt, Rivers State
1Joseph Chukwuka Okah* and 2Osuagwu Joachim C.
1Department of Building Technology, Captain Elechi Amadi Polytechnic, Rumuola, Port Harcourt, Rivers State, Nigeria
2Department of Civil Engineering, Federal University of Technology, Owerri, Imo State, Nigeria
*Corresponding Author
DOI: https://doi.org/10.51244/IJRSI.2024.1107042
Received: 19 June 2024; Revised: 30 June 2024; Accepted: 04 July 2024; Published: 08 August 2024
ABSTRACT
Quality drinking water is a prime necessity of life and access to it is very important in the life of humans. Unfortunately, there is no potable water in the lexicon of governance in Rivers State hence this study to investigate access to quality drinking water sources in Port Harcourt (PH) City LGA and make recommendations. To achieve this, a total of 320 questionnaires to households in 20 defined stations in PH City LGA to randomly sample their opinions on the subject matter. At the end, 305 entries that were validly was rated with a 4-point Likert’s scale and ranked with Relative importance Index (RII) using frequency for the most accessed sources while Cronbach’s alpha was used for reliability. A hypothesis for the significance of the proportion of respondents that access the source was also tested with t-statistics. Results revealed that, out of the 10 sources of water investigated, borehole, ranked 1st with 78.69% as the most accessed drinking water source, followed by sachet (62.17%), bottled (37.7%), harvested rain (33.77%) and Municipal potable waters (12.17%) in 2nd, 3rd, 4th and 5th positions while river and pond ranked 9th (0.98%) and 10th (0.98%) indicating that they are not accessed. The influencing factors for accessibility are; Cost, Quality and Availability. Also, the proportions of respondents that access the sources tested are all significant. The internal consistency of the data is 0.88. In conclusion, municipal potable water is not accessible in PH City LGA for over 32 years now hence the residents resorted to available sources whose qualities are not guaranteed. Rehabilitation of existing water infrastructures (10 stations) of The Port Harcourt Water Corporation (PHWC) and building of new stations, resuscitation of the New Water Board Law in 2012 and partnership with international Agencies such as USAID and UNESCO by Rivers State Government to provide adequate potable water for the resident of PH City are amongst the recommendations made.
Key Words: Drinking water, Water source, Borehole, Sachet water, potable water, Bottled water, Accessibility, Relative Importance Index
INTRODUCTION
Water is a natural resource widely regarded as a prime necessity of life. The human body uses water to normalise temperature, moisten tissues and carry out its metabolic activities. Drinking water may be supplied through municipal water systems sourced from surface water e.g. river, lakes, impounded reservoir or groundwater through wells, boreholes or springs [1] [2]. It may be contaminated through the source, treatment failures, distribution systems failure which may be exposed to sewage, pesticides, fertilizers, domestic and industrial wastes, leakages from landfill radioactivity [3]. Thus, to guarantee public safety, safe drinking water should be made available.
In the event of the non-availability of safe drinking water sources, the Millennium Development Goals (MDGs) was initiated to improve potable water availability to all in the 21st century and to ‘halve by 2015, in goal 7, the population without access to safe drinking water. In line with this, the Federal Government in 2003 launched the Presidential Water Initiative Programme “Water for people, water for Life” to improve access to safe drinking water by 65% up to 100% from 2007-2015 respectively. To match words with action, Government invested over N80 billion in 2006, external support for the programmed rose to about US$25m in the same year which increased access to safe drinking water in 2010 [4] by 45% especially in Imo State. However, there are still institutional reports indicating serious freshwater scarcity and inaccessibility of safe drinking water in Nigeria [5] [6] because, the government did not sustain this momentum over the years. Thus, it was not surprising to find a damning report titled, ‘Global Water Security and Sanitation Partnership’ published by [6] which showed that 70million Nigerians had no access to basic drinking water. Disappointedly, it stated that access to potable water sharply declined from 36 to 11% from 1990 to 2021 indicating total abandonment by the government and stakeholders.
To consolidate on MDG, the Sustainable Development Goals (SDG) was adopted in 2016 with a bold commitment in ‘goal 6 to achieve universal and equitable access to safe and affordable drinking water for all by 2030. Can we achieve this?
In Port Harcourt Metropolis, Rivers State, Nigeria, even though surrounded by river at the southern part, the major source of public water supply is groundwater because of higher quality compared to surface water prone to contamination [5] [7]. There are many sources of drinking water, however, only 10 common sources were considered in this study namely: borehole, potable water supply, sachet water, bottled water, hand lift pump, well, harvested rain water, pond, river and water vendor. The groundwater is accessed by a borehole through a submersible pump or hand lift pump (Indian Mart). The water may be packaged as bottled or sachet water under regulation. However, most of the borehole waters are not treated but makes water available for domestic use. The depth of the borehole is a measure of the quality of water accessed, thus the greater the depth, the purer the water [8]. According to NAFDAC, to access quality domestic water a private borehole should be sunk to depth ≥ 150ft (45m) [4] and ≥328ft (100m) for private and government respectively and maintaining a minimum distance of 30m away from any sewage disposal facility [8]. A pertinent question to ask is what the depths of the boreholes are and whether they are treated or not.
In Port Harcourt (PH), the Port Harcourt Water Corporation (PHWC) is saddled with responsibility of providing safe drinking water to the citizens of Port Harcourt City and its environs namely: Diobu, Moscow Road, Borikiri and Obio-Akpor LGA. To service these areas, PHWC has 10 water stations as shown in table 1.0. Regrettably, only Moscow Road water station currently functional at 50% capacity [9]. The water stations are not maintained and most of them have been abandoned completely and vandalized [9]. Others have not been functioning for over 25-30 years ago. In the event, the people sourced their drinking water through alternative means.
The origin of sachet water popularly known as ‘Pure Water’ in Nigeria has been traced to 1990 and its emergence has been attributed to the inability of the government to provide potable water supply [10].
Sachet water consists of water packaged in a sachet (waterproof bag) which is supposedly safe for drinking. Its production is regulated by NAFDAC in Nigeria with provides that its source must be from borehole of depth ≥150ft (45m), public mains or spring water only. Again, the question is how much of this is properly regulated? In the same vein, the bottled water came into existence about 4 decades ago in Nigeria through a company called Ragolis. It continues to thrive as a result of inadequate supply of potable water to the citizens of Nigeria and Port Harcourt, Rivers State by successive governments both at state and Federal levels [11]
The Lift hand pump consist of a lift pump manually operated to draw water from a borehole sump. This is mostly used in villages where the population density is low. It is laborious to draw out water from the well. The River and pond are surface water which is prone to contamination.
Several cases of drinking water contamination and subsequent outbreaks of water-borne diseases such as cholera, typhoid fever, dysentery and typhoid fever etc have been reported in many countries including Nigeria [8] [1] which is traceable to contaminated sources of drinking water. In the light of the above, it is important to evaluate the access to safe drinking water sources by residence of Port Harcourt City LGA.
MATERIALS AND METHOD
Study Area – Location
Port Harcourt metropolis in Rivers State comprises; Port Harcourt City LGA (4.777777N and 7.022222E), Obio/Akpor (4.778525N, 7.130245E) and the adjoining areas of Igwuruta, Aluu and Omagwa in Ikwerre LGA (4.9546540N, 7.0209620E) at the North-West. Igbo-Etche in Etche LGA (5.1343910N, 7.1419320E) and Oyigbo in Oyigbo LGA (4.886590N, 7.1245670E) are flanking the North-East while Emohua (4.8844290N, 6.8637020E) is at the West. Akpajo and Refinery in Eleme LGA (4.7996450N, 7.1214040E) are flanking the East while Okrika (4.7543810N, 7.0772530E) at the South East. However, the study was carried out only in Port Harcourt City LGA as shown below.
Table 1.0: PHWC water stations
| S/No | Water Stations | Areas covered |
| 1 | Rumuola Main | Rumuola, Rumuadolu, Rumuokwuta, Rumuigbo, Mgbuoba & Bori Camp |
| 2 | Eagle Island | Eagle Island, Agip, Opobo Street, Alaoga Amadi Street, RSU |
| 3 | Borikiri | Borokiri: Ibadan Str, Creek Rd, Harold Wilson Drive, Capt. Amangala str |
| 4 | Diobu | Ojoto, Iloabuchi, Abel Jumbo, Timber, Emenike, Ekwulobia, National street, Bishop Okoye, Tom Ogbuji, Sangana street, Rumuworji |
| 5 | Ernest Ikoli (Old GRA) | Water Glass Boat Yard, State Secretariat, Forces Avenue, Olumeni street, BMSH, Ernest Ikoli |
| 6 | Omerelu Street GRA 2 | Birabi street, Tombia Road, Judges Quarter, Evo Road, Presidential Hotel, Elelenwo street, State Assembly Quatrters |
| 7 | Moscow Road | Moscow Road, Forces Avenue, Industry Road, Benard Carr, Reclamation Road, Dockyard Road, Station Road, Aggrey Road, Bende Street. |
| 8 | Elelenwo | Elelenwo, Eliminigwe, Ompadec Road, Odani Road, RSTV, Woji |
| 9 | Rumukwrushi | Rumukwurusi, Oil mill, Igwuruta Road, Rumuibekwe, Rumuorolu, |
| 10 | Trans Amadi | Trans Amadi Road, Federal Housing Estate Woji, Woji, Nkpogu, Elekahia, Ordinance, Peter Odili Road, Trans Amadi Industrial layout |
The area has a characteristic geology classified under Benin aquiferous formation with flat topography and permeable soil with little runoff encouraging leaching of contaminants into the aquifer not far from the surface (high water table) [9]. In recent times Port Harcourt City has witnessed a high rate of property development and population growth [12]. The geographical coordinates lie between 4.777777N and 7.022222E.
Climate
Port Harcourt is a coastal area which falls as within the subequatorial region marked by the wet and dry seasons that last for 7 month and 21 days and 4 months and 9 days respectively with September being the wettest month with ≥0.04 inches of precipitation [13]. With a short break in August, rainfall is frequent in the rainy season with September being the highest with average rainfall of 14.7-in, while the lowest is January with 0.8 inches (36yrs statistical analysis of weather in PH) [13]. The rainfall ends in November stretching to December with 1.8 inches and starts again from March. However, the annual rainfall is 78.7 inches (2000mm)[14]. So, harvested rain is expected in this area in the absence of potable water. The Vegetation is adorned with the tropical rainforest climate with high humidity coupled with maximum and minimum monthly temperature ranges of 28-330C and 17-240C respectively.
Demography of the Study Area
The population of Port Harcourt City LGA as at the 2006 census was 538,558 but was projected at an annual increase of 2.3% to 774,600 at 2022 [15]. and now 810,950 as at 2024. Port Harcourt City LGA occupies a land mass of 98.49km2 [15]. In the study, the LGA was divided into 20 stations with 50 locations with coordinates as shown in table 2.0: The coordinates were taken with hand GPS. Fig 1.0 shows the map of Port Harcourt City with Rivers State distinctively marked as the state where the study was carried out in Nigeria.
Research Question
The following research questions have been put forward to achieve the objectives of this study;
- What is/are your source(s) of drinking water?
- Why do you access this source?
- What is the availability of the source?
- Suggestion way(s) of making safe drinking water accessible to residents?
Research Hypothesis
A hypothesis was put forward for statistical interpretation of the data for significance and non-significance. The approach was the large-sample size test of hypothesis used for population proportion which is a two-tailed test.
Therefore, Null hypothesis Ho: P1 = Po = 0.5 ————- (I)
Alternative hypothesis H1: P1 ≠ Po ≠ 0.5 (reject null hypothesis) —————– (II)
Where P1 is the proportion of respondents who access the source which is significant or non-significant Po = the null hypothesized proportion
Table 2.0: Study Areas in Port Harcourt City LGA
| S/No | Station | Town/Location | Coordinates | |
| Latitude | Longitude | |||
| 1 | Abuloma/Amadi-Ama | Abuloma Town Square | 4.799309 | 7.106524 |
| Central Sq. Amadi-Ama | 4.799778 | 7.027270 | ||
| 2 | Diobu | Sacred Heart Church | 4.793670 | 6.986002 |
| St.Andrews Church mil1 | 4.793595 | 6.996708 | ||
| 3 | Elekahia | Elekahi Town | 4.822190 | 7.020246 |
| Nkpogu Town | 4.805714 | 7.017897 | ||
| Rainbow Town | 4.797739 | 7.036074 | ||
| 4 | Mgbundu-kwu 1 | Egede Street | 4.798629 | 6.992106 |
| Mgbundukwu – Mile 1 Hospital | 4.790854 | 6.994223 | ||
| 5 | Mgbundu-kwu 2 | Timber Market | 4.791565 | 6.989804 |
| Emenike Street | 4.789239 | 6.992825 | ||
| 6 | Nkpolu Oroworu-kwo 1 | Obiri Rebisi | 4.819672 | 7.01053 |
| Nkpolu Oroworukwo | 4.804663 | 6.992341 | ||
| Chindah Estate by UST Road | 4.803955 | 6.987584 | ||
| 7 | Nkpolu Oroworu-kwo 2 | UST Post Office | 4.792499 | 6.982118 |
| Sacred Hearts Church | 4.793910 | 6.986002 | ||
| Eagle Island | 4.783383 | 6.982239 | ||
| 8 | Ochiri/Rumukalagbo | Orochiri Hall | 4.816043 | 7.011155 |
| Rebisi | 4.803895 | 7.010516 | ||
| 9 | Ogbunabali | Old GRA | 4.787101 | 7.009343 |
| Isaac Boro street, Woji | 4.791463 | 7.004193 | ||
| Sangana Street | 4.791815 | 7.000276 | ||
| 10 | Oroabali | Ogbunabali | 4.803077 | 7.009379 |
| Amadi Flat | 4.789166 | 7.001572 | ||
| 11 | Orogbum | Ede Street | 5.111824 | 7.034379 |
| Orogbum Health Centre | 4.805548 | 7.011453 | ||
| 12 | Oromineke/Ezimgbu | Oromineke Market | 4.805442 | 7.004073 |
| Oromineke/Ezimgbu | 4.815707 | 7.000068 | ||
| 13 | Oroworu-kwo | Nkoplu Oroworukwo Town hall | 4.805946 | 6.989595 |
| Ogoloma Street | 7.000719 | 4.802467 | ||
| 14 | Port Harcourt Township 1 | Housing Estate Aggrey Road | 4.762101 | 7.017095 |
| Bernard Carr | 4.766346 | 7.018549 | ||
| Stella Maris College | 4.762727 | 7.012057 | ||
| Bundu Water Front | 4.756076 | 7.013926 | ||
| Moscow Road | 4.770668 | 7.018157 | ||
| Harbour Road by FBN | 4.782250 | 7.022422 | ||
| Near Apostolic Church Creek Rd | 4.759160 | 7.025595 | ||
| 15 | Port Harcourt Township 2 | Jubille Park, Bende Str | 4.760592 | 7.028222 |
| Marine Base | 4.770683 | 7.026972 | ||
| 16 | Port Harcourt Township 3 | Navy Sec. Sch., Harold Wilson Drive, Borikiri | 4.741769 | 7.037425 |
| Kolokuma Str. Borikiri | 4.744892 | 7.043176 | ||
| 17 | Rumuibekwe | Rumuibekwe Market | 4.840395 | 7.054604 |
| Living Hope Baptist Church Elelenwo | 4.833083 | 7.067029 | ||
| 18 | Rumuwoji 1 | Rumuwoji Town Hall | 4.840780 | 7.049948 |
| Abonema Wharf Road | 4.780397 | 7.005434 | ||
| 19 | Rumuwoji 3 | Iloabuchi | 4.788928 | 6.989410 |
| Elechi Beach | 4.785487 | 6.99683 | ||
| Kidney Island | 4.778644 | 6.999968 | ||
| 20 | Rumuwoji 2 | Rumuwoji 2 | 4.788823 | 6.997036 |
| Rumuwoji Street | 4.788034 | 6.997342 | ||
Source: Author’s field work (2024)
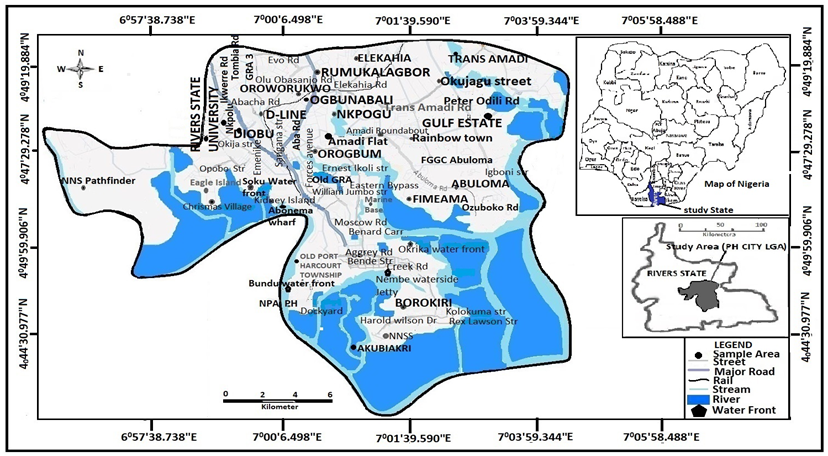
Fig 1.0: Map of Port Harcourt City, Rivers State, Nigeria – Source: Author’s field work (2024)
Limitations
- The unwillingness of some respondents to complete their questionnaire was a problem. This is because most of them felt it is not important or that they may come under scrutiny for divulging such public information.
- The study is limited to the identification and evaluation of drinking water sources but not the quality, hence further research is necessary to ascertain the quality of drinking water sources in the City
- The lean financial capacity of the researcher is a major limitation of this study
Method of Data Collection
The Survey design method was used to randomly sample the opinions and perceptions of households on the subject matter through structured questionnaire and interviews. These households reside in the LGA and they access one or more of the drinking water source(s). Most of the civil servants or working-class households were visited during weekends while other vocations/occupations were visited during weekdays where interviews were conducted in the field. A total of 320 questionnaires out of an expected population target of 1600 were distributed to households drawn from various locations in the LGA to randomly sample their opinions on the subject matter. The sample size was determined using Yaro Yamane Population reduction formula:
![]() ————- (I)
————- (I)
n = Desired sample size N = Population under study = 1600 e = Accepted tolerable error of 5%
Hence, 1600/(1+1600(0.052)) = 320, A total sample size of 320 was used.
The four point Likert scale is shown in table 3.0.
Table 3.0 Likert scale
| S/No | Response | Score |
| 1 | Always (A) | 4 |
| 2 | Often (OF) | 3 |
| 4 | Rarely (R) | 2 |
| 5 | Never (N) | 1 |
Research survey: 2024
Table 4.0 Factors influencing accessibility
| S/No | Response | |
| 1 | Cost (C) | High |
| Low | ||
| 2 | Quality | Good |
| Poor | ||
| 3 | Availability (Av) | Always |
| Scarcely | ||
| Inaccessible (Never) | ||
Research survey: 2024
Method of Data Analysis
The results were presented in frequency (simple %) in tabular form, while the formulas were used for data analyses.
i. The simple % method is as follows:
![]() ———- (II)
———- (II)
Where F = frequency or No of the respondents, R = number of respondents, N = Population size
ii. Ranking of the sources by Relative Importance Index (RII) is calculated as follows:
 ———— (III)
Where Wk = score given to each factor by the respondents 1-4, nk = Response for each score, N = Total response for each factor, A = Highest score (4)
iii. Reliability: Cronbach Alpha, a champion amongst the psychometric tests was used to test the internal consistency of the survey using SPSS 23 in the formula:
![]() ——————– (IV)
——————– (IV)
Where α= Cronbach’s Alpha, K = No items being questioned, ΣS2Y = Sum of K item score variance, S2X = Variance of total score
RESULT PRESENTATION AND ANALYSIS
Data Demography
Out of the 320 distributed, a total of 308 entries were returned representing 96.25% out of which 3 entries were invalid and expunged from the data leaving 305 completed entries used. The age distribution and educational qualifications are shown in table 5.0 and 6.0 respectively.
Table 5.0 Age distribution
| S/No | Age (year) | Frequency | Percentage (%) |
| 1 | 18-25 | 40 | 13.1 |
| 2 | 26-40 | 136 | 44.6 |
| 3 | 41-55 | 81 | 26.6 |
| 4 | 56 and above | 48 | 15.7 |
| Total | 305 | 100 | |
Research survey: 2024
Table 6.0: The Educational Qualification
| S/No | Educational qualification | Frequency | Percentage % |
| 1 | FSLC | 33 | 10.8 |
| 2 | Ordinary Level Certificate | 84 | 27.5 |
| 3 | First degree/HND | 124 | 40.7 |
| 4 | Masters | 42 | 13.8 |
| 5 | PhD | 22 | 7.2 |
| Total | 305 | 100 | |
Research survey: 2024
Table 5.0 shows that the age distribution falls within the age of adulthood. However, their educational qualification as shown in table 6.0 indicate 89.2% of educated respondents and 10.8% uneducated respondents which is ideal in this case, O’ level being the benchmark. The implication is that the respondents are not oblivious of the subject matter but understand it very well.
Result Presentation-Ranking of Sources and frequency distribution of Responses
The sources of drinking water accessible to PH City residents are ranked according to their RII in table 7.0.
Table 7.0: Ranking of the sources of drinking water
| S/No | Source of Drinking Water | No of Respondents (nk) for each Score (Wk) | N | RII | Rank | |||
| 1 | 2 | 3 | 4 | Nx = 305 | ||||
| 1 | Borehole | 27 | 38 | 95 | 145 | 305 | 0.793 | 1 |
| 2 | Sachet Water | 65 | 50 | 82 | 107 | 304 | 0.690 | 2 |
| 3 | Bottled Water | 80 | 110 | 58 | 57 | 305 | 0.575 | 3 |
| 4 | Harvested Rain | 85 | 117 | 68 | 35 | 305 | 0.543 | 4 |
| 5 | Potable Water | 171 | 95 | 20 | 18 | 304 | 0.405 | 5 |
| 6 | Water Lift Hand Pump (e.g. Indian Mart) | 192 | 82 | 16 | 15 | 305 | 0.380 | 6 |
| 7 | Open well (Hand drawn) | 201 | 93 | 7 | 4 | 305 | 0.348 | 7 |
| 8 | Water vendor (tanker) | 256 | 44 | 2 | 2 | 304 | 0.294 | 8 |
| 9 | River/Stream | 274 | 23 | 2 | 1 | 305 | 0.275 | 9 |
| 10 | Pond/Lake/Pool | 298 | 4 | 3 | 0 | 305 | 0.258 | 10 |
Research survey: 2024
Result Analysis
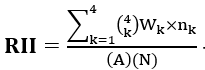
The result in table 7.0 and fig 3.0 shows that borehole is top-rated amongst the sources assessed. Borehole ranked 1st with the RII of 0.793 which is the highest obtained in the study. The implication is that most people residing in PH City LGA use borehole as their source of drinking water because according to result in fig 4.0, it is the cheapest way of accessing drinking water with ‘reasonable’ quality according to them. Fig 4.0 also shows that 40% and 31.8% of the respondents access borehole respectively because of availability and low cost while only 6.89% is attributed to the quality of the borehole water.
Fig 2.0: Factors Limiting Accessibility: Author’s field work (2024)
Thus the promoting factors for the accessibility of borehole are availability and low cost. Contrarily, fig 2.0 shows that the limiting factor for accessibility is poor quality as 16.07% of the respondents do not access borehole because of poor quality. However, figs 4.0 and 2.0 show that a total of 78.69% of the respondents always access borehole while only 21.31% do not. This result conforms with the findings of [16].
Table 7.0 and fig 3.0 shows that Sachet water popularly called ‘Pure water’ is ranked 2nd with RII of 0.690. Figs 4.0 and 2.0 show that 35.2% and 23.36% of the respondents access sachet water because of low cost and good quality respectively while 26.97% do not, citing poor quality.
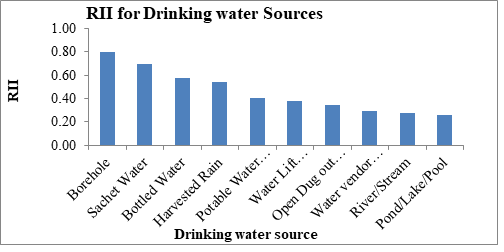
Fig 3.0: RII of Drinking Water Sources: Author’s field work 2024
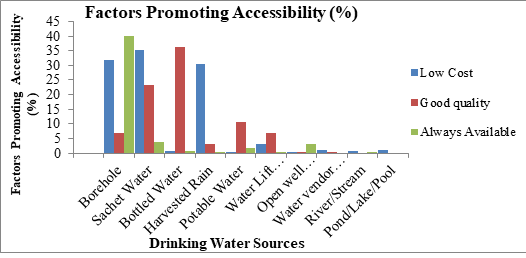
Fig 4.0: Factors Promoting Accessibility: Author’s field work 2024
Thus the promoting factor here for accessibility is low cost followed by good quality while the limiting factor is poor quality. So, the overall % of respondents who always access sachet water is 62.17% while 37.83% do not.
Bottled water is ranked 3rd with RII of 0.575. It is seen as elitist or ‘big man’ drinking water, because it is expensive but the quality stands out as the safest or best quality source of drinking water. This is the implication of the result in figs 4.0 and 3.0 which show that 36.39% of the respondents use bottled water because of the good quality while 60.98% never /rarely use bottle water because of the high cost. Overall, 37.7% use bottled water for drinking while 62.30% do not.
Harvested rain water is ranked 4th with RII of 0.543. According to the result, 30.49% of the respondents reported that the reason why they access harvested rain is because it is inexpensive while the limiting factor for its consumption is poor quality which scored 55.74%. Interestingly, 9.89% do not access rain because it is scarcely available and only available in rainy season even though it must be boiled before ingestion. However, 33.77% use harvested rain, while 66.23% do not consume rain water.
Potable Water (Municipal or private) is ranked 5th out of 10 sources with RII of 0.405. Participants complained that they have never seen municipal potable water for years now except residents of Port Harcourt Township who get portable water supply once a while from Moscow water station. In the event, they seek alternative sources to complement. The major reason for not accessing potable water is because of its inaccessibility. Figs 4.0 and 2.0 showed that only 1.64% and 10.53% of the respondents access potable water in Port Harcourt City because of availability and good quality respectively while a huge 76.97% do not access it because of unavailability in the city. Thus the major limiting factor here is inaccessibility. The result shows that 87.50% of the respondents do not have access to portable water supply while only 12.17% have access to portable water.
Interestingly, Water Lift Hand Pump (Indian Mart) is ranked 6th with RII of 0.380 according to table 7.0 and fig 3.0. Results from figs 4.0 and 2.0 indicate poor accessibility as only 10.16% of the respondents access lift hand pump while and 89.84% do not. Interestingly, 77.70% of the respondents never access this source because it is scarcely available. The interviewees cited inconvenience and excessive labour in getting water from this source.
Open dug out well is ranked 7th with RII of 0.348. Results also show that 62.60% and 28.85% of the respondents never access this source because of poor quality unavailability. They opined that it is outdated and no longer fashionable. Thus, only 3.61% said they use it while 96.39% of the respondents objected to it. Some cited pollution by leachate infiltration.
Water Tanker (Vendor) is ranked 8th with RII of 0.275. Interestingly, only 1.31% of the respondents patronize them, while 98.68% do not because, it is no longer available due to high cost of supply now. Moreover, the source and the quality of the water are doubtful [16], hence, 62.62% and 36.18% do not use it because of poor quality and high cost respectively.
River/stream is ranked 9th with RII of 0.321 as respondents cite health risk to all kinds of contamination especially the O&G activities going on in the region. Thus result from figs 4.0 and 2.0 show that 97.38% never use this source due to poor quality even though the place is a coastal area. Overall, 99.02% of the respondents do not consume river water while only 0.98% does.
Finally, Pond/Lake ranked 10th with the least RII of 0.258. Participants cited the health risk in accessing pond for drinking. Thus, 99.02% do not access it while 0.98% of the respondents do.
The results showed that in the absence of access to viable source of drinking water such as municipal or small potable water supply schemes, the residents of Port Harcourt City resorted alternative unsafe sources of water. Expectedly, this is influenced by cost, quality and availability to secure a safe drinking water source. The quality of the borehole water as the major source of drinking water is not guaranteed, hence, residents are at the risk of being infected with water-borne diseases [16].]. The consumption of sachet and bottled water has created a huge waste management issue in the City as these packaging materials are non-biodegradable and unsustainable, hence they cause huge environmental pollution as they are indiscriminately littered everywhere in the City and sometimes burnt emitting green-house gas into the atmosphere. Therefore, it is important to further carry out a research on the quality of the sources of drinking water in Port Harcourt City to ascertain the effect of their consumption on the health of the residents.
Statistical test for the Hypothesis
- Null hypothesis Ho: P0 = 0.50,
- Alternative hypothesis H1: P0 ≠ 0.50 (reject null hypothesis)
This is a two-tailed test with Z-values between ±1.96 at 5% significance level
Z-score, ⸫ ![]() ——— (IV)
——— (IV)
Where P1 = the sample proportion that access the source. P0 = the null-hypothesized proportion
σ = Standard deviation. n = sample size
Result interpretation
- If -1.96 >Z> 1.96, the result is significant at 5%, hence Ho is rejected and H1 accepted.
- If -1.96 <Z<1.96, the result is not significant at 5%, hence, Ho accepted and H1 rejected
Table 8.0: Z-score test result
| S/No | Tested Factor | Z-score | Inference | Conclusion |
| 1 | Borehole (Comm. and Private) | 10.0205 | Reject Ho & Accept H1 | Significant |
| 2 | Sachet Water | 4.2442 | Reject Ho & Accept H1 | Significant |
| 3 | Bottled Water | -4.2945 | Reject Ho & Accept H1 | Significant |
| 4 | Harvested Rain | -5.6687 | Reject Ho & Accept H1 | Significant |
| 5 | Municipal Potable water | -13.0767 | Reject Ho & Accept H1 | Significant |
| 6 | Water Lift Hand Pump (e.g. Indian Mart) | -13.9141 | Reject Ho & Accept H1 | Significant |
| 7 | Open Dug out well | -16.2045 | Reject Ho & Accept H1 | Significant |
| 8 | Water vendor (tanker) | -16.9768 | Reject Ho & Accept H1 | Significant |
| 9 | River/Stream | -17.1207 | Reject Ho & Accept H1 | Significant |
| 10 | Pond/Lake/Pool | -17.1207 | Reject Ho & Accept H1 | Significant |
Research survey: 2024
Reliability Test
The internal consistency of the data from the survey was determined with the Cronbach’s alpha. The internal consistency is shown in table 9.0 as 0.89 which is very good by the rating.
Table 9.0: Cronbach’s alpha
| Case Processing Summary | |||||
| N | % | ||||
| Cases | Valid | 304 | 99.99 | ||
| Excludeda | 1 | .01 | |||
| Total | 305 | 100.0 | |||
| a. Listwise deletion based on all variables in the procedure | |||||
| Reliability Statistics | |||||
| Cronbach’s Alpha | N of Items | ||||
| 0.88 | 10 | ||||
CONCLUSIONS
From the results obtained, the following conclusions were made:
- Port Harcourt City LGA doesn’t have a viable or functional safe drinking water source, thus the residents have resorted to alternative sources for drinking water
- Rivers State government (RVSG) have not made any serious commitment or policy towards the provision of potable water supply to the residents of the City for over 30years now
- The quality of most of these sources such as borehole, sachet, harvested rain, lift hand pump, open dug well, river and pond is not guaranteed as they may be contaminated.
- The influencing factors in deciding which source to access are: cost, quality and availability
- Majority of the residents of PH City LGA (78.69%) uses borehole as their drinking water source followed by sachet water (62.17%) and bottled water (33.77%) while only 12.17% have access to irregular potable water supply.
- Only those who can afford bottled water and sachet water had access to it and these packaging materials have become a huge environmental problems to the government
RECOMMENDATIONS
- RVSG should urgently resuscitate the repealed water board law of 1989 since 2012 but without any action
- The problem of accessing quality drinking water is at the mercy of availability. So, RVSG should rehabilitate the existing infrastructures of the 10 water stations managed by Port Harcourt Water Corporation (PHWC) and build more stations across the City
- RVSG should create an enabling ground by promoting co-operation and partnership amongst local and international agencies in the water sector such as; WHO,UNESCO, Sustainable Water Agency for Sub-Saharan Africa (SUWASA-USAID), e.t.c. for potable water delivery.
- NSDWQ, NAFDAC, SON and RVSG should ensure compliance to NIS:NCP: 027 standards of borehole depths to be ≥150ft and ≥328ft for private and government respectively and a minimum distance of ≥30m away from any sewage disposal facility
- NAFDAC, NSDWQ, SON and the relevant agencies should regulate properly the activities of sachet/bottle water producers and all such sources by strictly enforcing their standards [4]
- The government should develop and adopt a modified Integrated Water Resources Management framework to safeguard our water sources
REFERENCE
- Agunwamba, J.C. (2000) Water Engineering Systems. 2nd Ed, Immaculate Publications Ltd, Enugu
- Taiwo, A.M., Towoloan, A.T., Olaanigan, A.A., Oluyimi, O.O. and Arowoli, T.A. (2015).2 Comparative assessment of groundwater quality. Australia government National health and medical research council
- Federal Environmental Protection Agency, FEPA. (1991). Guidelines and Standards for Environmental Pollution Control in Nigeria, Abuja. Gadgil
- Emeka, U (2010) Rural Water Supply and the MDGs: A sustainable Approach. Paper presented at the Conference of the Association of Professional Women Engineers of Nigeria (APWEN) Owerri Chapter, Imo State
- United Nations Environment Programme, UNEP (2011) Environmental Assessment of Ogoniland. Nairobi, Kenya
- World Health Organisation (WHO), (2022) Global Water Security & Sanitation Partnership, Retrieved June 24th, 2023, from: https://punching.com/report-says-70-million-nigerians-lack-potable-water/
- Udom, G. J., Ushie, F. A., Esu, E. O., & Oofojekwu, P. C. (2002). A Geochemical Survey of Groundwater in Khana and Gokana Local Government Areas of Rivers State, Nigeria. Journal of Applied Sciences and Environmental Management, 6 (1), 53-59.
- Ojo, O. I., Otieno, F. A. O., & Ochieng, G. M. (2012). Groundwater: Characteristics, qualities, pollutions and treatments: An overview. Journal of Water Resources and Environmental Engineering, 4(6), 162-170.
- Ojukwu, G.O., Nwankwoala, H.O. (2022) Status of Public Water Supply Facilities in Port Harcourt Metropolis. International Journal of Environment Protection and Policy, Vol. 10(2), 31-38 doi: 10.11648/j.ijepp.20221002.13
- Babatunde, M.A, and Biala, M.I. (2010). Externality Effects of Sachet Water Consumption and the Choice of Policy Instruments in Nigeria. Evidence from Kwara State. Journal of Economics, 1(2), 113-131
- Adeleke, P (2011): Impact of Purification in Health Management. Journal of Health Science, Community Health Management System. Vol.8 No.3
- Ayotamuno, A. and Enu-Obari, N. E. (2017) “How has Population Growth and Demand for Housing Affected Land Use in Port Harcourt, Nigeria” Global Educational Research 5(3), 563-578
- Weather Spark (2024) Climate and Average Weather Year Round in Port Harcourt. Retrieved June 10th, 2024, from: http://weatherspark.com/y/54960/Average-weather-in-Port-Harcourt-Nigeria-Year-Round
- NIMET, (2018) Seasonal Rainfall Report and Prediction (SRP), Nigerian meteorological Agency Publication, Abuja
- National Bureau of Statistics, NPC. (web), (2023) Port Harcourt City Local Government Area in Rivers State in Nigeria. Retrieved June 10th, 2024, from: https://www.citypopulation.de/en/nigeria/admin/rivers/NGA033022 port harcourt/
- Wami, M, Fisher, J. (2015) Effect of Poor Performance of Water Utilities in Port Harcourt City Nigeria presented at the 38th WEDC Int’l Conference, Loughborough University, UK