
Evaluation of Hydrocarbon Charge and Leakages using Chimney Cube: Examples from the Deep Offshore Niger Delta Basin, Nigeria.
- Eje, E. O
- Ideozu, R. U
- Ugwueze, C. U
- 73-90
- Sep 29, 2023
- Earth Science
Evaluation of Hydrocarbon Charge and Leakages using Chimney Cube: Examples from the Deep Offshore Niger Delta Basin, Nigeria.
1Eje, E. O, 2Ideozu, R. U & 3Ugwueze, C. U
Department of Geology, Faculty of Science, University of Port Harcourt, Rivers State, Nigeria.
DOI: https://doi.org/10.51244/IJRSI.2023.10909
Received: 27 July 2023; Accepted: 31 August 2023; Published: 29 September 2023
ABSTRACT
This research investigated hydrocarbon charge and leakages using chimney cube in Woda Oil Field, Western Offshore Niger Delta. The data sets used include well logs and 3D Post Stack Depth Migration (PSDM) seismic volume. The reservoir zone was identified, using well log data (gammaray, resistivity, and Vp sonic logs). The Chimney cubes generated from Supervised Neural Network (SNN) validated the identified chimney morphologies, gas zones and was overlain on interpreted reservoir surfaces D, G and I. Majority of the chimney morphologies identified are type I and II that nucleated in the lower part of the faulting system below the partially permeable portion of the fault planes and across the regional partially permeable barrier as revealed by thin fault likelihood attribute (TFLA) and fault polygons. Gas expulsion occurring along the lower portion of the complex faulting system may have preconfigured the spatial organization of the chimney morphologies. The anisotropic stress pattern around the tectonic and anisotropic polygonal faults coupled with the partially permeable faults may have determined the directions of long-term gas migration pathway and linear geometries of the chimney morphologies. Pockmarks formed above the chimney morphologies may have inherited the same linear planform geometry that recorded the timing of gas leakage and paleo-stress pattern of the study area and thus used as a tool to reconstruct the orientations of stress patterns in the sedimentary successions within the Woda oil field. The character of the chimneys and well log interpretation were used to evaluate the petroleum system in the study area.
Keywords: Hydrocarbon Charge, Chimney Cube, Deep Offshore, Anisotropic Stress
INTRODUCTION
Chimney cube is a 3D volume of seismic data which highlights vertical chaotic behavior of seismic characters/characteristics (Aminzadeh et al.,2002). These chaotic behaviors of seismic characters are often associated with gas chimneys or shallow gas hydrate. The cube facilitates the interpretation of gas chimneys as it reveals information on the hydrocarbon history, migration pathways and fluid flow models. Chimney cubes may also reveal paragenesis of hydrocarbons, how they migrated into a prospect zone and how they spilled from the prospect zones resulting in the formation of shallow gas, mud volcanoes or pock marks at the sea/ocean bottom. Gas chimney processing was carried out on 3D seismic data acquired over Woda Oil Field using Artificial Neural Network (ANN), with a view to identifying different chimneys morphologies in the study area(Fig.1). The ANN was deployed in this research because, it combines different seismic attributes within default windows to distinguish gas chimney morphologies. Neural Network (NN) -based methods, have advantages such as; noise tolerance and their ability to fully capture and account for the non-linear relationship between seismic data and reservoir properties, as well as nonlinear transformation of seismic attributes(Aminzadeh et al.,2002).
Previous researchers have documented that, hydrocarbon migration may be impacted by subsurface structures such as faults and salt/shale diapirs (Roberts and Carney, 1997; Farerola et al.,2015). The directions of fluid flows in the subsurface and distribution of leakage sites on the ocean/sea floor may be preconfigured by faults, salt/shale diapirs and preexisting structures (Thrasher et al.,1996). The morphology of these structures may aid fluid leakages and record the style, intensity of fluid expulsion which may be useful for deciphering the fluid migration history (Ho et al., 2018).3D seismic reflection data have played important role in the visualization and identification of fluid flow features and vertical succession of fluid leakage expression around faults such pockmarks (Heggland, 2005). Hence, it is possible to unravel the timing as well as the pathways of migrating fluids and the sealing integrity of faults (Plaza Faverola et al.,2015; Ho et al.,2018 and Alzaki, 2016).Recent studies of some offshore Niger Delta fields revealed the existence of different types of chimneys morphologies (Falebite et al.,2017). In addition, similar fields in the lower Congo Basin and offshore Angola have revealed various types of Chimney morphologies such as type I and II (Ho et al.,2017, 2018).
Hovland (1984) documented several types of chimney morphologies using high resolution 2D seismic data from the North Sea that exhibited irregular and elongate planform geometries with rounded summits, variable widths and lengths ranging from hundreds of meters to about 1km and was interpreted as gas escaping along fractures or faults from the apices of underlying folds. Host of t et al.,(2010) documented chimney morphologies having elliptical cross-sections in 3D view using 3D seismic data and were the first to analyze the planform ratio of chimney morphologies and suggested that preferred orientation of the long axis of elliptical planforms of chimney morphologies was caused by local stress compression. In contrast chimney morphologies occurring in the Lower Congo Basin are string – like in map view, vary in width and have blunt termination with sharp tips and were rooted parallel to the plains such that, the geometrical arrangement of the fault stress field may have affected the formation of the linear chimney morphologies and the linear position of chimney morphologies(Ho et al., 2017,2018).
Geology of the Study Area
The Niger Delta clastic wedge formed along a failed arm of a triple junction system that developed during breakup of the South American and African plates late Jurassic (Burke et al.,1972; Whiteman, 1982). The wedge continued to prograde during Middle Cretaceous time into a depocenter located above the collapsed continental margin – at the site of the triple junction. Sediment supply was mainly along drainage systems that followed the failed rift arms – the Benue and Bida Basins. Sediment progradation was interrupted by episodic transgressions during Late Cretaceous while structural traps formed during syn-sedimentary deformation of the Agbada Formation (Evamy et al.,1978; Stacher, 1995), and stratigraphic traps formed preferentially along the delta flanks (Beka and Oti, 1995) that defined most reservoirs within the Niger Delta Complex. The primary seal rocks are interbedded shales within the Agbada Formation and comprise of three types of seals; clay smears along faults, sealing units juxtaposed against reservoir sands due to faulting and vertical seals produced by laterally continuous shale-rich strata (Doust and Omatsola, 1990). Major erosion events of early to middle Miocene age formed canyons filled with shale provided top seals on the delta flanks of some offshore fields (Doust and Omatsola, 1990) – see Fig. 2.
The stratigraphy of the Niger Delta clastic wedge has been documented during the early phase of oil exploration and production. Most stratigraphic schemes remain proprietary to the major oil companies operating concessions in the Niger Delta Basin. Stratigraphic evolution of the Tertiary Niger Delta and underlying Cretaceous strata is described by Short and Stauble (1967). Petroleum geology of the Niger Delta is described in Evamyet al.,(1978), Doust and Omatsola (1990) and Tuttle et al.,(1999). Stacher (1995) developed a hydrocarbon habitat model for the Niger Delta based on sequence stratigraphic methods. Allen (1965) described depositional environments, sedimentation and physiography of the modern Niger Delta. The three major lithostratigraphic units defined in the subsurface of the Niger Delta includes, Akata Formation, Agbada Formation and Benin Formations.
The above formations decrease in age basin ward, reflecting the overall regression of depositional environments within the Niger Delta clastic wedge.
Statement of Problems
Most producing oil fields in the Niger Delta are located in offshore depo belts and predominantly have complex structures such as rollover anticlines, faults, shale diapirs and seals with attendant fears of over pressure, seal failure and blow out which may arise during drilling operation (Awolola and Ideozu, 2019; Ideozu et al., 2020). Secondly, most basins worldwide are dominated by vertical hydrocarbon migration which is often recognized in seismic data as zone of diffuse, often low amplitude reflectivity called gas chimneys, gas cloud, mud volcanoes etc., based on their morphologies. Because of the diffuse nature of gas chimneys, they are difficult to map in seismic data, (Connolly et al., 2012). Hence, this research seeks to access vertical top seal and charge risk using chimney morphologies to reduce exploration risk and as well document active gas conduit using seismic attributes and chimney cubes.
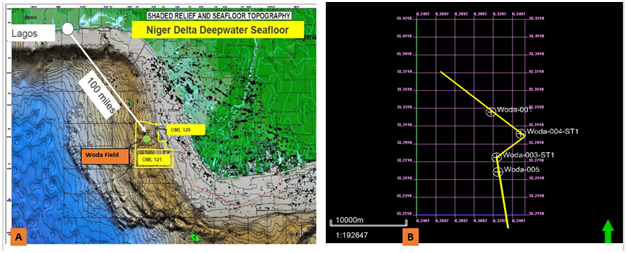
Fig. 1(A): Satellite map of Woda Oil Field (B): Base map showing spatial distributions of wells
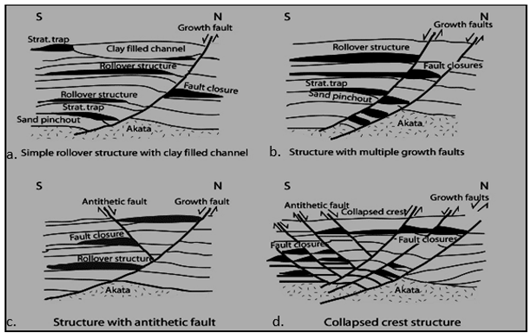
Fig. 2: Niger Delta oil field structures and associated traps (a.) Simple rollover structure with clay filled channel, (b.) Structure with multiple growth fault (c.) Structure with antithetic fault (d.) Collapsed crest structure. Modified from Doust and Omatsola (1990) and Stacher (1995).
MATERIALS AND METHODS
The data sets for this research were provided by SPDC operating within the study area with approval of the Nigeria Upstream Regulatory Commission (NUPRC). The data sets include 3D seismic data of Woda Oil Field and 3D profile lines, Four (4) wells (with Gamma Ray, Resistivity, Density, Neutron and Sonic logs), Well deviation data, Well heads and Check shots. The methods adopted for this research are Seismic and well log interpretation using Schlumberger Petrel (2018 Version) and Chimneys processing using Opend Tech 6.6 Pro version. The Well log data and seismic volume were loaded into Petrel 2018 version software (See Fig. 3).
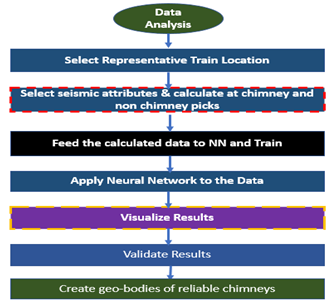
Fig. 3 Methodology used in the Chimney processing workflow
3D Seismic Data
A 3D seismic data with zero-phased reflectivity (RZP) and Pre-Stack Depth Migration (PSDM) was used because it has better resolution compared Pre-Stack Time Migration (PSTM) which do not have reflection continuity of horizons and poor imaging behind faults. Synthetics were generated from Woda -001 well log with sonic and density logs tied to the seismic data for lithological identification. The Shell seismic polarity was adopted where the soft loops on seismic ties to sand (red) and the hard-negative loop ties to shale (Blue).
Time to Depth Data
The time maps generated from the interpreted horizons and depth converted using Linvel velocity modelling function as it had the lowest residuals among Adlinvel velocity modelling suites. See Fig. 4.
Where:
V = Vo + kZ (Equation 1)
Vo = Velocity at datum
Z = Distance of the point from datum
K= Factor showing velocity change in the vertical directions
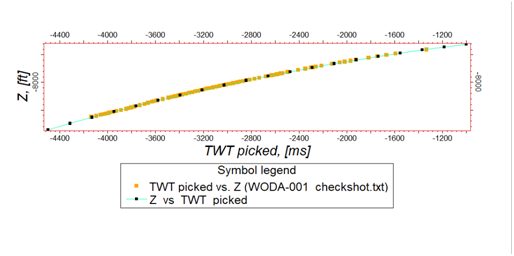
Fig.4 Time depth curve from check sot data of Woda -001 well.
Neural Networks (NN):
NN have recently gained popularity amongst the petroleum industry and the NN is a nonlinear transformation between input parameters and the desired output. Import features of NN is that, there is no attempt to derive explicit nonlinear relationships unlike the conventional regression analysis. The NN is a collection of optimum weights which is derived to relate the output of the nodes to their input using the available data, (Dg b Earth Science Training Manual 2021). These weights, combined with the intrinsic nonlinear (sigmoid) functions define each node by creating an implicit nonlinear function between the input and output of the entire network. In applying it to chimney morphology identification, the selected attributes were extracted as representative set of data points, recombined into new set of attributes to facilitate the identification process using supervised and unsupervised NN. The difference between the supervised and unsupervised approach is the amount of a-priority information supplied. Supervised learning requires a representative set of examples to train NN. In this research the training set was constructed from real well data and applying the supervised (or competitive learning) approaches to the chimney morphologies identification. Hence, the resulting patterns were interpreted in terms of fluid changes. The neural network is then trained to classify the input location as falling inside or outside the object. Application of the trained network yielded the desired texture and enhanced volume in which the desired objects were easily detected in Woda Oil Field. At the training stage, appropriate weights for the input parameters and the hidden layers (the layers of neural network involving the nodes between the input and the output) are calculated. As these weights stabilize as manifested by the convergence of different attributes, the training process is completed and stopped. The optimal position to stop training is determined by monitoring the network’s performance on an independent test data set. Finally, with an acceptable level of per cent correct classification, the network performs the volume transformation for the entire data set, Connolly et al., 2012.
The following steps summarize the procedure:
Step One: A seed interpretation is made with locations inside manually interpreted chimneys and, in a control, set outside the chimneys (the picks in green for chimney yes and blue for chimney no).
Step Two: At the seed locations various energy and similarity attributes are extracted in three vertically aligned extraction volumes around the location.
Step Three: Step 1 and 2 are repeated to create an independent test set.
Step Four: A fully connected Multi-Layer-Perceptron type of neural network is trained to classify the attributes into two classes representing chimney or non-chimney (output vectors 1,0 or 0,1).
Step Five: The trained network is applied to the entire data set yielding outputs at each sample location. As the outputs are complementary, only the pass output on the chimney node was used to produce the final result, a cube with values between approx. 0 (no-chimney) and 1 (chimney) as shown in (Fig 11 a & b).
RESULTS AND DISCUSSIONS
The results of this research are presented in Figures 5 – 15and Table 1. To establish the lateral continuity of the reservoirs across the field, reservoirs in the study area were identified using Gamma ray (GR), Resistivity (ILD), Neutron (NPHI) and Density logs (RHOB), (Fig. 5).The correlated sand tops were inputted into the synthetic seismogram for Well-to-Seismic tie.
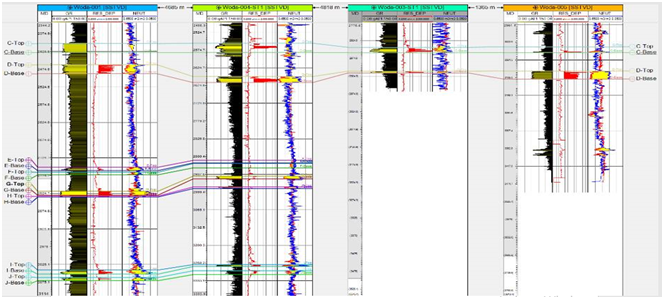
Fig. 5: Log suites used for reservoir top identification and well correlation.
Well to Seismic Tie
Well to seismic tie was carried out on Woda-001 well using seismic Ricker wavelet (analytical method) and convolved with the acoustic impedance/reflectivity log generated from the density and sonic logs with bulk shift of -5.45msec applied which falls within the acceptable threshold. See Fig. 6.
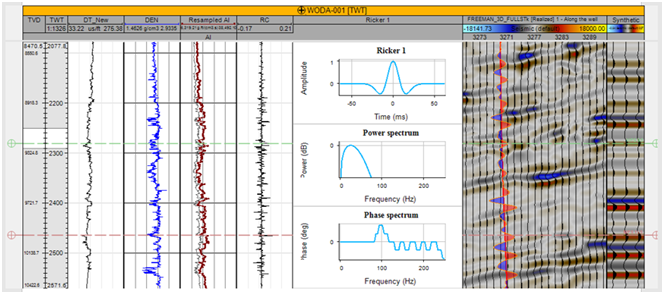
Fig 6: –Well to seismic tie was done for Woda 001 using seismic Ricker wavelet (analytical method).
Lithologic Analysis and Reservoir Description Results
Results of well log analyses revealed sand and shale as lithologies in Woda Oil Field. The identified lithologies vary both laterally and vertically across (Figs. 7 – 10). Eight (8) reservoirs were identified and correlated based on their log signatures – reservoirs A, B, C, D, E, F. G, H, I, and J. However, reservoirs D, G and I were identified and surface maps generated representing all the wells in the study area(Figs.7 -10).
Reservoir D
Reservoir D top and base was located between depths 2462.04(m)-2487.23(m) – thickness is about 25.19(m) in well 001, 2911.02(m)-2915.96(m) – thickness is about 4.94(m) in well 003, 2648.93(m)-2665.81(m) – thickness is about 16.88(m) in well 004, and 3117.09(m)-3143.11(m) –thickness is about 26.02(m) in well 005. The reservoir was thickest in Woda 001 and thinned out in Woda 003, 004 and Woda 005 indicating diapiric activities. Based on the well log signatures, the reservoir was localized within the environment that may favor the accumulation of hydrocarbon. The structures interpreted from seismic lines suggest faults assisted closure – roll over anticline (See Fig. 7).
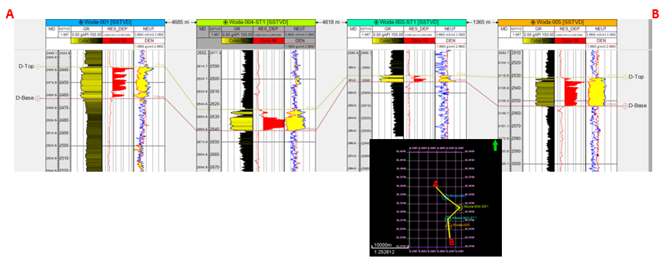
Fig 7: D-Top well correlation flattened on well tops.
Reservoir G
Reservoir G top and base was located at 2818.45 – 2829.74 (m) -thickness is about 11.29 (m) in well 001 (top) and 2943.71 – 2953.13 (m) – thickness is about 9.42 (m) in Well 001 (base). Reservoir G thinned out in Woda 003 and Woda 005. Based on the well log signatures, G reservoir favor accumulation of hydrocarbon. The reservoir is characterized by low seals, enabling migration of gas into top shale seal(Fig. 8a).
Reservoir I
Reservoir I top and base was located at 3040.61(m) – 3052.39(m) – thickness is about 11.78(m) in well 001 and 3273.96 (m) – 3281.24 (m) with a thickness of about 7.28 (m). Reservoir I thinned out in Woda 003 and Woda 005. Based on the well log signatures, reservoir I favor the accumulation of hydrocarbon. The reservoir I is characterized by low seals, enabling migration of gas into top shale seal (Fig. 8b).
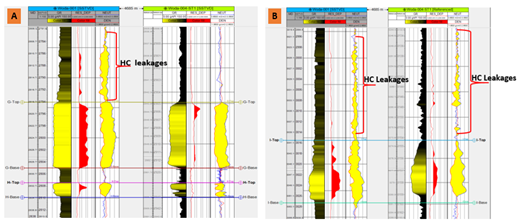
Fig. 8: G-Top well correlation flattened on well tops showing hydrocarbon leakages in well-001(A)Reservoir I-Top well correlation flattened on well tops showing hydrocarbon leakages in well 001 and 004 (B).
Fault Interpretation Results
Sixty (60) faults F1 – F60 were interpreted across Woda Oil Field using the 3D seismic vintage generated for the study area. Variance Edge seismic attributes was created and used to unravel the structural trends of the reservoirs and for the fault picking. From the seismic analyses, faulting may have resulted in reservoir compartmentalization but does not appear to significantly control reservoir distribution and hydrocarbon accumulations. The greater Woda anticline is heavily faulted but the Woda Oil Field appears to have significant faulting towards the NE and western part of the field as revealed by seed grid interpretation and fault polygons. The interpreted faults are polygonal, normal and listric in orientation, with the major boundary fault trending NE-SW. Attributes such as fault and thin fault likelihood attribute (TFL) were used to identify fault and fractures within the study (Fig. 9).Field is structurally controlled by the roll-over anticline formed by NW-SE trending major growth fault, characterized by minor synthetic and antithetic faults. The deeper reservoirs were less faulted compared to the shallower section – anticlines and fault closures were the traps encountered.
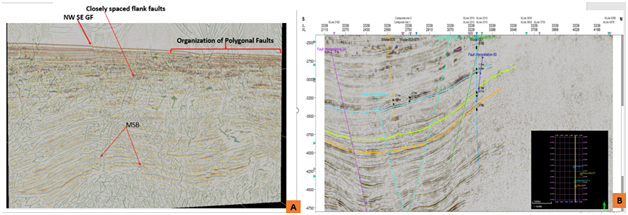
Fig.9: (A) TFL interpretation on inline 3001 showing the major structural boundary fault and polygonal faults. (B) Inline 3339 showing interpreted fault and horizon around Woda-003 and 005 wells.
The horizon interpretation of Woda Oil Field was carried out to define the geometric framework of individual reservoirs and generated surface structural maps (Time and Depth).Horizons associated with strong seismic amplitude anomalies were interpreted with ten (10) reservoir sands (Reservoir A-J) identified, (Fig. 10). Well to seismic tie for Woda-00l indicated that the seismic data phase was closer to reflectivity than acoustic impedance.
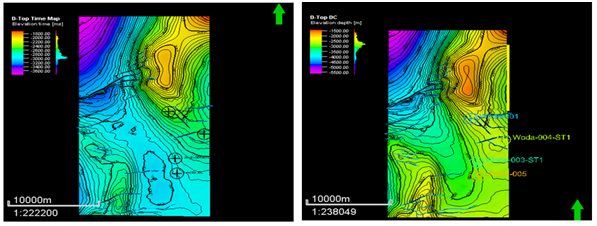
Fig.10a: D-Top Time and Depth Maps.
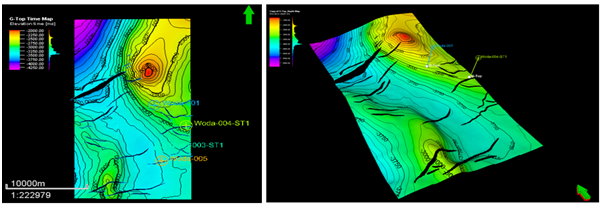
Fig.10b:G-Top Time and Depth Maps.
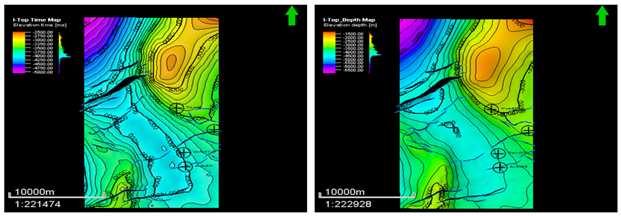
Fig.10c:I-Top Time and Depth Maps.
Chimney Processing Using Seismic Attributes and Supervised NN Results
The results of the chimney cube helped in evaluating the seal integrity and charge capacity of the studied reservoirs in Woda Oil Field. Combined with energy and spectral decomposition attributes, the chimney volumes generated from supervised NN and overlain on reservoirs D, G and I was useful in gaining a better understanding of the petroleum system which served as an indicator for hydrocarbon migration and entrapment in study area.
A dip steering cube and pointset which the NN was trained on were generated see Figure 11. Chimney picking on the key line (green dots) were identified in the seismic dataset whereas non-chimney picks (red dots) were identified in chaotic zones which were not vertically aligned as they may represent debris flows, faults, or poor imaging (d E Groot 2021). From the interpretation window, overlaying the chimney cube on horizons D, G, and I reservoir surfaces alongside with TFL, energy attributes and taking at 200ms time slices above and below the objective reservoirs D, G, and I revealed nucleation and distributions of different chimney morphologies in the study area (Fig. 12).

Fig. 11 -(A) Dip steering cube of Woda Oil Field (B) Pointset showing Chimney Yes (Green) and Chimney No (Red) on 2D view
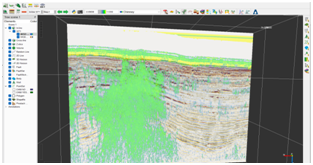
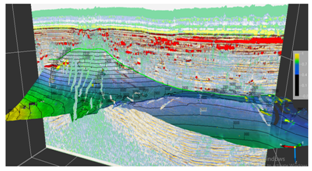
Fig. 12a: Fig. 12b:
Fig. 12a: – Chimney probability results overlaying on the seismic volume in Woda Oil Field. Fig. 12bApplied NN results on the 3D seismic data show a chimney cube which assisted in visualizing the chimneys in relationship to the main reservoir geo-body, and understand better how the reservoir is charged and how the reservoir is leaking.
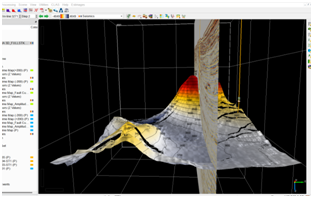
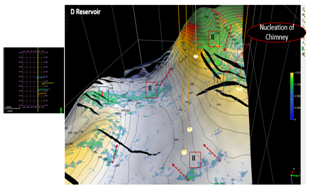
Fig. 12c Fig. 12d
Fig. 12c: Reservoir D Amplitude Surface map displayed on IL3271 in Woda Oil Field. Fig. 13d: Chimney generated cube overlain on D Top reservoir showing vertical charge in North South and East West directions in Woda Oil Field.
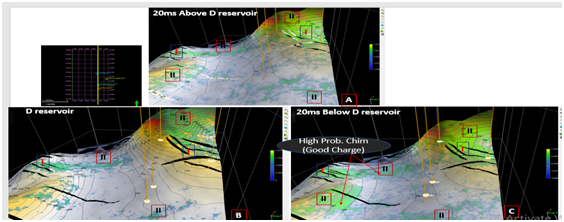
Fig. 12e: (A) Horizon slice showing the chimney probability 200msec above the D Horizon. The chimneys occur in SW and SE corner. (B) Reservoir D Top Horizon showing nucleation of Type (I) Chimneys (red) along fault planes and type II chimneys (black). Type I chimney in (red) (C) 200ms below Reservoir D Top Horizon and north central areas showing evidence of good hydrocarbon charge.
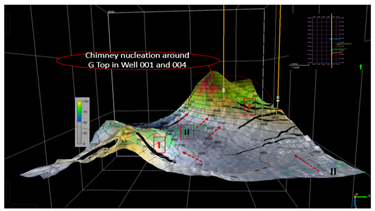
Fig. 12f: Chimney generated cube overlain on G Top reservoir showing Type I and type II chimney morphology which indicate vertical and lateral charge in NS and EW directions in Woda Oil Field.
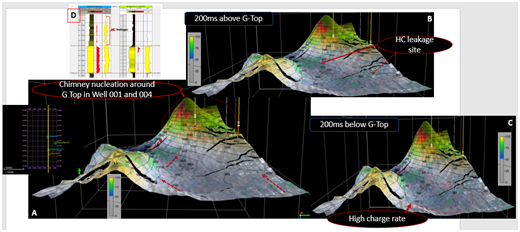
Fig. 12g: (A) Chimney formed on G reservoir surface. (B) Horizon slice showing chimney probability at 200msec above the Top of G horizon. The chimneys occur in SW and SE indicating hydrocarbon leakages validated by well logs. Chimney originates from Eastern flank indicates a possible Flank Leak Trap, validating (Hegland et al., 2000)and there appears to be limited charge to the trap bond. (C) 200ms below G Top Horizon and North Central area indicating high charge. (D) Well logs showing hydrocarbon leakages in Woda well 001
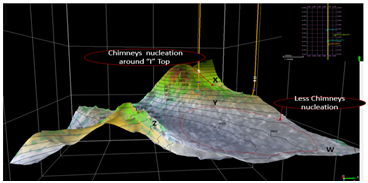
Fig. 12h:Chimney generated cube overlain on Reservoir I Top showing vertical and lateral charge in NS and EW directions in Woda Oil Field. A 3D view of the chimneys from the East shows the vertical extent of reliable chimneys. Reservoir I may be receiving charge from Y and Z Chimneys. Chimney W, on the SE flank appears unconnected to Reservoir I.

Fig. 12i: (A) Reservoir I surface amplitude map overlain on type I and type II chimneys (B) 200ms above I reservoir surface showing nucleation of Chimneys at the flank of boundary fault (Hegland, 2000). (C) 200ms below Reservoir I less chimney nucleation at W indicating less charge. Chimney Z originates from Eastern flank indicating a possible Flank Leak Trap.
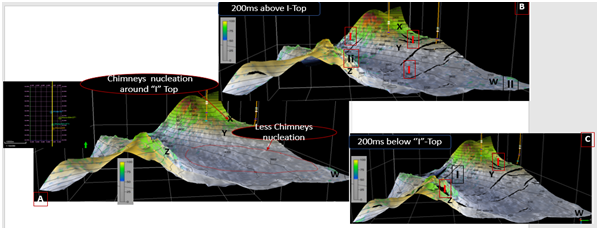
Fig.12j: (A) TFL overlain on Reservoir D Surface with fault polygons showing anisotropic stress distributions (B) Energy Attributes (Red) and Chimney cube (Green) overlain on Reservoir D surface showing fluid migration patterns.
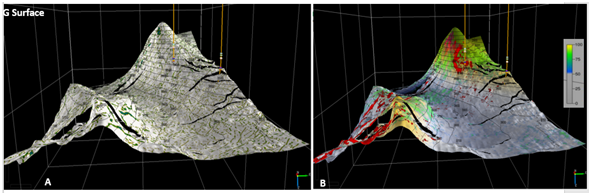
Fig.12k:(A) TFL overlain on Reservoir G surface with fault polygons showing anisotropic stress distributions (B) Energy Attributes (Red) and Chimney cube (Green) overlain on Reservoir G surface showing fluid migration patterns.
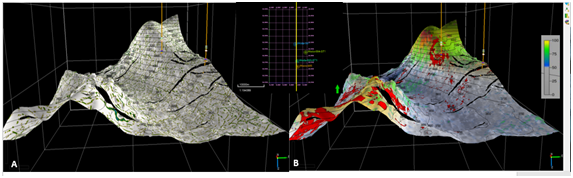
Fig. 12l: (A) TFL overlain on Reservoir I surface with fault polygons showing anisotropic stress distributions (B) Energy Attributes (Red) and Chimney cube (Green) overlain on Reservoir I surface showing fluid migration patterns.
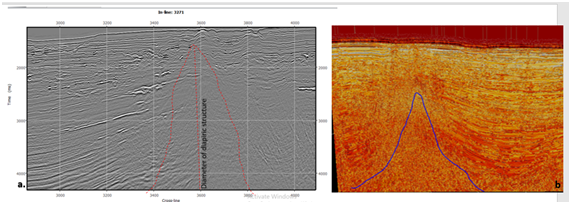
Fig. 12m:(a) Grey scale showing evidence of diapiric structure (b)Frequency Attribute showing dimension of diapiric structure from the deep formations in Woda oil field.
DISCUSSION
Formation of Linear Chimneys in Woda oil Field
According to Meldahl et al (1999), Connolly & Aminzadeh (2003), gas chimneys may be used for geohazard detection as well as an effective exploration tool. Focusing on the vertical chaotic seismic disturbance in Woda Oil Field 3-D seismic data, the chimney attribute volume highlights fluid migration pathways as identified using supervised NN. These seismically recorded gas chimneys may be formed as a result of hydraulic fracturing of an impermeable interval (Pyrak-Nolte, 1996; Heggland, 2005; Løseth et al., 2011; Hustoft et al., 2010). Hydraulic fractures may develop when pore pressure exceeds the sum of the minimum lateral stress and the tensile strength of the sediment above and propagate upwards perpendicular to the direction of the minimum lateral stress (Phillips, 1972; Cosgrove, 1995; Hustoft et al., 2010; Løseth et al., 2009, 2011). In this study area, the observed positive high amplitude anomaly (PHAA) and the associated chimneys extend from the linear gas accumulation resulting in upward and downward terminations of Type-I chimney in maps around fault planes of Woda Oil Field(See Fig.11) and Fig. 12. However, because the gas accumulations may have been compartmentalized by the anisotropic polygonal and syn sedimentary cells and respect the planform of growth fault cells (Figure 12), the polygonal fault networks bond may have formed prior to the gas accumulations and hence modulate the planform development of chimneys and the subsequent fluid features as revealed by the low energy attribute value (red) in Figure 12 j, k and l. The linear planform of chimney morphologies and their spatial relationship to anisotropic polygonal and growth faults suggest gas migration and hydraulic fracture propagation which may have been controlled by the alignments of anisotropic polygonal and syn-sedimentary faults. In this study area, anisotropic polygonal and syn- sedimentary faults followed the orientations of diapiric structures, indicating that these faults have been influenced by the stress states resulting from salt/shale diapers (Carruthers, 2012). The presence of diapiric structure may have perturbed the surrounding stress field and may have affected the adjacent fracture. Thus, the degree of horizontal stress anisotropy and the dominant direction of horizontal intermediate stress play a determinant role in both the formation and geometry of anisotropic polygonal faults as well as different chimney morphologies in Woda Oil Field (Fig. 12).The chimney morphologies from the lower part of the polygonal fault plane may have been formed by over pressured gas expulsion at the flank of the diapiric structure which appears to be in their advanced stage. This hypothesis may be consistent with the fact that, many chimney morphologies distributed in the study area are modern and currently active as indicated by positive high amplitude anomalies (PHAA) and pockmarks at their topmost terminations close to the present-day seafloor (Fig. 12 d- f) while the flank fault planes may have already fully developed since the end of the depositional cycle. The nucleation point of the chimneys may correspond to a level from which fluid may not migrate further along the fault plane which forced the gas to open a new migration path, forming different morphologies of chimneys.
Paleo-Stress Reconstruction
The propagation and resulting morphology of chimneys are receptive to perturbations in magnitude, directions, and differences in the horizontal principal stresses(Ho et al., 2013). Normal faults propagate parallel to intermediate principal stress, while hydraulic fractures open parallel to the direction of intermediate principal stresses and against the minimum principal stress (Cosgrove, 1995). In the syncline area (Figure 13), the orientation of the faulting system may imply that, the direction of the intermediate stress during polygonal fault formation was initially following the curvature of the northern edge of syncline. However, the subsequently formed chimneys tend to be parallel to the curvature of the eastern edge. Because hydraulic fractures open in parallel to the intermediate principal stress and as their alignments may also indicate the direction of intermediate stress, at the point that over pressured gas-charged fluids escaped via hydraulic fractures resulting in chimneys formation, the intermediate stress direction was likely to switched from the northern curvature to the eastern curvature. Thus, the horizontal stress field reoriented during gas leakage after growth fault formations in Woda Oil Field. Next to the NE side of Syncline is an extensional fault set that is observed to parallel the Chimneys which may have been reactivated during the early phase of the faulting system. it is may also be possible that, the reorientation of the stress fields in the area of study may have resulted from the movement of these faults. therefore, comparing the direction of polygonal faulting system and its direction, Chimneys nucleation may be useful t0oling diagnosing the evolutional history of stress fields in the past.
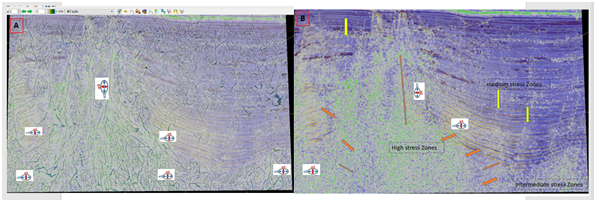
Fig. 13: (A) Dip and Thin Fault Likelihood (TFL) attributes overlay on Woda Seismic Volume (B) Dip attributes showing anisotropic stress distributions within the study area
Fluid Migration Model of Woda Oil Field
Results from Chimney interpretations were used to develop a fluid migration model for the study area. From the interpreted models, gas-charged fluids appear to have migrated vertically from deeper intervals along tectonic faults and laterally into the permeable beds below or at the base of the different faulting patterns. In this study area, anisotropic stress pattern may have resulted in the orientation and distribution of syn sedimentary and polygonal fault patterns as evidenced in fluid migration within the study area as shown in Fig. 14.
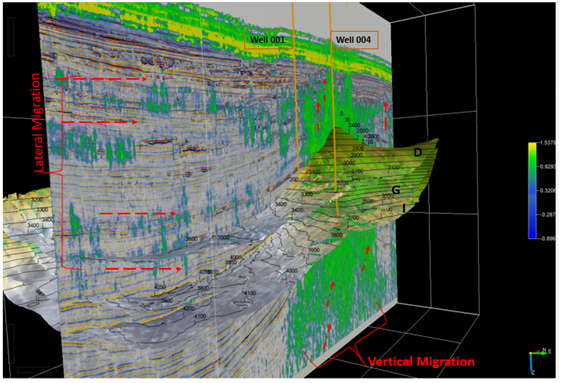
Fig. 14: An overlay of Chimney Cube on D, G and I reservoir surface and seismic volume showing lateral and vertical migration of fluid in Woda Oil Field.
Prospect Analysis of Reservoir D, G and I Reservoirs Using Chimney Cube.
The study area is characterized by high amplitude anomalies probably due to hydrocarbon related processes (Fig. 15). From the exploration point of view, the prospect showed positive charge as large chimney nucleation around the North and S W around Woda 001 and 002 wells. However, less chimney nucleation was observed within the SE region of I reservoir surface. The spatial distribution of gas chimney morphologies above the reservoirs are in alignment with the NE and SW complex faulting system indicating that hydrocarbon may have migrated out of these reservoirs and as such may not be economically viable. Trap classification by Hegland et al (2015) was used to rank reservoir D, G and I reservoirs prospects (Table 1).
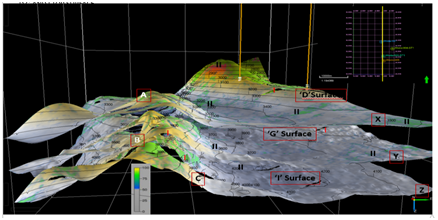
Fig.15: Prospect analysis of mapped reservoirs using chimney cube. ‘D’, ‘G’& ‘I’ Surfaces showing the level of chimneys nucleation with respect to depth. A, B & C shows chimneys evidence at the surface. Chimneys indicate leakage at the flank of the anomalies around SW flank of the reservoirs. However, at the South Eastern region, the chimneys nucleation gradually dies out from ‘D’ surface to ‘I’ as represented by X, Y Z. Chimney type I and II were nucleated in these reservoirs
Table 1: Woda-001 prospect ranking (Modified after Heggland et al., 2015) .
| Parameters | D Reservoir | G Reservoir | I Reservoir |
| Chimney Character | Type I & II Chimney associated with polygonal faulting with II chimneys around Sub seismic faults | Type I &II Chimney (Leaked Trap) | Type I & II Chimney associated with leaked trap |
| Trap type | Fault Seal Trap (High Integrity Trap (HIT) Low chimney distributions above reservoir | Fault Leak Trap (Medium Integrity Trap (MIT) – Low Integrity Trap (LIT). Poses lateral leak | Fault Leak Trap (Medium Integrity Trap (MIT) High chimney distributions above reservoir |
CONCLUSIONS
Chimney Cubes generated through supervised NN validated the identified morphologies and gas zones in the study area. Majority of the chimney morphologies may have nucleated in the lower part of the syn-sedimentary faulting system below the partially permeable portion of the fault planes across the regional partially permeable barrier as mapped by TFL attribute and other generated seismic attributes which overlayed reservoirs D, G and I surfaces. Gas expulsion along the lower portion of the complex faulting system may have preconfigured the spatial organization of the type I and II chimney morphologies. Whereas the anisotropic stress conditions/patterns around the tectonic and anisotropic syn-sedimentary faults coupled with the partially permeable faults determined the directions of long-term gas migration and linear geometries of the chimney morphologies. Pockmarks above the chimney morphologies may have inherited the same linear planform geometry and as such, recorded the timing of gas leakage and paleo-stress state pattern in the study area. The study has established that, chimney cubes generated from Supervised Neural Network can be used to validate the identification of vertical discontinuities and hydrocarbon charge and leakages in offshore areas of the Niger Delta Basin.
RECOMMENDATION
It is advised that, a comparison of gas chimneys in 3D PSDM Seismic lines indicated that further 3D processing may tend to destroy much of the chaotic gas cloud signature by emphasizing mappable surfaces. Hence, the geochemistry of the migrating reservoir fluids should be evaluated to ascertain if truly they migrated into various reservoir compartments as observed in the chimney cubes.
ACKNOWLEDGEMENTS
This work was extracted from the PhD thesis titled: Hydrocarbon Leakages and Anisotropic Stress Patterns on Chimneys Morphologies in Woda Oil Field Western Offshore Niger Delta and supervised by Dr. R. U. Ideozu and Dr. C. U. Ugwueze. The data sets for this study were provided by the SPDC operating within the study area through the approval of the Nigeria Upstream Regulatory Commission (NUPRC) while Dgb Earth Sciences provided the license for OpendTect 6.6 Pro.
REFERENCES
- Allen, J.R. (1965). Late Quaternary Niger Delta, and Adjacent Areas Sedimentary Environment and Lithofacies: AAPG Bulletin, Volume (49), 547-600
- Alzaki, T.T. (2016). 2D seismic data and gas chimney interpretation in the South Taranaki Graben, New Zealand. Master Theses. 7495. https:// scholarsmine.mst.edu/ masters_ theses/ 7495
- Aminzadeh, F., Connolly, D., Heggland, R. & de Groot, P.F.M. (2002). Geo-hazard detection and other application of chimney cubes. Lead Edge, 21, 681-685.
- Awolola, O. K and Ideozu, R. U. (2019). The Application of Short – Time Fourier Transform and Discrete Fourier Transform in Mapping Stratigraphic Features in TMB Field, Niger Delta. Scientia Africana, An International Journal of Pure and Applied Sciences. (Nigeria) Published by Faculty of Science, University of Port Harcourt. Volume 18, Number 1
- Beka, F. T., & M. N. Oti, (1995): The Distal Offshore Niger Delta: Frontier Prospects of a Mature Petroleum Province, Geology of deltas :Rotterdam, A. 237-241
- Burke, K., (1972): Longshore Drift, Submarine Canyons and Submarine Fans in Development of Niger Delta: AAPG Bulletin, v. 56:1975-1983
- Connolly, D., Garcia, R. (2012). Geology & Geophysics-tracking Hydrocarbon Seepage in Argentina’s Neuquen Basin. World Oil, 27, 101-104.
- Cosgrove, J. (1995). The expression of hydraulic fracturing in rocks and sediments, Geology Society of London Special Publication, 92, 187–196.
- dGB Earth Sciences Training Manual (2021): Introduction to OpendTect & OpendTect Pro, Nijverheidstraat 11-27511 JM Enschede, Netherlands.
- de Groot, P.F.M., (1999). Volume transformation by way of neural network mapping. EAGE conference, Helsinki, 7-11 June
- Doust, H., Omatsola, E. (1990). Niger Delta “Divergent/Passive Margin Basins”. American Association of Petroleum Geologists Memoir, 48, 239-248.
- Evamy, B. D., Haremboure, J., Kamerling, P., Knaap, W. A., Molloy, F. A., & Rowlands, P. H., (1978): “Hydrocarbon habitat of Tertiary Niger Delta” .AAPG Bulletin. 62, 277-298.
- Falebita, D.E. (2017). Analysis of Seismic Gas Chimney Distribution Using Artificial Neural Network- A Case of Shallow Offshore Field, Niger Delta, Nigeria. Petroleum Coal, 59(6), 808-819
- Heggland, R. [2015] Hydrocarbon Trap Classification Based on Associated Gas Chimneys. In: Aminzadeh, F. Berge, T. and Connolly, D. (Eds) Hydrocarbon Seepage: From Source to Surface. SEG AAPG Geophysical Developments, 16, 221-230
- Heggland, R. (2005). Using gas Chimneys in seal integrity analysis; A discussion based on a case history, in evaluating fault and cap rock seals.: American Association of petroleum Geologist, Tulsa, USA.
- Heggland, R., Meldahl, P., de Groot, P., & Aminzadeh, F. (2000). Seismic chimney interpretation examples from the Norh Sea and the Gulf of Mexico. American Association of petroleum Geologist, Tulsa, USA
- Ho, B. D., Haremboure, J., Kamerling, P., Knaap, W. A., Molloy, F. A., & Rowlands, P. H. (1978). “Hydrocarbon habitat of Tertiary Niger Delta”. American Association of Petroleum Geologists Bulletin, 62, 277-298.
- Ho, S., Imbert, P., Hovland, M., Wetzel, A., Blouet., J., & Caruthers, D. (2018). Downslope shifting pockmarks: Interplay between hydrocarbon leakage, sedimentation, currents and slope’s topography. International Journal of Earth Science, 107, 1-23.
- Ho, S., Carruthers, D., & Imbert, P. (2017). Insights into the permeability of polygonal faults from their intersection geometries with Linear Chimneys: a case study from the Lower Congo Basin, Carnets Geology, 16, 17–26.
- Hoveland, M. (1984). Elongated depression associated with pockmarks in the western slope of the Norwegian Trench. Marine Geology, 51, 35-46.
- Huvesoft, S., Bunz, S., and Mienert, J. (2010). Three-Dimensional seismic analysis of the morphology and spatial distribution of chimneys beneath the Nyegga pockmark field, Offshore and Mid-Norway, Basin Reserves, 22, 465-480.
- Ideozu, R. U, Awolola, O. K and Emujakporue, G. O. (2020). Comparative Analysis of Short – Time Fourier Transform and Discrete Fourier Transform in Mapping Stratigraphic Features in TMB Field, Niger Delta. Journal of Mining and Geology, (Nigeria) Volume 56(1). Pages 17 – 22. Published by Nigerian mining and Geoscience Society
- Løseth, H., Wensaas, L., Arntsen, B., Hanken, N.-M., Basire, C., and Graue, K., (2011): 1000 m long gas blow-out pipes, Petrol. Geol., 28, 1047–1060.
- Meldahl, P, Heggland, R., de Groot, P.& Bril, A.,(1999). The Chimney Cube, an example of semi-automated detection of seismic bodies by directive attributes and neural network 69th SEG conference in Houston, 31-10- ‘99 until 5-11- ‘99
- Phillips, W. J., (1972): Hydraulic fracturing and mineralization, Geol. Soc., 128, 337–359
- Plaza-Faverola, A., Mienert, J. (2015). Role of tectonic stress in seepage evolution along the gas hydrate charged Vestnesa Ridge. Geophysics Resources, Letter 42, 733-742.
- Pyrak-Nolte, L., (1996): The seismic response of fractures and the interrelations among fracture properties, in: Proceeding of International journal of rock mechanics and mining sciences and geomechanics abstracts, Great Britain, 787–802.
- Robert, H.H., Carney, R.S. (1997). Evidence of episodic fluid, gas and sediment venting on the Northern Gulf of Mexico continental slope, Economic, Geology, 92, 863-879
- Short, K. C. and J. Stauble, (1967): Outline of Geology of Niger Delta. American Association of Petroleum Geology Bulletin, 51, 761-779.
- Stacher, P., (1995): Niger Delta Petroleum Habitat. NAPE Bulletin. 9, 67-76.
- Thrasher, J., Fleet, A.J., Hovland, M., & Duppenbecker, S. (1996). Understanding Geology as key to using seepage in exploration: The spectrum of seepage styles in hydrocarbon migration and its near-surface expression, American Association of Petroleum Geologists Memoir (66), Tulsa, USA.
- Whiteman, A., (1982): Nigeria: It’s Petroleum Geology, Resources and Potential. Journal of African Earth Sciences, 1,177-180.