
Evaluation of Noise Level in Selected Primary Schools in Ikorodu Division Area of Lagos State, South-Western, Nigeria
- Okedeyi Abiodun Sakiru
- Atilade Adesanya Oluwafemi
- Akinyemi Joseph
- Idowu Ibikunle Albert
- 18-27
- Dec 26, 2023
- Education
Evaluation of Noise Level in Selected Primary Schools in Ikorodu Division Area of Lagos State, South-Western, Nigeria
Okedeyi Abiodun Sakiru1*, Atilade Adesanya Oluwafemi2, Akinyemi Joseph3 and Idowu Ibikunle Albert3
1Department of Physics Science Education, Lagos State University of Education, Oto-Ijanikin, Lagos State
2Department of Physical Sciences, Lagos State University of Science and Technology, Ikorodu, Lagos State
3Department of Mathematical Sciences, Lagos State University of Science and Technology, Ikorodu, Lagos State
*Corresponding Author
DOI: https://doi.org/10.51244/IJRSI.2023.1012002
Received: 04 August 2023; Revised: 22 November 2023; Accepted: 27 November 2023; Published: 26 December 2023
ABSTRACT
Noise pollution is a significant issue of concern other than air and water pollution since it harms physical, psychological and social wellbeing. This research work is to evaluate the noise (dB) levels in twelve primary schools selected using stratified random sampling from six Local Council Development Area (LCDA) within Ikorodu Division of Lagos State. Noise level, humidity and temperature measurements were carried out at three points within the school premises of selected schools at time intervals of 8 am to 9 am, 10 am to 11 am and 12 noon to 1 pm using a factory-calibrated Digital Sound Level Meter AS844+. The data collected were subjected to statistical analysis both descriptive and inferential. The results obtained revealed that the average noise levels are 71.54 dB between 8 am and 9 am, 73.65 dB between 10 am and 11 am and 71.75 dB between 12 noon and 1 pm. Average humidity ranges from 66.45% and 61.01% while average temperature ranges from 31.09 0C to 33.19 0C. These noise levels were significantly above the World Health Organization’s recommended school noise levels of 35 dB for classrooms and 55 dB for playgrounds. This study creates awareness on the level of noise in primary schools and also promotes a simple method for regular assessment of the noise levels in these environments towards encouraging an action plan on the part of Government.
Keywords: Digital Sound Level Meter, Humidity, Mental Well-being, Noise Level, Statistical Analysis, World Health Organization
INTRODUCTION
Noise is any unwanted, unpleasant, unexpected, and louder sound than threshold limits that are adjudged to be annoying and distracting. (Ryherd, 2016; Farina, 2017; Farooqi et al., 2020; Atilade et al., 2022). Noise Pollution is recognized as a major problem for the quality of life in urban areas all over the world (Atilade et al., 2019).
In schools, speech is rarely transmitted to children without interference from background noise. At the same time, the effective transmission of auditory information is essential for better academic performance (Crandell and Samaldino, 2000; Fidencio et al., 2014). Noise is not only a nuisance in schools but also interferes with performance in educational activities as teachers feel uncomfortable while teaching in noisy classrooms thereby making students feel uncomfortable in receiving the information, as well as in dispersion of attention (Fidencio et al., 2014).
To be able to hear and understand spoken messages in classrooms, the World Health Organization (WHO) recommends that in school classrooms and pre-schools, the background sound level should not exceed 35 dB(A) during teaching sessions. Also, school outdoor/playground noise level should not exceed 55 dB(A), the same value given for outdoor residential areas in the daytime (Berglund et al., 1999; Ochiabuto et al., 2021).
In Nigeria, the National Environmental Standards and Regulations Enforcement Agency’s (NESREA) maximum permissible noise level specification for the general environment such as buildings used as hospitals, convalescence homes, homes for the aged, sanatorium, institutes of higher learning, conference rooms, public library, environmental or recreational sites is 45 dB(A) (NESREA, 2009; Ochiabuto et al., 2021). Despite these specifications, many children in Nigeria do not have access to ideal or serene learning environments (Ana et al., 2009; Ochiabuto et al., 2021).
This study was conducted basically to determine the noise dB(A) levels in primary schools within Ikorodu division of Lagos State, Nigeria. Sound level intensity is measured in decibels (dB). 1 dB is the amplitude of sound that a human ear can hear. If the amplitude of pressure fluctuation is P, the sound level in decibels is given by equation (1) (Marathe, 2012; Atilade et al., 2019).
![]() (1)
(1)
Location of the Study Area
Ikorodu (Figure I) lies approximately 36 km north of Lagos. The Division consists of Ikorodu Local Government, and five Local Council Development Areas including Igbogbo-Baiyeku, Ikorodu North, Ikorodu West, Imota and Ijede. The Division serves as the entrance to the country’s hinterland (Lagos State Government, 2021).
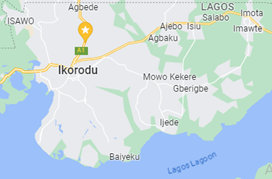
Figure I: Map of Ikorodu showing study environments (Source: Olaleye and Ogunbajo, 2015)
The area of investigation covers twelve selected primary schools within Ikorodu division of Lagos State.
MATERIALS AND METHODS
The equipment required for data acquisition includes the following: Digital Sound Level Meter AS844+ (Figure II) capable of measuring noise level, temperature and humidity of the selected locations, HTC -2 Clock, Temperature and humidity measuring device (Figure III) and 30m – tape rule (Figure IV).

Figure II: Digital Sound Level Meter AS844+ (Source: Physics Laboratory, Lagos State University of Science and Technology).
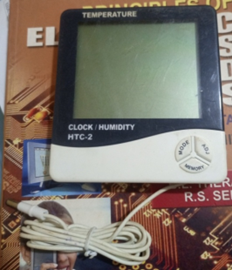
Figure III: Digital Clock/Humidity HTC-2 (Source: Physics Laboratory, Lagos State University of Education).
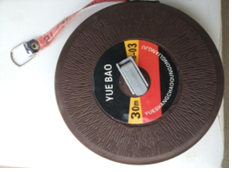
Figure IV: 30-Metre Tape Rule (Source: Physics Laboratory, Lagos State University of Science and Technology).
Twelve (12) public primary schools were selected using stratified random sampling from six Local Council Development Area (LCDA): Igbogbo – Bayeku, Ikorodu Central, Ikorodu North, Ikorodu West, Ijede, and Imota making up Ikorodu Division of Lagos State resulting in two primary schools per LCDA selected using simple random sampling. The primary schools include Anglican Primary School Ijede, African Bethel Primary School Maya, Methodist Primary School Ikorodu, Methodist Primary School Igbogbo, Methodist Primary School Gberigbe, LA Primary School Imota, LGA Primary School Isiu, Ipakodo Primary School, Lagos State Model Primary School Igbokuta, C&S Primary School Majidun, Universal Primary School Ajaguro Ishawo and Igbogbo Bayeku Primary School.
Noise levels in the schools were measured using a factory-calibrated Digital Sound Level Meter AS844+ set at the slow response mode with A-weighted decibels [dB(A)]. Noise measurements were conducted from 8 am to 9 am, 10 am to 11 am and 12 noon to 1 pm respectively. Measurements were conducted at three points in both the classrooms and school playgrounds and data is presented as mean noise level [dB(A)]. Temperature and humidity measurements were conducted along with the noise level measurements. Data acquired were analysed with SPSS version 23 software and data were subjected to statistical analysis both descriptive and inferential.
RESULTS AND DISCUSSION
The average data for each location at different periods of measurement are presented in Table I.
Table I: Average measurements of Temperature, Humidity and Noise level at twelve selected locations
| 8am – 9 am | 10am – 11am | 12noon – 1pm | |||||||
| School | Temperature/0C | Humidity/% | Noise Level/dB | Temperature/0C | Humidity/% | Noise Level/dB | Temperature/0C | Humidity/% | Noise Level/dB |
| Anglican Pry Schl Ijede | 27.69 | 68.23 | 76.10 | 27.66 | 69.44 | 75.21 | 26.88 | 76.72 | 65.55 |
| 29.75 | 71.23 | 68.96 | 28.54 | 79.74 | 67.37 | 27.52 | 84.77 | 62.94 | |
| 29.59 | 67.54 | 71.54 | 31.60 | 56.98 | 74.87 | 33.34 | 54.91 | 73.15 | |
| African Bethel Pry Sch Maya | 29.77 | 70.04 | 68.46 | 29.90 | 69.14 | 76.10 | 31.74 | 63.54 | 74.47 |
| 31.95 | 65.23 | 68.02 | 31.56 | 66.23 | 76.25 | 34.32 | 59.26 | 74.27 | |
| 29.74 | 70.97 | 62.78 | 32.26 | 60.41 | 65.84 | 34.16 | 47.21 | 65.11 | |
| Methodist Pry Sch Ikorodu | 25.81 | 85.21 | 73.51 | 26.28 | 81.77 | 72.89 | 27.75 | 74.90 | 63.49 |
| 27.15 | 83.48 | 80.31 | 27.52 | 78.92 | 71.40 | 28.93 | 75.92 | 78.66 | |
| 26.38 | 79.13 | 73.38 | 28.46 | 68.87 | 75.63 | 29.77 | 63.25 | 73.57 | |
| Methodist Pry Sch Igbogbo | 29.74 | 70.97 | 62.78 | 32.26 | 60.41 | 65.84 | 34.16 | 47.21 | 65.11 |
| 29.59 | 67.54 | 71.49 | 31.60 | 56.98 | 74.87 | 33.34 | 54.91 | 73.15 | |
| 32.63 | 57.90 | 66.59 | 33.49 | 53.15 | 75.42 | 35.01 | 47.07 | 70.51 | |
| Methodist Pry Sch Gberigbe | 32.70 | 62.57 | 69.70 | 32.87 | 62.70 | 77.10 | 33.16 | 61.52 | 72.43 |
| 34.16 | 60.06 | 69.48 | 34.46 | 60.21 | 78.04 | 36.64 | 54.91 | 73.15 | |
| 35.25 | 57.48 | 72.32 | 35.53 | 58.62 | 82.39 | 35.21 | 59.49 | 77.65 | |
| LA Pry Sch Imota | 30.02 | 74.74 | 47.52 | 29.76 | 74.93 | 75.71 | 32.63 | 59.84 | 64.44 |
| 28.23 | 82.10 | 63.51 | 28.30 | 79.82 | 69.70 | 30.11 | 71.75 | 65.83 | |
| 29.42 | 81.69 | 71.90 | 29.34 | 80.23 | 74.60 | 30.89 | 73.26 | 71.14 | |
| LGA Pry Sch Isiu | 32.05 | 69.83 | 71.90 | 33.59 | 64.78 | 69.67 | 36.17 | 57.20 | 70.78 |
| 32.47 | 68.93 | 65.08 | 32.96 | 65.94 | 61.67 | 35.19 | 61.36 | 70.45 | |
| 30.16 | 74.39 | 62.11 | 31.59 | 70.34 | 70.44 | 33.49 | 66.39 | 68.24 | |
| Ipakodo Pry Sch | 27.68 | 75.20 | 69.92 | 28.36 | 72.61 | 64.44 | 31.80 | 63.13 | 70.90 |
| 28.33 | 71.87 | 80.41 | 31.36 | 63.31 | 72.04 | 27.73 | 74.06 | 71.96 | |
| 27.58 | 76.66 | 79.17 | 29.05 | 72.05 | 79.88 | 31.60 | 63.01 | 71.18 | |
| Lagos State Model Pry Sch Igbokuta | 34.06 | 67.27 | 67.27 | 34.90 | 61.13 | 79.70 | 33.98 | 62.09 | 79.05 |
| 32.49 | 61.52 | 74.79 | 31.80 | 62.92 | 70.83 | 32.78 | 57.74 | 66.01 | |
| 32.65 | 66.67 | 78.00 | 32.90 | 65.36 | 78.21 | 33.55 | 60.89 | 73.69 | |
| C&S Pry Sch Majidun | 31.57 | 57.61 | 84.39 | 33.40 | 56.43 | 82.16 | 32.91 | 58.79 | 75.72 |
| 31.52 | 36.80 | 72.81 | 38.71 | 29.69 | 72.56 | 40.49 | 54.33 | 63.72 | |
| 31.86 | 60.82 | 78.42 | 34.01 | 60.23 | 77.81 | 34.27 | 58.30 | 76.91 | |
| Universal Pry Sch Ajaguro, Ishawo | 31.57 | 57.11 | 83.66 | 34.55 | 57.83 | 67.57 | 34.77 | 57.52 | 73.89 |
| 31.27 | 54.36 | 76.54 | 35.59 | 55.68 | 71.93 | 34.71 | 57.08 | 76.53 | |
| 32.38 | 52.08 | 73.93 | 38.01 | 49.98 | 66.37 | 37.30 | 51.65 | 72.24 | |
| Igbogbo Bayeku | 37.79 | 52.90 | 81.02 | 35.94 | 54.70 | 82.93 | 34.98 | 57.04 | 81.98 |
| 38.92 | 50.61 | 66.04 | 36.77 | 51.98 | 73.39 | 36.81 | 51.12 | 80.85 | |
| 35.26 | 61.46 | 71.64 | 37.04 | 55.17 | 80.44 | 36.89 | 54.22 | 74.18 | |
| Average | 31.09 | 66.45 | 71.54 | 32.28 | 63.57 | 73.65 | 33.19 | 61.01 | 71.75 |
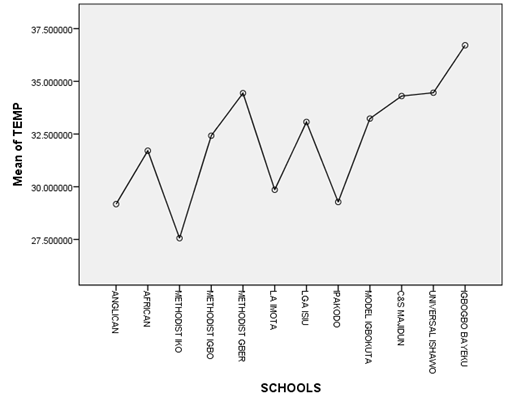
Figure V: Graph of mean temperature at the study locations
To compare the average temperature in the schools, Figure V revealed that Methodist Primary School, Ikorodu has the least mean temperature while Igbogbo Bayeku has the highest.
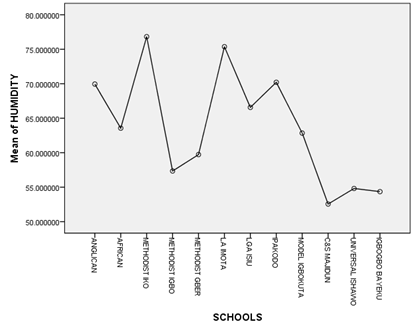
Figure VI: Graph of mean humidity at the study locations
Figure VI showed that Methodist primary school Ikorodu has the highest mean humidity while C & S primary school Majidun has the least.
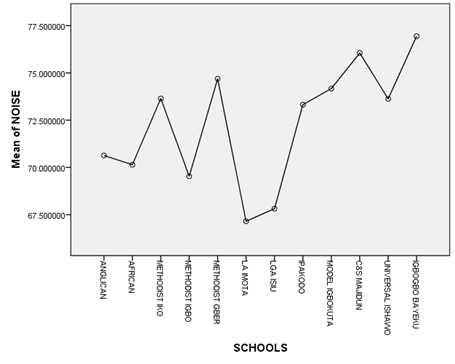
Figure VII: Graph of mean noise level at the study locations
Figure VII showed that the mean noise level hit the highest at Igbogbo-Bayeku Primary School while the least mean noise level was observed in LGA primary school Imota.
Table II: Anova showing interaction between schools and noise level
| ANOVA | |||||
| Sum of Squares | df | Mean Square | F | Sig. | |
| Between Groups | 1267.833 | 101 | 12.553 | 3.930 | .044 |
| Within Groups | 19.167 | 6 | 3.194 | ||
| Total | 1287.000 | 107 | |||

Figure VIII: Graph of temperature, humidity and noise level
In Figure VIII, there is a close relationship between humidity and noise while temperature and noise showed an in-direct relationship.
Table II: Anova showing interaction between schools and noise level
| ANOVA | |||||
| Sum of Squares | df | Mean Square | F | Sig. | |
| Between Groups | 1267.833 | 101 | 12.553 | 3.930 | .044 |
| Within Groups | 19.167 | 6 | 3.194 | ||
| Total | 1287.000 | 107 | |||
Table III: Anova showing interaction between schools and humidity level
| ANOVA | |||||
| Sum of Squares | df | Mean Square | F | Sig. | |
| Between Groups | 1255.333 | 99 | 12.680 | 3.203 | .040 |
| Within Groups | 31.667 | 8 | 3.958 | ||
| Total | 1287.000 | 107 | |||
Table IV: Anova showing interaction between schools and temperature
| ANOVA | |||||
| Sum of Squares | df | Mean Square | F | Sig. | |
| Between Groups | 1268.333 | 99 | 12.811 | 5.491 | .007 |
| Within Groups | 18.667 | 8 | 2.333 | ||
| Total | 1287.000 | 107 | |||
Table V: Correlations between temperature and humidity
| Correlations | |||
| TEMP | HUMIDITY | ||
| TEMP | Pearson Correlation | 1 | -.814** |
| Sig. (2-tailed) | .000 | ||
| N | 108 | 108 | |
| HUMIDITY | Pearson Correlation | -.814** | 1 |
| Sig. (2-tailed) | .000 | ||
| N | 108 | 108 | |
Figure VI: Correlations between temperature and humidity
| Correlations | |||
| NOISE | TIME SPACE | ||
| NOISE | Pearson Correlation | 1 | .014 |
| Sig. (2-tailed) | .885 | ||
| N | 108 | 108 | |
| TIME SPACE | Pearson Correlation | .014 | 1 |
| Sig. (2-tailed) | .885 | ||
| N | 108 | 108 | |
Table VII: Correlations between temperature and humidity
| Correlations | |||
| NOISE | HUMIDITY | ||
| NOISE | Pearson Correlation | 1 | -.193* |
| Sig. (2-tailed) | .045 | ||
| N | 108 | 108 | |
| HUMIDITY | Pearson Correlation | -.193* | 1 |
| Sig. (2-tailed) | .045 | ||
| N | 108 | 108 | |
Table VIII: Correlations between temperature and noise
| Correlations | |||
| TEMP | NOISE | ||
| TEMP | Pearson Correlation | 1 | .127 |
| Sig. (2-tailed) | .190 | ||
| N | 108 | 108 | |
| NOISE | Pearson Correlation | .127 | 1 |
| Sig. (2-tailed) | .190 | ||
| N | 108 | 108 | |
Table IX: One sample test for noise level of the schools
| One-Sample Test | ||||||
| Test Value = 0 | ||||||
| t | df | Sig. (2-tailed) | Mean Difference | 95% Confidence Interval of the Difference | ||
| Lower | Upper | |||||
| NOISE | 125.921 | 107 | .000 | 72.311252457 | 71.17284962 | 73.44965530 |
One-way Analysis of variance was used to capture and to test whether the noise level in the area is significant. The analysis showed that there is significant difference in the noise level, humidity and Temperature of the schools (Table II – IV).
The correlation analysis showed that there is a strong inverse relationship between Temperature and Humidity (-0.814) of the schools which is significant (p= 0.000). The interaction between noise and time showed that a positive correlation exists between them and it is significant at 5% level of significance. To test the correlation between noise and humidity, correlation analysis was done and it showed that there is a negative correlation (r = -0.193) which is also significant (p = 0.045). A positive relationship exists between Temperature and noise (r = 0.127) which means as the temperature increases it brings about increase in the noise level of the schools (Table V – VIII).
Also in the analysis, there is significant difference (P = 0.000) in the noise level of the schools selected in Ikorodu Local Government using one sample t- test (Table IX).
CONCLUSION
This research work has created awareness of the implications of noise in primary schools and also promotes a simple method for regular assessments of the noise level, humidity and temperature variations in these environments. The results obtained after careful assessment of noise level revealed that the average noise levels are 71.54 dB between 8 am and 9 am, 73.65 dB between 10 am and 11 am and 71.75 dB between 12 noon and 1 pm with average humidity ranging from 66.45% and 61.01% while average temperature ranges from 31.09 0C to 33.19 0C. The correlation analysis also showed that there is a strong inverse relationship between Temperature and Humidity while temperature increases with increase in noise level of the schools. These noise levels were significantly above the NASREA and World Health Organization’s recommended school noise levels of 35 dB for classrooms and 55 dB for playgrounds. The results also revealed that there is a close relationship between humidity and noise while temperature and noise showed an in-direct relationship.
RECOMMENDATIONS
The present study has indicated that there is a need to develop and enforce the laws that protect primary school pupils from noise pollution. Workshops/seminars on noise control in our schools will also assist in educating the school management towards an acceptable school environment. These will go a long way in improving the health and academic standards of the pupils.
ACKNOWLEDGMENTS
We wish to acknowledge Lagos State Science, Research and innovation Council for the grants to carry out this research work. Special thanks to the Head of Primary Schools in Ikorodu Division of Lagos State, Nigeria for their immense support.
Compliance with ethical standards
Conflict of interest: The authors declare that they have no conflict of interest.
REFERENCES
- Ana G. R., Shendell D. G., Brown G. E., Sridhar M. K. (2009). Assessment of noise and associated health impacts at selected secondary schools in Ibadan, Nigeria. Journal of environmental and public health.
- Atilade A. O., Coker J. O., Idowu A. I., Ogede R. O. (2019). Evaluation and Analysis of Traffic Noise in Lagos State Polytechnic, Ikorodu, Lagos State, Nigeria. Nigerian Journal of Physics 28(2), 180-189.
- Atilade A. O., Okedeyi A. S., Idowu I. A., Akinyemi J., Ogede R. O. and Taylor J. I. (2022). Noise Level Assessments of Students’ Activities Center in Lagos State University of Science and Technology, Ikorodu, Lagos, Southwestern Nigeria. Nigerian Journal of Physics 30(2), .
- Berglund, B., Lindvall, T., Schwela, D. H. and World Health Organization. (1999). Guidelines for Community Noise. World Health Organization Geneva. Available at: https://apps.who.int/iris
- Crandell C. C. and Smaldino J. J. (2000). Classroom acoustics for children with normal hearing and with hearing impairment. Lang Speech Hear Serv Sch. 31; 362-370.
- Farina A. (2017). The ecological effects of noise on species and communities. In: Eco acoustics. The Ecological Role of Sounds. Wiley, Oxford, pp 95–108
- Farooqi Zia Ur Rahman, Sabir Muhammad, Latif Junaid, Aslam Zubair, Ahmad Hamaad Raza, Ahmad Iftikhar, Imran Muhammad and Ilić Predrag (2020). Assessment of noise pollution and its effects on human health in industrial hub of Pakistan. Environmental Science and Pollution Research. https://doi.org/10.1007/s11356-019-07105-7. 27, 2819-2828
- Fernandes J. C. and Barreira C. S. C. (2000). Speech recognition obtained with the use of sound field FM system in hearing impaired children. In: Anais da Annual Convention and Exposition of American Academy of Audiology; Chicago, USA. Chicago: American Academy of Audiology. 144-153.
- Fidêncio, V. L. D., Moret, A. L. M., and Jacob, R. T. D. S. (2014). Measuring noise in classrooms: a systematic review. In Codas. Sociedade Brasileira de Fonoaudiologia. 26, 155-158.
- Lagos State Government (2021). About Lagos. https://lagosstate.gov.ng/aboutlagos/
- NESREA. (2009). National Environmental (Noise Standards and Control) Regulations. National Environmental Standards and Regulations Enforcement Agency (NESREA). Printed and Published by The Federal Government Printer, Lagos, Nigeria. FGP 1121102009/1,000 (0L60). Available at: http://extwprlegs1.fao.org/docs/pdf/nig146077.pdf. 17.
- Ochiabuto, O. M. T. B., Abonyi, I. C., Ofili, R. N., Obiagwu, O. S., Ede, A. O., Okeke, M. and Eze, P. M. (2021). Assessment of Noise Levels in Primary and Secondary Schools in Nnewi, Anambra State. European Journal of Environment and Public Health. https://doi.org/10.29333/ejeph/8425. 5(1), em0054, 1-4.
- Olaleye Oluremi N. and Ogunbajo Abdul Hakeem B. (2015) Microbiological risk assessment of groundwater sources in Ikorodu- a peri-urban Lagos settlement, Journal of Environmental Science and Water Resources, Wudpecker Journals, ISSN 2277 0704. 4(4), 112 – 116
- Ryherd E. E. (2016). The wide world of noise. J Acous Soci Am 139(4), 2004.