
Evaluation of Performance Characteristics of Gravel Modified with Recycled Asphalt Pavement in Comparison with Crushed Stone Aggregates in Uganda
- AHEREZA GILBERT
- 523-538
- May 13, 2024
- Engineering
Evaluation of Performance Characteristics of Gravel Modified with Recycled Asphalt Pavement in Comparison with Crushed Stone Aggregates in Uganda
AHEREZA GILBERT
School of Engineering and Applied Sciences, Kampala international University, Uganda
DOI: https://doi.org/10.51244/IJRSI.2024.1104038
Received: 27 March 2024; Accepted: 10 April 2024; Published: 13 May 2024
ABSTRACT
This study examined the performance characteristics of gravel material when incorporating RAP material and CS aggregates. Gravel samples were sourced from the Kabuuma borrow pit in Munyonyo, RAP aggregates from Bwaise, Kawempe road, and CS aggregates from Sterling Quarry in Mbalala Mukono.
Initial characterization involved Proctor tests, Atterberg limits analysis, particle size distribution assessments, and CBR tests for gravel. RAP aggregates underwent sieve analysis, while CS aggregates were subjected to ACV, FI, and sieve analysis. Various combinations of RAP and CS aggregates were added to gravel in percentages ranging from 25% to 45%, and subsequent tests including particle size distribution, Atterberg limits, Proctor tests, and California Bearing Ratio were conducted.
Results indicated an increase in MDD values with the addition of RAP and CS aggregates, coupled with a decrease in OMC values. Strength also showed improvement across all percentage additions. Notably, at 45% RAP added to gravel, the CBR value was 36%, compared to 52% when 45% CS was added, indicating CS aggregates were more effective in enhancing gravel strength. Atterberg limits decreased with higher percentage additions; for instance, at 40% CS added, PI value reduced to 15.4% compared to 24.2% with 40% RAP added.
Material properties as per the General Specifications for Roads and Bridge works Ministry of Works and Transport (2010) were attained at certain percentage additions: G30 was achieved at 40% CS to gravel, and G45 at 45% CS to gravel. However, 35%, 40%, and 45% RAP met strength requirements for sub-base material, although Atterberg limits fell short of the specified values.
Key words: Performance evaluation, recycled asphalt pavement, and gravel
INTRODUCTION
Roads are important in serving two primary functions which include accessibility and mobility (Amanamba & Engineering, 2016) but over the last decades, some gravel roads in Uganda have not been able to even fulfill the function of accessibility due to being in poor state (Mugisha, 2020; Ranganathan & Foster, 2012). This has been associated with problems like bumps and undulations, dustiness and slipperiness which is threating businesses (Kikwasi & Mbuya, 2019) in eastern districts, making it almost impossible to transport their produce to markets during rainy seasons. The roads become impassable as a result of such problems.
Improvement of such roads having weak or high compressible or high swelling or any other such problematic soils is commonly done by removing the problematic soils and replacing them with more competent ones such as gravel, crushed rock, (Sun et al., 2018) or lightweight aggregates to increase the load bearing capacity (Latifi et al., 2016). Although this is considered a good solution, usually has the draw-back of high cost due to the cost of the replacement materials.
Over the years, both mechanical and chemical stabilization have been done in relation to solving the effect of problematic soils. Stabilization using lime and cement has often been done but however these methods have increasingly been costly (Makusa, 2012). The selection of appropriate quality of materials for sub-grade, sub-base and road-base determines the capital and whole life costs the road. Recycled asphalt pavement (RAP) being non plastic and coarser would largely improve on the performance of the gravel material but however its binding properties, temperature during placement and compaction of the mix have to be put into consideration (Murthi et al., 2020). However further studies indicate that RAP aggregates could replace the use of virgin aggregates in road bases if RAP is mixed with virgin aggregates (Murthi et al., 2020; Pradhan & Biswal, 2022; Zhang et al., 2022).
It is on this background that one would anticipate the need to use the recycled asphalt pavement material in Uganda so as to compare the costs that can be incurred and the need to conserve the environment with the use of Crushed stone (CS) material for modification of gravel material. This study will therefore focus on the validity of the use of recycled asphalt pavement in modifying gravel in comparison with CS produced from rocks.
Gravel is being used on road projects in sub-grade, sub-base and base applications however at times; it does not meet the specific requirements and worse still if it meets, the sources are continuing to be depleted (Kosgey et al., 2023). Therefore, there is need to improve the requirements of gravel material to meet the specifications. The virgin aggregates (CS) are used on most projects and can be available when needed to modify the properties of gravel material but are costly in terms of extraction, crushing as well as transportation to the site. On the other hand, there is increased milling of asphalt pavement material that is a result of maintenance and rehabilitation activities of previously paved roads. RAP is not only desirable as a construction material but also its re-use is environmentally friendly.
According to Ugandan roads, more than 70% are in a poor state (Nankya, 2011; Uganda Road Fund, 2021) and the need for their improvement to asphalt concrete Standard is on the rise, therefore while exhaustion of good soils occurs, mechanical modification of remaining soils with recycled asphalt pavement material or CS has to be done for stronger sub-bases and bases if requirements are to be achieved.
Borrowing material during road construction has been the practice in most areas perhaps because of limited knowledge about modification techniques and the costs involved to improve the existing materials have proved to be expensive. Therefore, this study was carried out to evaluate the performance characteristics of gravel modified with recycled asphalt pavement (RAP) materials in comparison with crushed stone (CS) aggregates.
METHODOLOGY
Therefore, the main investigation made on the soils and materials includes the following in detail:
- Test Pit logging and sampling
- Laboratory soils and materials investigations for example Classification tests; Sieve analysis, Atterberg Limits, Proctor Test, California Bearing Ratio, aggregate Crushing Value and flakiness index
Materials
Materials from identified sources were sampled and analyzed which included the following.
- Gravel material. This material was sourced in Munyonyo-Kabuuma Borrow Pit and was taken to the laboratory to determine its physical properties in its natural state.
- Crushed stone (CS). These aggregates were obtained from sterling quarry in Mbalala-Mukono.
- Recycled pavement materials (RAP). This material was obtained along Bwaise-Kawempe road at the section Km 01+200 FW where milling of the existing asphalt concrete surface had reached.
Sampling
Munyonyo-Kabuuma Borrow Pit was considered as a priority for the gravel material. Soil samples encountered were brought to the soil mechanics laboratory and tested for natural moisture content, compaction, grading, Atterberg limits, and California Bearing Ratio (CBR). CS aggregates were also obtained on the basis of their use on different road projects.
Gravel sampling
Borrow Pits were excavated to a maximum depth of 2.0m. Each Pit was profiled and sampled as necessary. Samples were of each horizon particularly the Reddish Brownish gravel encountered taken to the laboratory and tested for natural moisture content, compaction, grading, atterberg limits, and their California Bearing Ratio values. The sample was tested in accordance with the standard procedures listed in Table 3.1in chapter three.
A summary of the soil profiles encountered in the borrow pit area, their predominant soil descriptions and approximate layer thicknesses is shown in table 3.1 below.
Table 3.1: Showing extent of gravel material acquired from the borrow pit
| Borrow Pit Area | Soil Description | Layer Thickness |
| Muyonyo-Kabuma Borrow Pit | Overburden | 200mm |
| Reddish Brownish Gravel | 1500mm |
Sampling of the gravel were obtained by taking block samples specially cut by hoe from a trial pit in the existing borrow pit area. Laboratory testing of samples were carried out as soon as possible after sampling. Any necessary storage and handling were such that the quality of the sample is not reduced or changed by the time they reach the laboratory. The samples were kept in the laboratory during the period of testing.
Loss of moisture from gravel samples were prevented by use of polythene bags for storage. The tools used for the sampling of gravel included hoes, spades and sacks.
Crushed stone aggregates sampling
On the stockpile, different parts were considered from which a well-proportioned sample was obtained in order to fit within the grading envelope required for CS aggregates. Improper sampling gives aggregates that are non-representative, and tests made on them are meaningless. In the laboratory, the samples brought were reduced to representative sample by quartering method according to BS 812: Part 101:1984.
Recycled asphalt pavement material sampling
The recycled asphalt pavement (RAP) material was sampled from Bwaise-Kawempe roadway as shown in (appendix E). RAP was obtained from a milled surface and carried to the laboratory for testing and on further mixing with gravel material.
Soil sample preparation
After collection of the sample from the field and transporting them to the laboratory, sample for Natural moisture content was obtained and taken to the oven. Air dying of the rest of sample was done and representative portions of the sample were obtained either by quartering and/or using a riffle box. Various tests were then carried out. At the laboratory, all the materials were air dried. After obtaining samples for particle size distribution, the materials were then sieved through 20mm sieve to remove very large particle before the tests were done on them.
CS aggregates and RAP sample preparations
After collection of the sample of CS aggregates and transportation to the laboratory, air drying was carried out and later kept in sacks. These were again air dried, quartered and riffled to pick representative samples for carrying out tests on.
RAP was hand crushed using a claw hammer and reduced to smaller sizes. Enough sample was crushed from which the representative samples were obtained for testing and on mixing with gravel material.
To obtain a consistent sample for use into our research, the sample was sieved in the following sieves arrangement. The following mix proportions were considered after hand crushing and sieving.
Table 3.2: Showing the percentages retained considered for RAP characterization
| Sieves, mm (retained-passing) | Percentage considered |
| 20-28 | 13% |
| 14-20 | 12% |
| 10-14 | 19% |
| 5-10 | 11% |
| 0-5 | 45% |
Samples from the considered sieves were mixed together using the spade and these were later quartered and riffled to achieve a well-proportioned mix for use.
Gravel-CS and Gravel-RAP samples preparation
As shown in tables 3.2 and 3.3, the percentages of all blends were prepared by mass of the composition. The percentages of RAP or CS aggregates were added to the corresponding percentage of gravel material and well mixed using the spade. The combined sample was then quartered and riffled to allow proper mixing from which samples for testing were obtained.
Laboratory Investigation of Materials
The laboratory testing was based on soil samples excavated from Borrow pit, RAP from milled road surface and crushed stone aggregates from the stockpile. Table 3.3 below summarizes the laboratory tests undertaken and the standards adopted for each test.
Table 3.3: Laboratory Test and Standard Test Designations Requirements
| Test Description | Standard Test Designation | Material |
| Moisture content | BS 1377: Part 2: 1990 | Gravel, Blended mix of gravel and CS, Blended mix of gravel and RAP |
| 5-point compaction
(modified proctor) |
BS 1377: Part 4: 1990 | |
| Particle size distribution
(wet sieving) |
BS 1377: Part 2: 1990 | |
| Plastic Limit and Plasticity Index | BS 1377: Part 2: 1990 | |
| Liquid Limit | BS 1377: Part 2: 1990 | |
| Linear Shrinkage | BS 1377: Part 2: 1990 | |
| 3-point CBR (4 days soaking) | BS 1377: Part 4: 1990 | |
| Sieve Tests on Aggregates (Grading) | BS812: Part 103.1:1985 | RAP and Crushed stone aggregates |
| Flakiness Index (FI) | BS812: Section 105.1:1989 | Crushed stone aggregates |
| Aggregate Crushing Value, ACV | BS812: Part 110:1990 |
Experimental matrix
Parameters that include Particle size distribution, Atterberg limits, Compaction, swell, and California bearing ratio tests were conducted on the following blends:
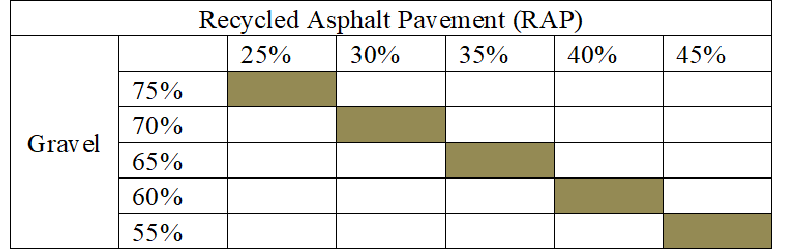
- RAP/Gravel blends: 0/100, 25/70, 30/60,35/50, 40/40, 45/30 percent
- CS/ Gravel blends: 0/100, 25/75, 30/70, 35/65, 40/60,45/55 percent
Different mix ratios in terms of percentages by mass were tried out to get the appropriate mix required for the mechanically modified gravel as shown in the table 3.4 and table 3.5.
Table 3.4: Shows experimental matrix table for gravel and CS blend
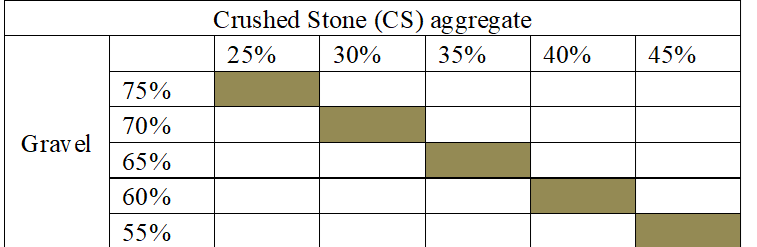
Table 3.5: Shows experimental matrix for gravel and RAP blend
Data Analysis
Data gathered from the laboratory, field tests and other sources were integrated, analyzed and relevant conclusions drawn using excel program as shown in appendices A, B, C, and D.
General specifications for road and bridge works (MoWT, 2010) were used however based on the results obtained to come up with the requirements each given percentage of RAP or CS aggregates fulfilled from which we would clarify what material requirements each had met.
RESULTS AND DISCUSSION
Physical Properties of the Materials Used
The initial properties of the materials to be used in the study were first determined by carrying out different tests for example, particle size distribution, proctor test, CBR-4days soaking, atterberg limits, Mechanical Strength Tests. The principles guiding use of materials for permanent construction works are based on the requirement of laboratory tests confirming the compliance of the materials with specifications for each specific parameter in question.
In accordance with the requirements for upper subgrade layers, General Specifications for Road and Bridge Works considers construction material of material class of G15 – natural soils with CBR of 15 without any chemical stabilization. The table 4.1 below illustrates the Specification Requirements.
Table 4.1: Material Requirements for upper, lower subgrade and fill (source: General specifications for roads and bridge works, MOWT 2010)
| Material Properties | Material class | ||
| G15 | G7 | G3 | |
| CBR (%) BS 1377: Part 4 | Minimum 15 after 4 days soaking 1) | 7 after 4 days soaking1) | 3 after 4 days soaking measured at 90% of MDD of BS-Heavy compaction |
| CBR-swell (%) BS 1377: Part 4 | Maximum 1.5 | Maximum 2 | Maximum 2 |
| Plasticity index (%) BS 1377: part2 | Maximum 25 | Maximum 30 | No requirement |
| Max. particle size BS1377: Part 2 | 1/2 of completed layer thickness but not >50mm. | ||
| Maximum layer thickness | 250mm compacted thickness placed in one operation | ||
| 1. CBR values measured at the specified field density for the respective layer. | |||
Gravel
The initial tests on the gravel were carried out in accordance with the standard procedures listed in table 3.3.
The table 4.2 below presents a summary of the laboratory results performed on Gravel material. The laboratory test results are detailed in appendix A.
Table 4.2: Summary of Laboratory Results on Gravel sample
| Borrow pit area | Grading modulus | Liquid Limit (%) | Plastic Index (%) | Linear Shrinkage Limit (%) | Maximum Dry Density (Kg/m3) | Optimum Moisture Content (%) | CBR (%) |
| Munyonyo -kabuuma | 2.69 | 60.1 | 34.1 | 15 | 1.86 | 15.0 | 15.5 |
Particle size distribution of gravel material
This experiment was done to determine the particle size distribution of the soil samples taken from Munyonyo in kabuuma borrow pit. The samples were washed through a sieve of 0.075mm. The analysis presents the relative portion of different particles from which we can classify the soil according to the four types of engineering gravel, sand, clay and silt.
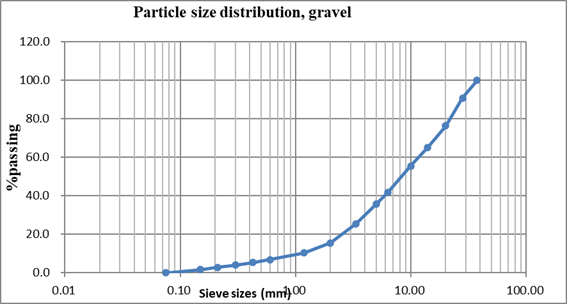
Figure 4.1: Particle size distribution of gravel material
The grading modulus for the gravel sample obtained was 2.69 as calculated from.
Gm=![]()
From Table 4.1 above, and with reference to Requirements of Material Class G15 in the specifications for subgrade material in the MoWT General specifications, this material does not meet the required standards in terms of Plasticity Index (PI).
Mechanical Strength Tests
The dry sieving of the crushed stone aggregates and RAP was done, and results presented as shown in figure 4.2 and figure 4.3 below respectively. The gradation of Crushed stone aggregates was within the grading envelope as required standards as per the MoWT general specifications. The grading curve for RAP came out as already mixed on classifying it.
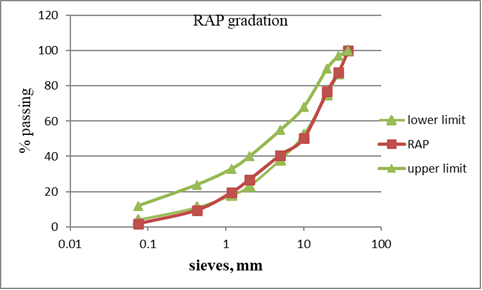
Figure 4.2: RAP gradation
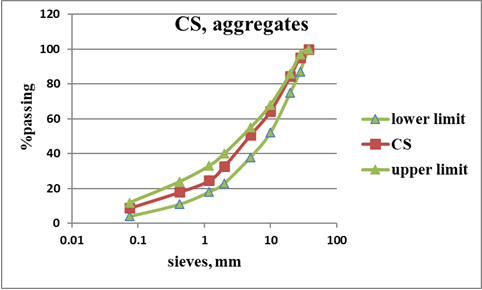
Figure 4.3: CS aggregates gradation
Flakiness Index
This value was obtained by separating the flaky particles from the sample and expressing their percentage of the mass of the sample.
Table 4.3: Typical values obtained for flakiness index test
| Sieves (mm) | Weight retained (g) | Percentage retained | weight passing (g) |
| 28 | 127.4 | 5.4 | 19.3 |
| 20 | 287.9 | 12.2 | 29.7 |
| 14 | 249.7 | 10.6 | 35.8 |
| 10 | 213.0 | 9.0 | 66.3 |
| TOTAL | 878.0 | 151.1 |
The total mass of the sample was 2358.0g
Flakiness index value = (151.1/878.0) X 100 =17.2%
Aggregate Crushing Value test
This test was done to determine the relative measure of resistance of aggregates to crushing under an applied load. A summary of the ACV test results on the Crushed Stone aggregate sample from the Mbalala Mukono Quarry is shown in table 4.4 below
ACV was calculated using the equation shown below.
Table 4.4: ACV Test Results on Crushed Stone aggregate Material
| Test No. | Mass retained(g) | Mass passing (g) | ACV, % | Average, % | MOWT specification |
| 1 | 2168.6 | 501.4 | 18.8 | 19.0 | 25 max |
| 2 | 2235.0 | 531.6 | 19.2 |
The value of 19.0% was in accordance with requirement for use by general specifications by ministry of works and transport.
Gravel-Crushed Stone and Gravel-Rap Modifications
Particle size distribution of gravel material mixed with CS and RAP blends
The tests were done using different percentages (25%, 30%, 35%, 40% and 45%) of CS and RAP added to the obtained gravel samples and the corresponding characteristics as shown in appendices.
The grading moduli obtained from gravel-CS were as follows, 2.693, 2.722, 2.734, 2.79, and 2.793 for the above corresponding percentages of CS added. The grading curves obtained are represented in the figure below.
There was increase in the grading modulus as shown in figure 4.3 and this was attributed to the percentage of aggregates added, hence increasing the coarse particles.
The finer particles of aggregates mixed with the gravel material were washed away relating to the less percentage passing of the sample through 2mm, 0.425mm and 0.075mm sieves
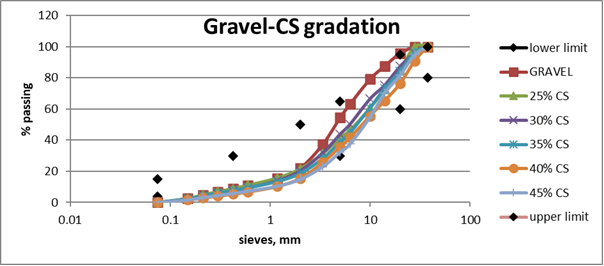
Figure 4.4: Particle size distribution of CS-Gravel blends
The grading moduli of gravel-RAP blends were also on an increasing trend as follows; 2.758, 2.772, 2.791, 2.794, and 2.827 for 25%, 30%, 35%, 40%, and 45% of RAP added to gravel respectively.
The increase in the trend of grading moduli shows how samples became coarser as more RAP was added and the decrease of percentage of fines lost reflected.
The grading moduli of Gravel-RAP blends are more than those of Gravel-CS blends because aggregates had more fines than RAP and there grading characteristics were not the same.
Atterberg limits
In this study the results of atterberg limits were obtained according to BS1377:Part2:1990. These tests were done on the gravel material and the mixture of gravel-CS and gravel-RAP in proportions of 25%, 30%, 35%, 40%, and 45% respectively.
The gravel material had a liquid limit LL of 60.1%, plastic limit PL of 26.0%, plasticity index PI of 34.1% and a linear shrinkage of 15.0% as presented in table 4.5 below. The laboratory test results are detailed in appendix 4-A-2.
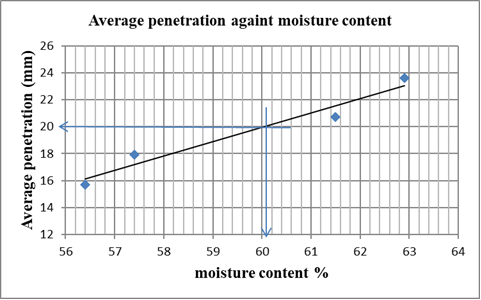
Figure 4.5: Variation of penetration with moisture content of gravel material
Table 4.5: Typical values obtained on gravel initially and of CS-Gravel and RAP-Gravel in different proportions.
| percentage of RAP and CS added | ||||||
| Atterberg limits | Gravel | 25% | 30% | 35% | 40% | 45% |
| LL, % CS | 60.1 | 48.2 | 42.7 | 38.4 | 37.8 | 35.4 |
| PI, % CS | 34.1 | 24.3 | 20.1 | 16.7 | 15.4 | 13.3 |
| LS, % CS | 15.0 | 9.5 | 8.8 | 7.7 | 6.8 | 6.3 |
| LL, % RAP | 60.1 | 56.2 | 55.2 | 54.2 | 50.2 | 47.8 |
| PI, % RAP | 34.1 | 31.0 | 26.2 | 26.0 | 24.2 | 22.7 |
| LS, % RAP | 15.0 | 14.5 | 13.1 | 12.2 | 10.8 | 9.25 |
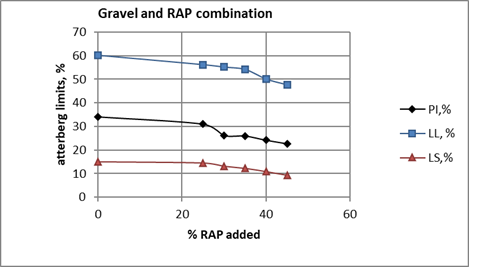
Figure 4.6: Variations of LL, PI, and LS with increasing percentages of RAP
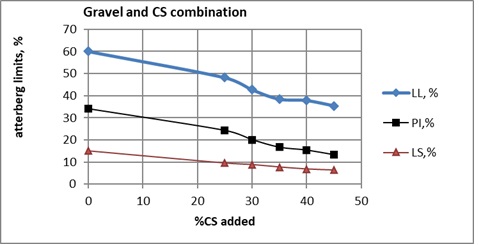
Figure 4.7: Variations of LL, PI, and LS with increasing percentages of CS
From the figure 4.6 and figure 4.7, it is observed that the values of liquid limit reduced with addition of more CS and RAP samples. The decrease in values of LL indicated that there was a decrease in moisture content at a penetration of 20mm. However, the finer particles present in the CS aggregates helped in reducing the values of LL as opposed to the RAP material that never had a high significant change.
With addition of CS and RAP material, the reduction of the liquid limit was due to replacement with a non-plastic material. The drying effects of CS aggregates reduced the liquid limit and more addition, reduced the water holding capacity.
PI values also reduced correspondingly, and this was attributed to the aggregates being non plastic and having a low water retention capacity. When the aggregates were added to the material, they reduced the plasticity of the sample for example at 45%CS, the PI reduced from 60.1% to 13.3% which satisfies the material to be used as a G60 material as long it satisfied other requirements.
Since the particles passing through 0.425mm sieve were considered under the test, more sample from CS aggregates was used as compared to RAP material that had less particles of that size. Therefore, the PI values obtained were much higher than those of gravel-CS samples and thus CS material was effective in reducing the plasticity of the gravel greatly.
The linear shrinkage of samples also greatly reduced with increase of RAP and CS materials. The LS values are closely related to the PI values and a soil with LS<6% is said to be non-plastic. The lowest value of LS obtained was 6.3% at 45%CS and this fulfilled the requirement of a G60 material per the General specifications for roads and bridge works by ministry of works and transport where a maximum of 8% is considered.
Also, a PI value of 15.4%, LL of 37.8% and LS of 6.8% fulfilled the requirement of a G45 material and these were obtained at 40% CS addition to the gravel material.
There was a significant change observed with addition of the stabilizer from 8.8% to 7.7% at 35% CS added and from 12.2% to 10.8% at 40% added.
Maximum Dry Density- Optimum Moisture Content relationship
Various blends were prepared using 25%, 30%, 35%, 40%, 45%RAP with gravel in comparison with 25%, 30%, 35%, 40%, 45%CS and gravel.
The compaction test was performed by the modified proctor testing procedure (BS 1377: Part 4: 1990). The hammer weight was 4.5kg and it had a free fall of 450mm. The RAP, CS and gravel were air dried to remove the moisture for a minimum of 2 days. Particle sizes greater than 20mm were removed. The proctor test was done to establish the maximum dry densities (MDD’s) and optimum moisture contents (OMC’s) of gravel and its blends. Figures 4.7 and 4.8 indicate the relationship between maximum dry density –percentage of RAP, CS and optimum moisture content-percentage of RAP, CS respectively. A summary of the maximum dry density and optimum moisture content plus their percentages are presented in table 4.6 below
Table 4.6: Summary of MDD and OMC values obtained for different combinations
| Percent of RAP and CS added | gravel | 25% | 30% | 35% | 40% | 45% |
| MDD-CS (kg/m3) | 1.860 | 1.988 | 2.038 | 2.092 | 2.125 | 2.210 |
| OMC-CS (%) | 15.5 | 10.4 | 9.6 | 9.0 | 8.6 | 7.9 |
| MDD-RAP (kg/m3) | 1.860 | 1.935 | 1.975 | 2.050 | 2.070 | 2.110 |
| OMC-RAP (%) | 15.5 | 10.4 | 10.0 | 8.6 | 8.0 | 6.8 |
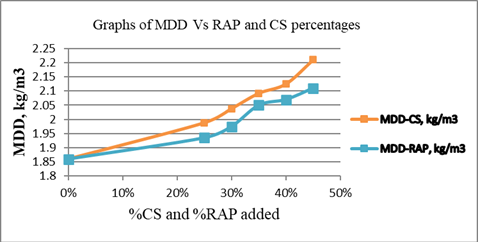
Figure 4.8: Variation of MDD with percentages of RAP-Gravel and CS-Gravel mixtures
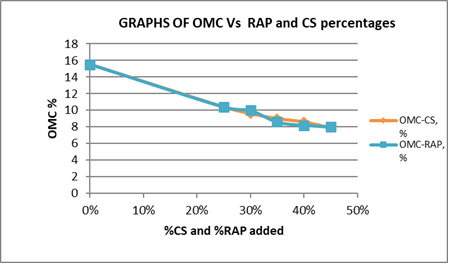
Figure 4.9: Variation of OMC with percentages of RAP-Gravel and CS-Gravel mixtures
The data indicate that, as percentage of RAP aggregates were increased in gravel mix, there was a slight increase in MDD values. Similarly, there was also an increase in the MDD values, as the percentage of Crushed Stones increased in the gravel mix. The OMC values were decreasing as can be seen in figure (b) as percentages of aggregates and RAP were added increasingly.
The increase in the values of MDD can be justified by the increase in the particles being added. The increase in particle density has a significant increase on the values of density in compaction and the aggregates had higher specific gravity than that of the gravel material.
Secondly, there was reduction of void space as more particles were added during compaction and more densification of the particles led to increase in MDD values. The changes in densities for RAP and CS additions were attributed to the strength of virgin aggregates being higher than the RAP material aggregates that had formally been compacted on the road, hence reducing their strengths.
Similarly, reduction in the OMC values of CS-Gravel blends was attributed due low water absorption of the aggregates. During compaction of RAP-Gravel blends, the larger RAP aggregates sizes were broken up. Also, the higher RAP content samples that were compacted at lower moisture content would not remain intact upon removal from the mold hence reduction in the optimum moisture content.
Therefore, as more samples of CS and RAP were added to the gravel material, there was an increase on the MDD of the sample due to improved compact ability and a corresponding decrease in the values of OMC. Increase in the values of MDD was an indicator of improvement.
Strength characteristics
The California Bearing ratio tests were conducted according to BS 1377: Part 4: 1990. The material was compacted in the CBR mold in five layers at optimum moisture content, and the molds were soaked for 4 days to determine the 3-point soaked CBR value. This was carried out to characterize the strength and the bearing capacity of the gravel, gravel-CS blends and the gravel-RAP blends.
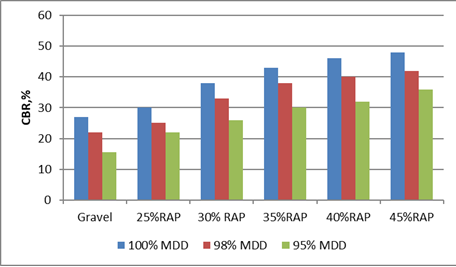
Figure 4.10: CBR values for Gravel-RAP blends
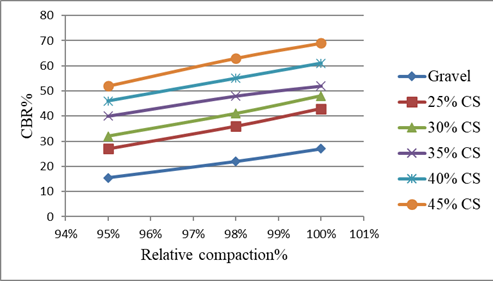
Figure 4.11: Variation of CBR with relative compaction for CS-Gravel mixture at different percentages
The CBR values at 95%, 98% and 100% MDD were determined as obtained for the suggested combinations of both RAP and CS. The typical value at 100% MDD for gravel was 27% and this this showed an increase in value to 43%, 48%, 52%, 61%, and 69% with an increasing percentage of Crushed Stone aggregates. Figure 4.11 shows how CBR caries with compaction with an increasing percentage of Crushed Stone.
There was a general increase in the trend of CBR values for increasing percentages of aggregates and RAP. The increase in CBR was attributed due to the increase in the particle densities which is likely to affect the penetration of the plunger.
Generally, CS aggregates performed better than the RAP aggregates in improving the CBR values of the gravel material.
CONCLUSIONS
It appears that RAP aggregates may be substituted for Crushed stone aggregates in improving the engineering properties of gravel material however it did not meet all the requirements presented in the MoWT general specification for Roads and Bridge Works (2010).
Gravel had a CBR value of 15.5% at 95% MDD which can be considered for upper subgrade in accordance with General Specifications for Roads and Bridge works for Ministry of Works and Transport. However, it did not satisfy requirements for PI (maximum 25%).
The gravel material was found to have a high plasticity index of 34.1% but with addition of CS aggregates, this showed a sharp decrease in value as low as 13.3% at 45% CS with increasing percentages of Crushed stone aggregates as compared to RAP aggregates that showed a slight decrease in plasticity index of 22.7% at 45%RAP addition to gravel.
The combinations of CS-Gravel demonstrated a better performance than RAP-Gravel in improving the plasticity of the gravel material.
Generally, atterberg limits decreased with addition of RAP and CS aggregates to values recommended for upper subgrades and sub-bases that is PI<25% and PI<16% respectively
Test results showed an increase in MDD values with increasing percentages of CS aggregates to gravel as well as RAP to gravel. This was attributed due to high particle densities and low water absorption. Similarly, there was a general decrease of OMC values due to low affinity of water by Crushed Stone aggregates as well as RAP aggregates.
The gravel-RAP blends met all requirements for use as upper subgrade (G15). Typical blends 35%, 40% and 45% RAP met CBR requirements for a sub-base material that is 30%, 32% and 36% respectively were achieved however they did not meet Atterberg limits requirements. This was attributed due to the grading mix considered in this project (the sample had less fines in the mix).
Gravel-CS blends performed better in improving the engineering properties of gravel. 25%CS improved the gravel to a good upper subgrade material while 30%CS, 35%CS and 40%CS met requirements for G30 material though PI values did not satisfy required ones (PI= 20.1% and16.7% for 30%CS and 35%CS respectively).
Typically, 40%CS added to gravel satisfied recommendations for a G30 material and 45%CS addition to gravel met requirements for a G45 material with (LL=35.4%, PI=13.3%, LS=6.3%, GM=2.793, min CBR=52% and swell=0.05%).
RECOMMENDATIONS
35%, 40% and 45% of CS aggregates and RAP addition to gravel can be adopted in case there is need to improve on the properties of gravel especially for use as a sub-base material on the roads.
Both RAP and CS aggregates can be used in improving the properties of the gravel material; however, the CS will demonstrate a better performance especially in improving the CBR strength of the soil.
From our research, RAP needs proper classification in terms of its grading to include more fine material that can reduce on the values of atterberg limits for any soil sample. Therefore, there is need for crushing of the samples of RAP after their acquisition from the road sections.
Further research into use of RAP from AC20 asphalt mix used prior should be done since the particle size will have increased. We recommend extraction to be done so that the aggregates can be obtained and used without the bitumen.
Key properties such as mineralogical composition, surface texture, porosity and others for CS aggregates should be investigated to establish their effect on performance of gravel-CS blends.
REFERENCES
- Amanamba, E. C. J. I. J. o. U., & Engineering, C. (2016). Performance Evaluation of a ‘Priority-Controlled’Intersection Converted to Signal-Controlled Intersection. 10(7), 969-978.
- Kikwasi, G., & Mbuya, E. (2019). Vulnerability analysis of building structures to floods: The case of flooding informal settlements in Dar es salaam, Tanzania. International Journal of Building Pathology and Adaptation, 37(5), 629-656.
- Kosgey, W. K., Osano, S. N., & Mwea, S. K. J. E. A. J. o. E. (2023). Characteristics of cinder gravel as road pavement construction material in Meru County, Kenya. 6(1), 16-35.
- Latifi, N., Meehan, C., Abd Majid, M. Z., Tahir, M., & Mohamad, E. (2016). Improvement of Problematic Soils with Biopolymer—An Environmentally Friendly Soil Stabilizer. Journal of Materials in Civil Engineering, 29. doi: 10.1061/(ASCE)MT.1943-5533.0001706
- Makusa, G. P. (2012). Soil stabilization methods and materials. Lulea University of Technology.
- Ministry of Works (2010), Central Materials Laboratory, Laboratory Testing Manual
- Ministry of Works and Transport (2010), General Specifications for Roads and Bridge works
- Mugisha, G. (2020). RURAL ROADS AND HOUSEHOLD WEALTH: THE CASE OF UGANDA.
- Murthi, P., Almas, K., Poongodi, K., Gobinath, R. J. I. J. o. R. T., & Engineering. (2020). Properties of pavement quality concrete prepared with recycled coarse aggregate. 8(5), 3186-3192.
- Nankya, P. L. (2011). Assessment of the Road Safeness and Prevalence of Road Traffic Accidents in Uganda (Doctoral dissertation, International Health Sciences University).
- Pradhan, S. K., & Biswal, G. J. M. T. P. (2022). Utilization of reclaimed asphalt pavement (RAP) as granular sub-base material in road construction. 60, 288-293.
- Ranganathan, R., & Foster, V. J. W. B. P. R. W. P. (2012). Uganda’s infrastructure: a continental perspective. (5963).
- Sun, S., Liu, B., & Wang, T. (2018). Improvement of expansive soil properties using sawdust. The Journal of Solid Waste Technology and Management, 44(1), 78-85.
- Uganda Road Fund. (2021). Road user satisfaction; survey report.
- Zhang, J., Sesay, T., You, Q., & Jing, H. J. P. (2022). Maximizing the application of RAP in asphalt concrete pavements and its long-term performance: A review. 14(21), 4736.