
Evaluation of Textile Wastewater Treatment via ETP in Bangladesh
- Mohammad Biplab Mia
- Md Shahad Hasan
- Md Rasel Ahammed
- Md Jahangir Alam
- Mithun Biswas
- Md Mahedi Hasan Moon
- 356-368
- Jun 3, 2024
- Environmental Assessment
Evaluation of Textile Wastewater Treatment via ETP in Bangladesh
Md Shahad Hasan1, Mohammad Biplab Mia2*, Md Rasel Ahammed3, Md Jahangir Alam2, Mithun Biswas2, Md Mahedi Hasan Moon 1
1School of Civil Engineering, Beijing Jiaotong University, Beijing, China.
2School of Civil and Transportation Engineering, Hohai University, Nanjing, China.
3Department of Geotechnical Engineering, China Institute of Water Resources and Hydropower Research (IWHR), Beijing, China.
DOI: https://doi.org/10.51244/IJRSI.2024.1105022
Received: 15 April 2024; Accepted: 17 April 2024; Published: 03 June 2024
ABSTRACT
Textile liquid waste possesses a substantial biochemical oxygen demand and total suspended solids, hence posing a significant risk of contaminating adjacent water bodies if not appropriately managed. The primary aim of the study is to examine the pH condition of water from the inlet and outlet of the ETP (Effluent Treatment Plant) in two specific regions. Two natural groups in Bangladesh include Tonga Bari, Ashulia, Savar, and Dhaka. Another natural group is “The Emakulet Textile Ltd,” located in Purboponchash, Dhamrai, Dhaka.
Raw liquid waste was collected from two textile industry and applied some test procedure in the laboratory by varying different design parameters such as pH, DO (Dissolved Oxygen), BOD5 (Biochemical Oxygen Demand), COD (Chemical Oxygen Demand), TDS (Total Dissolved Solids), TSS (Total Suspended Solids), Turbidity, Fe2+, pH was tested by a pH meter at 25℃ temperature. DO also tested by a sensor machine (FLEXA) which shows the values of dissolved oxygen in ETP waste water. To collect BOD5 value needed 5 days minimum also used MnSO4, H2SO4 to get BOD5 value from the incubator. Turbidity was tested by Digital Turbidity meter.
The results showeds that the pH condition of water from the inlet is satisfied but others parameter from the inlet sample is not in the range of ECR, 1997. The selected two areas of ETP given the maximum and minimum parameters found, DO in the inlet of two selected areas was (0) from the inlet. The maximum BOD5 value was 126 mg/l from the inlet which crosses the limit of ECR-1997 but after treatment it was 47 mg/l. The detailed experimental results demonstrated that, ETP water is fully treated and all parameter acceptable according to ECR, 1997. In this analysis, it is anticipated that the implementation of a cost-effective treatment approach could serve as an incentive for industrial proprietors to engage in effluent treatment, so contributing to the enhancement of water body quality in Bangladesh.
Key Words: Water treatment methods, Effluent Treatment Plant, Chemical Oxygen Demand (COD), Biochemical oxygen demand (BOD), Textile liquid waste, Environmental Conservation.
INTRODUCTION
The implementation of a well-designed wastewater treatment plant is important in order to mitigate the pollution issue in Bangladesh. The absence of sufficient data regarding the treatment efficiency of various treatment choices poses a challenge for designers in their decision-making process when selecting suitable treatment units. Textile liquid waste possesses a substantial biochemical oxygen demand and total suspended solids, hence posing a significant risk of contaminating adjacent water bodies if not appropriately managed. The industry’s image is characterised by the presence of high colour and turbidity in the wastewater that is released [1].
Bangladesh is mostly reliant on agriculture, with the industrial sector assuming a crucial part in the country’s overall development. A significant portion of the expansion was focused on industries that export goods, including ready-made clothes and hosiery. The textile industry had a mere 24 employees in 1983. The industrial sector experienced a significant growth rate of 75 in 1994 [30], which in turn gave rise to several connected challenges. Water pollution is a significant issue. The pollution situation is becoming increasingly severe due to the inefficiency or absence of wastewater treatment, inadequate monitoring, and a lack of information regarding the operation of treatment plants. A variety of treatment strategies have been observed for the management of textile wastewater. Here, we will provide one of the straightforward methods for treating liquid effluent in the textile industry.
Nevertheless, the majority of these treatment alternatives are costly, leading to a hesitancy among industry owners to implement them. The development of a cost-effective treatment approach is anticipated to incentivize industrial owners to treat the effluent from their operations, so contributing to the enhancement of water body quality in Bangladesh [1].
According to the Bangladesh Government, industries have been classified into four distinct categories, namely green, orange-A, orange-B, and red. Industries that generate waste with the potential to cause significant environmental pollution are classified inside the red category. Industries falling into the red category are required to establish an effluent treatment plant (ETP) prior to commencing their industrial activities. Textile dyeing industries are classified as red, hence they necessitate the use of ETPs [2].
Textile industry in close proximity to water bodies are currently causing significant water pollution. The majority of textile industries lack any ETP. The majority of sectors that have ETPs conduct their ETPs on an intermittent basis. Once more, the majority of those ETPs are inadequately built. The enforcement of environmental conservation regulations in Bangladesh is inadequate. Hence, due to the awareness of both the companies and the ETP designers that the ETP will serve as a decorative feature rather than a means of treating the effluent, they do not prioritize the efficiency of the ETPs [2].
Various treatment technologies are currently employed in numerous countries for the purpose of treating wastewater generated by textile mills. Currently, the use of ETPs in Bangladesh is limited to two primary categories due to the high cost associated with alternative technologies. The two methods under consideration are physicochemical treatment and subsequent biological therapy [3]. There is a lack of empirical evidence regarding the efficiency of these ETPs due to various factors. There are several factors contributing to the lack of interest in enhancing the efficiency of the ETP. One such factor is the recognition that it is frequently feasible to evade proper wastewater treatment. The majority of ETPs are developed without adequate knowledge regarding the optimal treatment method for effluent originating from textile dyeing industries. With the continuous growth of textile industries and the resulting increase in wastewater production, it is crucial to determine the most appropriate treatment procedure for the effluent from textile dyeing businesses. If the current approach to developing ETP persists, we will inevitably face significant environmental contamination in the near future, regardless of the regular operation of the ETPs [4].
A. Objective of the research
The specific objectives of the study were to:
- To assess the characteristics of textile liquid wastewater from the inlet of textile effluent treatment plant (ETP)
- To assess the characteristics of textile liquid wastewater from the outlet of textile effluent treatment plant (ETP).[5]
B. Scope of the study
There are some limitations of this study as an example:
- The sample size for the research was small and that was not sufficient as well as very difficult to generalize the output of the research.
- There are some budgeting problem while collecting data and information.
C. Location of Sample Collected
The collected wastewater was from “The natural group” which is situated in Tonga Bari, Ashulia, Savar, Dhaka, Bangladesh and another was “The Emakulet textile Ltd” which is situated in Purbo ponchash, Dhamrai, Dhaka, Bangladesh.
METHODOLOGY
The wastewater samples for this investigation were obtained straight from the equalisation tank of the Effluent Treatment Plant (ETP), which contains a mixture of chemical substances used for cleaning, scouring, bleaching, dyeing, washing, rinsing, finishing, and printing. A 500 milliliter plastic bottle was procured from a nearby market for the purpose of collecting wastewater samples. Methodology does not serve as a panacea for a problem; rather, it is a methodical and theoretical examination of the approach employed within a specific field of study.[6][7][8]
A. Sample and data collection
These samples were collected from “The natural group” which is located in Tonga Bari, Ashulia, Savar, Dhaka, Bangladesh and another was “The Emakulet textile Ltd” which is located in Purbo ponchash, Dhamrai, Dhaka, Bangladesh. It was collected from the inlet and outlet of effluent treatment plants. All samples were collected before 12 hours of the lab test. Prior to the acquisition of the wastewater sample, the plastic bottles underwent a comprehensive washing process with distilled water. Each bottle was tagged with a permanent marker to facilitate identification, as the bottles were nearly filled with sample water.
B. Test procedure to determine the temperature of water
- The temperature was measured in the time as sample collection by Celsius thermometer.
- The sample was taken in a plastic bottle and recorded its temperature immediately by dipping the thermometer for about one minute.[9]
C. Test procedure to determine the pH in Water
- 100 ml sample was taken in a beaker.
- Switch on the pH meter, and calibrate the meter.
- Measure temperature when the sample after into a beaker because in pure water at 25O Celsius pH is 7.0 in the neutral point, but this varies with temperature and the ionic strength of the sample.
- Then collect value for all samples to use pH meter reading.[10]
D. Test procedure to determine the DO in Water
- Testing procedure for Dissolved Oxygen (DO) test was done by a DO meter in the laboratory.
- 100ml sample was taken in a beaker then calibrate the DO meter and dipping the meter into the beaker until the value was stabled.[11]
E. Test procedure to determine the Biological Oxygen Demand (BOD5)
The dilution method was used to estimate the biological oxygen demand (BOD5). The procedure involves transferring the sample into a hermetically sealed 300 ml vial and subjecting it to incubation at a temperature of 20°C for a duration of 5 days. The measurement of dissolved oxygen (DO) in wastewater was conducted using a DO meter (HQ40d portable DO meter, HACH, USA) both before and after incubation. The biochemical oxygen demand (BOD5) was then calculated by subtracting the final DO value from the beginning DO value. The calculation of BOD5 was performed as follows:
![]()
The variables in the equation are as follows: DO represents the dissolved oxygen (DO) of the diluted solution initially (mg/l), D5 represents the DO of the diluted solution after 5 days of incubation (mg/l), and p represents the decimal dilution factor.[12][13]
F. Test procedure to determine the Chemical Oxygen Demand (COD)
- The dichromate digestion method was employed to conduct the test.
- A volume of 2 ml of wastewater sample was introduced into the COD vials, which were filled with a solution of potassium dichromate (K2Cr2O7), a potent oxidizing agent, in a highly acidic medium (H2SO4) that contained a catalyst of silver sulphate (Ag2SO4).
- The sample underwent reflux at a temperature of 150°C for a duration of 2-3 hours to facilitate digestion.
- The chemical oxygen demand (COD) values were directly measured using a HACH spectrophotometer (Model no-DR 2800, USA).[14][15]
G. Test procedure to determine the TDS & TS of water
For TS
- Obtain a glass beaker with a capacity of 150 ml, which has been stored at a temperature of 10°C in an oven for a duration of one hour. Proceed to mark the beaker accordingly. Determine the mass of the vacant container.
- The sample was subjected to thorough mixing. Utilize the measuring cylinder to accurately measure 100 ml of the sample and transfer it into the beaker.
- The beaker should be placed in an oven that is kept at a temperature of 10°C for a duration of 24 hours. Cool the beaker and weigh after a duration of 24 hours. Determine the weight of the solids in the beaker by subtracting the weight of the clean beaker, as determined in step-1.[16]
- Determine the total solids (TS) using the following method:
For TDS
- Same as above (step-1 of TS measurement)
- A 100 mL sample was subjected to filtration using a double-layered filter paper, and the resulting filtrate was collected in a beaker.
- Repeat the same procedure as in steps-3 and 4 of TS measurement and determined the dissolved solids contents.[16] [17]
- Test procedure to determine the Turbidity in water
- Ensure the calibration of the meter will be calibrated at 100 NTU.
- Then water sample gives up to the “Digital Turbidity” meter.
- After a few minutes meter will show the result of Turbidity.[18]
- Test procedure to determine the Iron in water
- Transfer a volume of 100 mL of the water sample into a designated container.
- Add 5 ml of dilute hydrochloric acid (HCI).
- Add 2 drops of potassium permanganate solution.
- Add 5 ml of potassium thiocyanate solution.
- Then shake the mixed sample. If it shows color brown then it present iron and if don’t show brown color then iron is not present.
- Then the sample place in color comparator cubes and wait 4 minutes.[19]
RESULTS AND DISCUSSION
The chapter of result and discussion presents all data on different phases like as tabular and graphical form. Analysis of collected data to determine different parameters from different phases of the study which are also included in the test result.
A. Discussion on inlet value of ETP
In the present research, the wastewater was collected from the Inlet of ETP. The wastewater was tested for pH, DO, BOD5, COD, TDS, TSS, Turbidity, Fe2+ and found out the Characteristics of those parameters. [20]
Table I. Inlet Values of parameters of ETP samples. [22]
| Sl. No | Name of the parameter | Unit | Lab test Report on The Natural Group |
|
Lab test Report on The Emakulet Textile | Average of the samples | |||||
| Sample
1 |
Sample
2 |
Sample
3 |
Sample
1 |
Sample
2 |
Sample
3 |
||||||
| 1 | PH | — | 7.7 | 7.74 | 7.76 | 7.33 | 7.16 | 7.19 | 7.21 | 7.19 | |
| 2 | DO | mg/l | 0.0 | 0.0 | 0.0 | 0.0 | 0.0 | 0.0 | 0.0 | 0.0 | |
| 3 | BOD5 | mg/l | 125 | 126 | 127 | 126 | 50 | 46 | 54 | 50 | |
| 4 | COD | mg/l | 402 | 400 | 400 | 400.67 | 220 | 214 | 217 | 217 | |
| 5 | TDS | mg/l | 715 | 721 | 720 | 718.66 | 182.4 | 180.6 | 184.2 | 182.4 | |
| 6 | TSS | mg/l | – | 239 | – | 239 | 185 | 189 | 193 | 189 | |
| 7 | Turbidity | NTU | 18.54 | 20.06 | 24.55 | 21.31 | 25 | 22 | 28 | 25 | |
| 8 | Fe2+ | mg/l | 7.77 | 7.74 | 7.50 | 7.67 | 10 | 9.34 | 9.67 | 9.67 | |
Firstly, three water samples were collected from the inlet of “The Natural Group” to determine the pH condition. Sample-1 given the value is 7.7, sample-2 presents 7.74 and sample-3 presents 7.76. In contrast, the pH value of “Emakulet textile” from sample-1 presents 7.16, Sample-2 presents 7.19 and Sample-3 presents 7.21. pH values of both ETP was satisfied the ECR-1997 limits.
Similarly, for testing DO in water taken the water sample from both ETP from inlet but there was not an any DO in water of each sample. Amount of BOD5 from the inlet of “Natural group” was 125 mg/l from sample-1, 126 mg/l from sample-2 and 127 mg/l from sample-3. It crossed the limit of ECR-1997. On the other hand, Amount of BOD5 from the inlet of “Emakulet Textile” was 50 mg/l from sample-1, 46 mg/l from sample-2 and 54 mg/l from sample-3. As like as, “Natural Group” and “Emakulet Textile” given the test result of COD, TSS, TDS, Turbidity and Iron from inlet water of ETP but each are not acceptance range of ECR-1997.[21][22][23]
B. Discussion on outlet value of ETP
The wastewater was collected from the outlet of ETP. The wastewater was tested for pH, DO, BOD5, COD, TDS, TSS, Turbidity, Fe2+ and found out the Characteristics of those parameters. To measure the pH state, three water samples were collected from the output of “The Natural Group”.
Table II. Outlet Values of parameters of ETP samples [22]
| Sl. No | Name of the parameter | Unit | Lab test Report on The Natural Group | Lab test Report on The Emakulet Textile | Standard Value (ECR-1997) | ||
| Inlet | Outlet | Inlet | Outlet | ||||
| 1 | PH | – | 7.73 | 7.16 | 7.19 | 7.79 | 6.0-9.0 |
| 2 | DO | mg/l | 0 | 7.02 | 0.0 | 4.5 | 4.5-8.0 |
| 3 | BOD5 | mg/l | 126 | 47 | 50 | 26 | <50 |
| 4 | COD | mg/l | 400.67 | 179 | 217 | 154 | <200 |
| 5 | TDS | mg/l | 718.66 | 640.67 | 182.4 | 1172 | 2100 |
| 6 | TSS | mg/l | 239 | 89 | 189 | 76 | 100 |
| 7 | Turbidity | NTU | 21.31 | 6.87 | 25 | 7.7 | 10 |
| 8 | Fe2+ | mg/l | 7.67 | 0.32 | 9.67 | 0.52 | 0.3-1.0 |
Sample-1 given the value is 7.14, sample-2 presents 7.16 and sample-3 presents 7.17. In contrast, the pH value of “Emakulet textile” from sample-1 presents 7.75, Sample-2 presents 7.83 and Sample-3 presents 7.79. pH values of both ETP were satisfied the ECR-1997 limits.
Similarly for testing DO in water taken the water sample from both ETP from inlet and the Natural group presents the DO values sequentially sample-1, sample-2, sample-3,was 6.99 mg/l, 7.0 mg/l, 7.07 mg/l, in opposition Emakulet textile presents the DO values from sample-1, sample-2, sample-3 are sequentially 4.1 mg/l, 4.5 mg/l, 4.9 mg/l. Amount of BOD5 from the outlet of “Natural group” was 46 mg/l from sample-1, 48 mg/l from sample-2 and 47 mg/l from sample-3. On the other hand, Amount of BOD5 from the inlet of “Emakulet Textile” was 26 mg/l from sample-1, 24 mg/l from sample-2 and 28 mg/l from sample-3. As like as, “Natural Group” and “Emakulet Textile” given the test result of COD, TSS, TDS, Turbidity, and Iron from outlet water of ETP and each parameter were on acceptance range of ECR-1997. .[21][22][23]
C. Discussion on comparison of inlet and outlet values of ETP
Average of three sample from ETP inlet and average of three sample from ETP outlet was taken to makes this table. From this comparison table we have compared between the water parameter of “The Natural Group” and “The Emakulet Textile “and also checked the result with standard values of Environmental Conservation Rules.[21]
Table III. Comparison on inlet and outlet values of ETP
| Sl. No | Name of the parameter | Unit | Lab test Report on The Natural Group |
|
Lab test Report on The Emakulet Textile | Average of the samples | |||||
| Sample
1 |
Sample
2 |
Sample
3 |
Sample
1 |
Sample
2 |
Sample
3 |
||||||
| 1 | PH | — | 7.14 | 7.16 | 7.17 | 7.16 | 7.75 | 7.83 | 7.79 | 7.79 | |
| 2 | DO | mg/l | 6.99 | 7.0 | 7.07 | 7.02 | 4.1 | 4.5 | 4.9 | 4.5 | |
| 3 | BOD5 | mg/l | 46 | 48 | 47 | 47 | 26 | 24 | 28 | 26 | |
| 4 | COD | mg/l | 178 | 182 | 177 | 179 | 158 | 154 | 150 | 154 | |
| 5 | TDS | mg/l | 635 | 642 | 645 | 640.67 | 1250 | 1172 | 1094 | 1172 | |
| 6 | TSS | mg/l | – | 89 | – | 89 | 76 | 80 | 72 | 76 | |
| 7 | Turbidity | NTU | 7.0 | 6.9 | 6.7 | 6.87 | 8.4 | 7.7 | 6.9 | 7.7 | |
| 8 | Fe2+ | mg/l | 0.32 | 0.35 | 0.30 | 0.32 | 0.52 | 0.45 | 0.59 | 0.52 | |
For an example, the inlet value of pH from Natural Group is 7.73 and the outlet value is 7.16, on the other hand, the inlet value of Emakulet Textile is 7.19 and outlet value is 7.79 According to ECR-1997 the range of pH is 6 to 9, so our result is being satisfied. Similarly, DO, BOD5, COD, TDS, TSS, Turbidity, Fe2+ is being tested and satisfied with ECR-1997 (Table-3).[21][22][23]
A. Water pH values of inlet and outlet
All values are taken from (Table-2.) Water pH influences the different properties of the water body, such as activity of organism and potency of toxic substance present in the aquatic environment. According to the environmental conservation rules 1997, the range of pH 6-9, so the tested values is satisfied which given by the bar chart.[24]
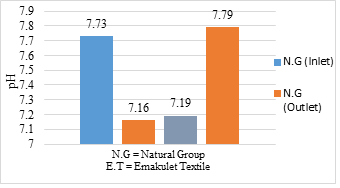
Fig.1 pH values of inlet and outlet
B. Dissolved Oxygen (DO)
From (Table – 2.) there was no DO in the inlet of both ETP but after treated there was some DO and it’s satisfied the environmental conservation rules 1997. According to ECR-1997, the range of the DO amount will be 4.5-8 mg/l and our tested DO was 7.02 mg/l and 4.5 mg/l so the bar chart will be as like as below: [25]
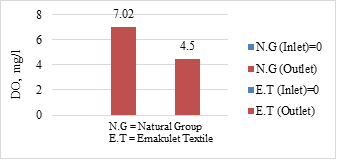
Fig. 2 DO values of inlet and outlet
C. Biochemical Oxygen Demand (BOD5)
According to the environmental conservation rules 1997, the BOD amount will be 50 mg/l or less than 50 mg/l. And after treated of our water sample we found our result below 50 which showing in following bar chart (Fig. 3.) [21] [26]
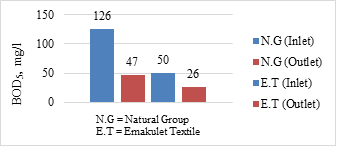
Fig. 3 BOD5 values of inlet and outlet
D. Chemical Oxygen Demand (COD)
For textile industries COD standard 200 mg/l, (ECR-1997).Before treated The COD (permanganate) value of the research effluent was found out to be in the range of 400.67 mg/l and 217 mg/l but after treated it decreased and reach at 47 mg/l and 26 mg/l. So the bar chart will be:[21][27]
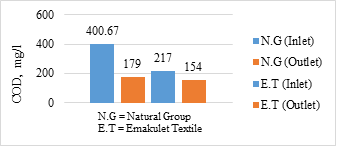
Fig. 4 COD values of inlet and outlet
E. Total Dissolved Solid (TDS)
According to ECR-1997, TDS discharge standard for textile industries is 2100 mg/l. The TDS samples were found in the inlet of ETP 718.66 mg/l and 182.4 mg/l after the treatment of the sample the value was increased in the outlet of ETP and it was 640.67 mg/l and 1172mg/l. The value was satisfied with the scale of ECR-1997. [28]
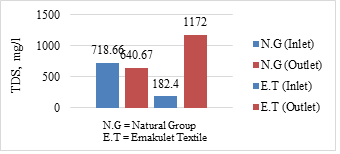
Fig. 5 TDS values of inlet and outlet
F. Total Suspended Solid (TSS)
The destruction of fish habitat can also occur due to the settling of suspended particles at the river bed, leading to their eventual blanketing. Suspended particles have the potential to directly impair fish by obstructing their gills, so diminishing their growth rates and compromising their resistance to illnesses. In the inlet sample, the TSS value is 239 mg/l and 189 mg/l and the outlet value was 89 and 76 mg/l and the standard value is 100 mg/l (ECR-1997). So, the graphically formed of TSS is: [29]
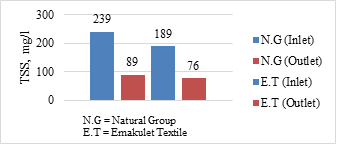
Fig. 6 TSS values of inlet and outlet
G. Turbidity values of inlet and outlet
According to the Bangladesh Environmental Conservation rules 1997, water standard for turbidity is 10 NTU and our tested value of inlet was 21.31 NTU and 25 NTU and after the treat of water it was 6.87 NTU and 7.7 NTU which satisfied the range (ECR-1997). [21]
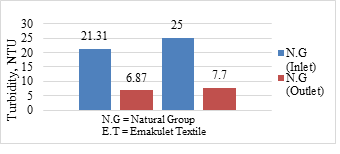
Fig 7 Turbidity values of inlet and outlet
H. Iron values of inlet and outlet
In this graph, it can be seen the inlet and outlet values of iron which we found in the lab by testing samples. In this graph, it can be seen iron present in inlet samples that the amount of 7.67 mg/l and 9.67 mg/1, on the other hand, the outlet samples present the value is 0.32 mg/l and 0.52 mg/l. The standard iron for water is 1 mg/l (ECR-1997). The result is shown in Fig. 8 [21]
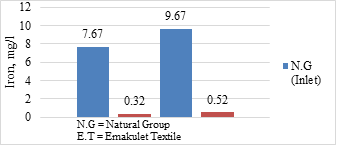
Fig. 8 Iron values of inlet and outlet
CONCLUSIONS
The findings of this study demonstrate that the utilization of biological technologies for textile wastewater treatment exhibits a high level of efficiency, cost-effectiveness, and environmental friendliness. Small and medium-scale manufacturers face significant challenges, particularly in terms of high initial investment and space needs, which pose substantial limits. The implementation of government initiatives aimed at securing bank loans for the establishment of effluent treatment plants with minimal interest rates can be considered. The advancement of biological processes is crucial for the effective treatment of inorganic substances. The results of this paper indicate that the water parameters taken from the entrance of the ETP did not meet the permissible standards outlined in ECR-1997. The wastewater sample obtained from the outflow of the ETP has been subjected to treatment, resulting in acceptable results that meet the standard value established by ECR-1997.
REFERENCES
- Al-Mutairi., Nabil K., Parviz K., M.M., [2004] Modeling and Predicting Biological Performance of Contact Stabilization Process Using Artificial Neural Networks, Computing in Civil Engineering, Vol.18.
- Md. Aktaruzzaman [March, 2006] Dep of Civil Engineering Bangladesh university of Engineering Technology Treatment of textile liquid waste.
- Aishwariya Sachidhanandham& Aravin Prince Periyasamy [11 July 2021] Environmentally Friendly Wastewater Treatment Methods for the Textile Industry.
- ENRAC [2017] stated Use and Effectiveness of Effluent Treatment Plants (ETPs) in the Garments Industry of Bangladesh.
- Dishit P. Ghumra, Chandrodai Agarkoti, Parag R. Gogate [January 2021] Improvements in effluent treatment technologies in Common Effluent Treatment Plants (CETPs): Review and recent advances
- Christopher S McMahan PhD , Stella Self PhD , Lior Rennert PhD , Corey Kalbaugh PhD [8 December 2021] COVID-19 wastewater epidemiology: a model to estimate infected populations.
- Ning Ding, Di An, Xiufeng Yin & Yingxue Sun [24 February 2020] Detection and evaluation of microbeads and other microplastics in wastewater treatment plant samples.
- Hong Chen, Xin Yu, Xiaonuan Wang, Yueling He, Chengji Zhang [13 October 2021] Dyeing and finishing wastewater treatment in China: State of the art and perspective.
- Ritabrata Roy [January 2019 ] An Introduction to Water Quality Analysis DOI:10.31786/09756272.18.9.2.214
- Dr. Piyush Kumar Sonkar and Narvdeshwar [August 2022] pH Determination of Water Sample Using A pH Meter
- Ariely Carvalho , Ruben Costa, Sara Neves, Cristina M. Oliveira, Ricardo J.N. Bettencourt da Silva [6 March 2021] Determination of dissolved oxygen in water by the Winkler method: Performance modelling and optimisation for environmental analysis https://doi.org/10.1016/j.microc.2021.106129
- S. Jouanneau, L Recoules , M.J. Durand, A. Boukabache, V. Picot, Y. Primault, A. Lakel , M. Sengelin , B. Barillon , G. Thouand [12 November 2013] Methods for assessing biochemical oxygen demand (BOD): A review https://doi.org/10.1016/j.watres.2013.10.066
- Hassan Rezvani pour, Noorollah Mirghaffari, Mehdi Marzban, and Abdolrazagh Marzban [October 2014] Determination of Biochemical Oxygen Demand (BOD) Without Nitrification and Mineral Oxidant Bacteria Interferences by Carbonate Turbidimetry
- Hengliang Mo, Yongmei Chen, Yang Tang [May 2019] Direct determination of chemical oxygen demand by anodic oxidative degradation of organics at a composite 3-D electrode DOI: 10.1007/s10008-019-04250-4
- Ji Li, Guobing Luo, LinJun He [August 2017] Analytical Approaches for Determining Chemical Oxygen Demand in Water Bodies: A Review DOI: 10.1080/10408347.2017.1370670
- Nur Fatihah Sukor [EXPERIMENT NO-2] EXPERIMENT ON DETERMINATION OF TOTAL DISSOLVED AND SUSPENDED SOLIDS IN WATER
- Brian H Kiepper, Associate Professor, Poultry Science [Published on Mar 01, 2024] Understanding Laboratory Wastewater Tests: II. Solids (TS, TSS, TDS, TVS, TFS)
- IS: 3025(part 10 ) – Reaffirmed 2002, CEM Class, Group A [30 August 2010] Test procedure to determine the Turbidity in water.
- Dorota Agnieszka Korte, Gaja Tomsič, Arne Bratkič, Mladen Franko [December 2019] Determination of Iron in Environmental Water Samples by FIA-TLS DOI: 10.17344/acsi.2018.4825
- Md Najmul Hasan, Samsul Islam, Mohammad Zoynal Abedin [January 2022] Performance Evaluation of Textile Effluent Treatment Plant: Bangladesh Perspective DOI: 10.26776/ijemm.07.01.2022.03
- ECR [1997] published “Global water supply and sanitation assessment 1997 report”, Geneva.
- Jyotsana Maura, Suchita Atreya, Anfal Arshi [November 2023] The Treatment of Wastewater, Recycling and Reuse – Past, Present, and in the Future DOI: 10.21275/SR231013064713
- Ehsan Aghdam, Saeed Reza Mohandes, Patrick Manu, Clara Cheung, Akilu Yunusa-Kaltungo, Tarek Zayed [31 March 2023 ] Predicting quality parameters of wastewater treatment plants using artificial intelligence techniques https://doi.org/10.1016/j.jclepro.2023.137019
- Sandeep Kumar Gautam, Divya Sharma, Jayant Tripathi [March 2012] A study of the effectiveness of sewage treatment plants in Delhi region DOI: 10.1007/s13201-012-0059-9
- P. Chiranjeevi, Sunil A. Patil [1 May 2020] Microbial fuel cell coupled with microalgae cultivation for wastewater treatment and energy recovery https://doi.org/10.1016/B978-0-12-817493-7.00010-2
- Abdulaziz Sami Qambar, Mohammed Majid Al Khalidy [17 October 2022] Prediction of municipal wastewater biochemical oxygen demand using machine learning techniques: A sustainable approach https://doi.org/10.1016/j.psep.2022.10.033
- R.R. Bansode, J.N. Losso, W.E. Marshall, R.M. Rao [5 February 2004] Pecan shell-based granular activated carbon for treatment of chemical oxygen demand (COD) in municipal wastewater https://doi.org/10.1016/j.biortech.2003.12.009
- Si Chen, Jiahui Xie, Zhiyou Wen [9 November 2021] Chapter Four – Microalgae-based wastewater treatment and utilization of microalgae biomass https://doi.org/10.1016/bs.aibe.2021.05.002
- Muh. Fajaruddin Natsir, Makmur Selomo, Ainkhaer [11 June 2020] The effectiveness of drum of wastewater treatment (DOWT) in reducing TSS of domestic wastewater. https://doi.org/10.1016/j.enfcli.2019.10.063
- BTMA [2004] Presented and article “Opportunity in BD Textile industry for Investment from Taiwan” to the Taiwan Investors.