
Evaluation of the Genotoxic and Mutagenic Potential of River Challawa Impacted by Industrial Effluents Using Ames and Comet Assays
- Asma’u Ibrahim Safana
- Mudassir Badamasi
- Tijjani S. Imam
- 938-951
- Mar 19, 2025
- Toxicology
Evaluation of the Genotoxic and Mutagenic Potential of River Challawa Impacted by Industrial Effluents Using Ames and Comet Assays
Asma’u Ibrahim Safana1*, Mudassir Badamasi1, Tijjani S. Imam2
1Department of Biological Sciences, Umaru Musa Yar’adua University, Katsina
2Department of Biological Sciences, Bayero University Kano
DOI: https://doi.org/10.51244/IJRSI.2025.12020073
Received: 07 February 2025; Accepted: 17 February 2025; Published: 19 March 2025
ABSTRACT
Several potential genotoxins found in water samples arise from anthropogenic activities which poses serious environmental concerns worldwide. The use of toxicity tests to evaluate the quality of streams add value by providing site-specific toxicological data. The objective of this study was to evaluate the genotoxic potential industrial effluents from the Challawa Industrial Area released into the river as a point source. This study aimed to identify the extent of industrial effluent’s mutagenicity and genotoxicity to Salmonella typhimurium strains and freshwater mussels using two assays, the Ames test, and the comet assay respectively. Water and mussel samples were collected from four (4) sampling sites along River Challawa on the basis of the different activities taking place. The Ames test without metabolic activation using Salmonella typhimurium TA98 and TA100 strains showed site-specific mutagenicity in the water samples tested. Hemolymph was extracted from freshwater mussels and used to assess DNA alterations using comet assay. Significant levels of tail DNA percentages as a result of migration of damaged DNA in hemocytes of freshwater mussels were observed. Genotoxic assessment of the water in freshwater mussels using comet assay also revealed mild DNA damages. Similarly, significant levels of SOD, CAT and GSH were recorded which indicates antioxidant response as a result of heavy metal exposure. These results indicate that mussels stimulated the increase in antioxidant enzyme activities as an adaptive response to oxidative damage by metals. The findings therefore showed that a combination of physicochemical analysis along with the toxicity assessment (using bioassays) at genetic levels would provide valuable and more realistic information about the toxicity of chemical pollutants present in the water samples.
Keywords: Genotoxicity, Mussels, Wastewater, Comet assay, Ames test.
INTRODUCTION
One of the leading causes of water pollution is the unchecked release of wastewater from various industries into water bodies and many other environments. The generation of wastewater is mostly due to rapidly growing industrial sector for the development and expansion of the nation’s economy (Zeyad et al., 2019). Heavy metal contamination has been widely reported in water samples (Ali et al ., 2019), soil (Alsbou et al ., 2017), sediments and fishes (Fernandez-M et al ., 2018) and lakes (Rajeshkumar et al., 2018). Anthropogenic activities like smelting, mining, agricultural and industrial processes have been the source of heavy metal contamination of various environmental matrices (Rajput et al ., 2019).
The characterization of the quality of aquatic systems requires specially designed biological methods for assessing their health status. Biomarkers are known to be useful tools for assessing environmental health (Jourmi et al., 2012). Antioxidants represent the cellular defense mechanisms that counteract toxicity of reactive oxygen species (ROS), these mechanisms have been extensively investigated in sentinel organisms such as mussels (Jourmi et al., 2012). Among these antioxidant biomarkers are Superoxide dismutase (SOD) and Catalase (CAT), well-known antioxidant enzymes, which convert the ROS to hydrogen peroxide, and then to water respectively. The biological importance of SOD and CAT is more evident from various studies since H2O2 is the main cellular precursor of the hydroxyl radical (HO_) which is a highly reactive and toxic form of ROS leading to oxidative damage to basic biological molecules (Jourmi et al., 2012).
Comet Assay is one of the techniques for quantitative DNA damage and repair in eukaryotic cells and some prokaryotic cells. This technique is more advantageous as it detects low levels of DNA damage, requires only a very small number of cells, is cheaper than other techniques, is easy to carried out, and the results are obtained easily (Kaur et al., 2018). Ames test was introduced in 1975, by Bruce Ames a bacterial geneticist. It involves an experiment of growing bacteria on agar plates and comparing natural mutation rates to mutation rates of bacteria exposed to potentially mutagenic compounds or samples (Levski and Singer, 2003). In this test, an extract of rat liver called S-9 mix containing microsomal enzymes and cofactors, is often added to the bacterial medium. The medium contains genetically modified Salmonella typhimurium strains. The presence of mutations in the histidine genes, causing defects in a metabolic pathway leading to the production of histidine, allows positive selection of histidine revertants on minimal agar plates lacking histidine. Only mutants that are able to restore this function are able to form colonies on such plates. Usually, the plates containing the tested compound and tester bacteria are incubated for 48 hours and bacterial colonies are counted (Levski and Singer, 2003).
The Salmonella assay is widely used for genotoxicity detection in water samples. It is based on the detection of histidine-independent revertant in selected strains after exposure to mutagens with or without activation enzymes. Some researchers combined the salmonella assay with other biological test for a good correlation and better interpretation of results (Takamura-Enya et al., 2002).
Different species bivalves such as clams, mussels, and oysters have widespread distribution across the continents, and many of these species have been successfully used for monitoring the concentrations of contaminants in the marine environment (Farrington et al., 2016). Challawa river is one of the main water sources in Kano, comprising the upstream, where lesser human activities mainly fishing and sand dredging occur, midstream into which effluents are being discharged from Challawa Industrial Area, and the downstream where human activities mainly irrigation and fishing occur. The major industries in Challawa are tanneries, textiles, foods and packaging. The effluents derived from the industries in the estate are connected by canals and channelled directly into the river as a point source (Uzairu et al., 2014). These prompt the need to evaluate the impacts of such pollutants in mussels and water. Hence, the aim of this research is to evaluate the genotoxic potential of River Challawa impacted by industrial effluent using Ames and comet assays.
MATERIALS AND METHODS
Study Area
Challawa River is located in Challawa industrial estate between (11 º 45 ́ 42 N; 8 º 46 ́ 17 E) in Kumbotso Local Government Area of Kano state (Uzairu et al, 2014). The is River 515m above sea level originate from the Challawa Gorge dam and stretches down to River Kano where it empties into Lake Chad (Udiba et al., 2018). Challawa River is one of the rivers that receive effluents from the industrial estate. The major industries in Challawa are tanneries, textile, food, agro-allied, plastic and packaging industries (Uzairu et al, 2014).
All the samples for this research work were collected once, every month across 12 months in triplicates. All reagents used were of analytical grade.
Water Sampling
A total 12 samples of wastewater were collected monthly between June 2022 and May 2023 in triplicates. Samples were collected from the various points in 1L sterile polyethene plastic bottles by dipping the bottles about 20 cm below the water surface and filling them to the brim. They were stored in an ice box, transported to the laboratory and refrigerated at about 4oC prior to analysis as adopted by Indabawa (2012). All reagents used were of analytical grade.
Mussel Sampling
Species of Anodonta marginata were collected and identified using taxonomic guides by Lydeard et al. (2004). Mussels were collected at each sampling point using shovels and picking them by hand were immediately transferred to the laboratory. Species were placed in a container with water and sediment from the sampling stations, placed in a larger box containing icepacks and then transported to the laboratory for sample preparation (maximum transit time: 2 hours) as adopted by Food Standards Agency, UK (2020).
Oxidative Stress Biomarkers Assay
Whole soft tissues from each specimen (n = 3 for each site) were dissected out and immediately homogenized (1:3) in phosphate buffer 100 mM, pH 7.4. Homogenates were then centrifuged at 9000 G at 4 °C for 30 min as described by Yusuf et al., (2021). After centrifugation, supernatants were collected and immediately used for the determination of enzyme activities. Catalase activity was measured following the decrease of absorbance at 240 nm due to H2O2 consumption according to Aebi (1983). An extinction coefficient for H2O2 of 40 M-1 cm-1 (Abel, 1974) was used in the calculation. The obtained supernatant was used for the assay of superoxide dismutase (SOD) activity, which was based on its ability to inhibit the oxidation of epinephrine by superoxide anion (Aksnes and Njaa, 1981). The enzyme activities were assayed with an SP 1800 UV/VIS Spectrophotometer.
Glutathione activity was analyzed by preparing tissue samples by washing them twice with PBS. 0.1 g of the sample was added into a homogenizer, 1mL reagent was added (the proportion of tissue and reagents are kept constant) and this was fully ground on ice (using liquid nitrogen gave a better grinding effect). Centrifugation was done at 8000 x g for 10 minutes at 4oC, the supernatant was also placed at 4oC. The spectrophotometer was then preheated for 30 minutes and adjustment was made to a wavelength of 412 nm with distilled water.
Comet Assay
For genotoxicity assays, the shell was carefully opened, and care was taken not to destroy the posterior adductor muscles. Hemolymph from the mussels was collected by inserting a hypodermic needle through the posterior adductor muscles. Hemolymph collected was stored in sterile tube containers and placed on ice, thereafter frozen at -40 oC prior to analysis (Borsuk et al., 2017).
Comet assay procedure was adapted from Ullah et al (2016) with slight modifications. Briefly, 10 µl of hemolymph was added to 40 µl of low melting point agarose, mixed, and placed on a microscope slide pre-coated with normal melting point agarose. A coverslip was added, and the slides were immediately placed on ice. After agarose solidifies, coverslips were removed, and the slides were immersed in a lysis solution (2.5M NaCl, 100mM EDTA and 10mM Tris, pH 10.0–10.5) containing 1% Triton X-100 and 20% Dimethyl Sulfuoxide (DMSO).
The slides were kept chilled in lysis solution (4 ºC), and protected from light for at least 1 hour. They were subsequently incubated in freshly prepared alkaline buffer for 20 minutes for DNA unwinding. Electrophoresis was performed for 25 minutes at 300 mA and 21 Volts in the same buffer. Every step was carried out under indirect yellow light to prevent UV damage.
After electrophoresis, the slides were transferred to a small basin containing pre-chilled deionized water, immersed for 2 minutes, rinsed and repeated twice more. The final water rinse was replaced with cold 70 % ethanol for 5minutes. The slides were maintained horizontally and removed from ethanol and allowed to air dry. After the slides and agarose were completely dry, 50 mL of Vista green DNA dye was added and incubated at room temperature for 15 minutes. Slides were then viewed under a fluorescence microscope fitted with a camera (Optikam 4083.B5 Model). Three replicates were prepared per sample for analysis.
DNA damage parameters such as tail and head DNA percentages, tail and head lengths and tail moment were calculated using the comet assay software (Casplab Version 1.2.3b1). For genetic damage index calculation, cells were sorted out into four classes, according to tail size. The genetic damage index (GDI) is the sum of classes of the 100 cells analyzed, and may vary from 0 (all cells undamaged – 0 × 100) to 400 (all cells highly damaged – 4 × 100). The genetic damage index is based on the length of migration and on the amount of DNA in the tail, and it is considered a sensitive measure of detectable DNA damage.
Salmonella typhimurium Mutagenicity Assay
A direct concentration method was used to prepare the Salmonella assay water samples, as according to Bhargavi et al. (2019). All water samples were sterilized by vacuum filtration using Millipore filters with 0.22 mm pores prior to starting the assay.
Ames test for mutagenicity was carried out using Salmonella typhimurium histidine auxotrophs TA98 and TA100. The procedure of the Ames test without metabolic activation was carried out using Muta-Chromoplate Ames test kit (Environmental Bio-detection Products Inc- EBPI, Canada). All steps in the procedure were carried out aseptically in a biosafety cabinet according to methods described by Maron and Ames (1983) and Alabi et al. (2014).
The growth media supplied were transferred to lyophilized bacterial strain in their vials and incubated overnight at 37 °C. This is done a day before the experiment. Three dilutions (2.5, 7.5 and 12.5ml) of each test sample was prepared with sterile distilled water and transferred to sterile tubes so that volume of each tube equals 17.5 ml. Exposure media (Davis-Mingioli salts composed of D- glucose [ICN Biomedicals, Aurora, OH, USA; CAS 50-99- 7], D-biotin [ICN Biomedicals, Aurora, OH; CAS 22879- 79-4], L-histidine [Sigma, St. Louis, MO, USA; CAS 7048- 02-4], and bromocresol purple [Fisher Scientific, Nepean, Ont.; CAS 115-40-2]) was prepared and transferred to its provided bottle and mixed thoroughly. 2.5 ml of exposure media was pipetted into all tubes (test, positive, negative and sterility controls). 5 ml of bacterial strains was transferred into each tube except sterility control. Tubes were mixed thoroughly and mixture in each tube was transferred into sterile reagent boats. Using a multichannel pipette, 200 ml of each mixture was pipetted into a sterile 96 well plate. Plates were sealed in plastic bags and incubated at 37 °C for 3-6 days (Ames, 1975; Alabi et al., 2014). Procedure was performed with Sodium azide (NaN3) for TA100 and 4- Nitrofluorene for TA98 as positive controls. Sterile distilled water was used as negative control. At the end of this period, the plates were examined for color: all yellow, partially yellow and turbid wells were considered positive, whereas purple wells were deemed negative. The number of positive wells per plate was recorded and compared to the controls. A sample is considered mutagenic when there is a significant increase in the number of positive wells in treated plates over the negative control plates (i.e. mutagenic index (MI)). The results were expressed as Mutagenicity Index (MI=number of positive wells in treated plates/number of positive wells in the negative control plates) and are an average of at least three experiments.
Results were presented as Means ± SD. One-Way analysis of variance (ANOVA) with Post-Hoc test was used to determine significance in physico-chemical parameters. Independent student t-test was used to determine the seasonal variation in all parameters. Mutagenic potential of water was analysed using two-way ANOVA to compare the means across different sites, strains and concentrations. One-way ANOVA was used to compare the means of oxidative stress biomarkers and DNA damage parameters in different sites. All statistical analyses were conducted using R statistical software (Version 4.0.1). p < 0.05 was considered statistically significant.
RESULTS
Physico-chemical and Heavy Metal Analysis
The physicochemical parameters of River Challawa showed marked variations. pH recorded the lowest value of 5.78 of pH while the highest value of 7.98 was recorded with a mean of 7.32 ± 0.07. Variations of pH were significant in all the sites except in sites C and D (p<0.05). However, variations between wet and dry seasons were not significant (p>0.05) as demonstrated in table 1.
Values of electrical conductivity ranged between 129 µS/cm and 503 µS/cm with a mean of 298.15±8.84 µS/cm. Analysis of Variance revealed there were significant variations in the different sites (p<0.05) except between sites A and C (p>0.05). Values of EC between wet and dry seasons varied significantly (p<0.05) as seen in table 1.
The lowest value of TDS was 87 mg/L and the highest value of 416 mg/L was recorded. Analysis of Variance revealed there were significant variations in TDS across the sites except in sites A and C (p<0.05) as shown in table 1. There was however no significant variation in the seasons (p>0.05).
Turbidity ranged between 133 NTU and 208 NTU with a mean value of 168.08±1.41 NTU. Analysis of Variance revealed there were significant differences in turbidity across the different sites (p<0.05). ANOVA also indicated a significant difference between the wet and dry seasons (p<0.05) as seen in table 1.
Dissolved Oxygen values ranged between 4.33 mg/ and 6.99 mg/L with a mean of 5.52 ± 0.04 mg/L. Analysis of Variance revealed no significant differences in DO in all sites except site B (p>0.05). Similarly, variation between wet and dry seasons was significant (p<0.05).
BOD values ranged from 22.5 mg/L to 39.77 mg/L with a mean value of 27.69±0.26 mg/L. Analysis of Variance revealed significant differences in both sites and seasons in BOD (p<0.05).
Nitrate ranged between 9.89 mg/L and 25.39 mg/L with a mean value of 15.40±4.35 mg/L. Analysis of Variance revealed significant variations in the sites and seasons in nitrate-nitrogen (p<0.05)
The values of Phosphate ranged between 2.31 mg/L and 5.73 mg/L. There were significant differences in phosphate in the different sites (p<0.05) except in sites C and D (p>0.05). Similarly, variations in phosphate between wet and dry seasons were not significant (p>0.05).
Mean levels of Cd (0.088 ± 0.01 mg/L), Cr (0.457 ± 0.10 mg/L), Pb (0.127 ± 0.08 mg/L) and Ni (0.101 ± 0.10 mg/L) in water have exceeded the WHO (2018) guideline limits of 0.003 mg/L, 0.05 mg/L, 0.01 mg/L and 0.07 mg/L respectively. Cu and Mn were found within guideline limits. Highest concentrations of all metals in water were recorded in site B, while Site D recorded the least concentrations in heavy metals.
Oxidative Stress Biomarkers
Levels of SOD ranged between 12.15 and 39.43 u/ml from sites C and B respectively. The highest mean value recorded was in site B with 35.22 u/ml. Lowest mean value recorded was in site C with a value of 16.48 u/ml. There were significant differences in the values of SOD across all sites except between sites C and D (table 2). However, there was no significant variation (p > 0.05) in means of SOD across wet and dry seasons as shown in table 3.
Levels of CAT recorded in mussels from River Challawa had the highest mean of 39.78 u/ml in site B, while the lowest mean of 5.26 u/ml was reported in site A. There were significant variations across all sites (p < 0.05), however, differences between wet and dry seasons were not significant (p > 0.05). Levels of GSH in mussels from River Challawa ranged from 3.45 μg/ml in site A to 21.45 μg/ml in site B. Differences in means between the sites were significant except between sites A and C (p < 0.05). Differences in means of GSH across wet and dry seasons were not significant (p > 0.05).
Comet Assay
In this study, hemocytes of freshwater mussels were collected and analyzed for DNA damage using single cell gel electrophoresis. Upon electrophoresis, damaged DNA migrates further than intact DNA hence forming comets as shown in figure 1. DNA damage is directly proportional to tail DNA. The details about DNA damage in the form of genetic damage index (GDI) and percentage tail DNA (TDNA) in the hemocytes of freshwater mussels collected from the study sites of River Challawa are presented in table 4.
Site A had a GDI of 0.13 ± 0.05 with TDNA of 8.58 ± 1.88 % which shows mild DNA damage. Damage differed significantly with other sites ( p<0.05). Mussels sampled from site B had GDI and TDNA of 0.53 ± 0.35 and 29.62 ± 13.25 % respectively. Based on these parameters, it is evident that the mussels had moderate levels of DNA damage in their hemocytes and highest compared to other sites. Mussels from site C had a GDI and TDNA values of 0.16 ± 0.07 and 11.55 ± 3.75 % respectively. These values also indicated mild DNA damage in the hemocytes of sampled freshwater mussels. Site D had the lowest values of GDI and TDNA of 0.04 ± 0.03 and 1.60 ± 2.65 % respectively. This site had the least DNA damage compared to other sites. Differences in DNA damage between wet and dry seasons were not significant in all sites (p>0.05).
On the basis of scoring, DNA damage in samples from all sites ranged between class 0 (No damage) to class 3 (Moderate damage).
Ames Assay
In the present study, waste water samples from the different study sites were evaluated for their potential mutagenicity in vitro using Ames assay. Ames bacterial reverse mutation test was used to detect the point and frame-shift mutations, which altered the nucleotide sequence of bacteria.
The results showed that the mutagenic activities expressed as Mutagenic Index using the TA98 strains in Sites B (8.79 ± 2.48) and C (6.69 ± 1.18) were greater than 2.0 while those of sites A (1.95 ± 0.50) and D (0.09 ± 0.25) were less than 2.0 (Table 5). Mutagenic indices using TA100 in sites A (2.67 ± 0.68), B (13.8 ± 3.94) and C (10.37 ± 2.12) were also greater than 2.0 while that of Site A (0.05 ± 0.19) was less than 2.0 as shown in Table 4.13. The samples produced responses that were twice as high as that of negative controls which indicates potential mutagenicity. There were significant differences between mutagenic indices in the sites (p<0.05), with no interaction between sites/strains. TA100 bacterial strain was observed to be more sensitive which indicates more base-pair mutations, while TA98 was less sensitive which indicates less frame-shift mutations. Differences in mutagenic index between TA98 and TA100 were significant (p<0.05).
Results shows that mutagenicity was dose dependent in both strains with higher mutagenic index occurring in the highest concentration of test sample (TA98- 4.89, TA100- 7.18). The differences were however not statistically significant (p>0.05). Similarly, variations between seasons were statistically not different in both strains (p>0.05).
Table 1: Mean (±SD) Variations of Physico chemical Parameters across Sites and Seasons
| Sites | Seasons | |||||
| Parameters | A | B | C | D | Wet | Dry |
| pH | 7.66± 0.11b | 5.98± 0.11c | 7.84± 0.09a | 7.79± 0.08a | 7.33±0.80a | 7.31±0.77a |
| EC (µs/cm) | 271.77±30.15b | 456.16±28.26a | 260.77±69.30b | 203.88±49.54c | 294.50±104.51a | 300.76±107.65a |
| TDS (mg/L) | 195.66±36.38b | 362.63±37.08a | 192.61±43.20b | 137.88±35.89c | 225.21±94.81a | 217.98±90.17a |
| Turbidity (NTU) | 165.27± 9.38c | 185.72± 10.73a | 172.50± 12.72b | 148.83± 8.28d | 173.88± 18.71a | 163.94± 14.14b |
| DO (mg/L) | 5.64± 0.28a | 5.30± 0.50b | 5.51± 0.39a | 5.61± 0.46a | 5.20± 0.43b | 5.74± 0.27a |
| BOD (mg/L) | 26.64± 1.97c | 30.32± 3.53a | 28.68± 2.02b | 25.10± 1.37d | 28.60± 4.01a | 27.03± 1.92b |
| NO3 (mg/L) | 13.38± 3.80c | 21.85± 2.77a | 14.8± 1.04b | 11.51± 0.87d | 17.14± 4.95a | 14.15± 3.92b |
| PO4 (mg/L) | 3.21± 0.57c | 4.51± 0.48a | 3.50± 0.40b | 3.46± 0.33b | 3.54± 0.80a | 3.76± 0.55a |
| Cadmium (mg/L) | 0.08± 0.00c | 0.086±0.01b | 0.101±0.01a | 0.08±0.00bc | 0.086±0.01a | 0.088±0.01a |
| Chromium(mg/L) | 0.071±0.01b | 1.62±0.86a | 0.07±0.02b | 0.08±0.03b | 0.589±0.96a | 0.378±0.65a |
| Copper (mg/L) | 0.010±0.004b | 0.012±0.007a | 0.011±0.005ab | 0.005±0.003c | 0.010±0.006a | 0.009±0.005a |
| Manganese(mg/L) | 0.375±0.09ab | 0.417±0.09a | 0.382± 0.10ab | 0.335±0.111b | 0.381±0.11a | 0.375±0.09a |
| Nickel (mg/L) | 0.216±0.128a | 0.06±0.010b | 0.056±0.006b | 0.060±0.008b | 0.094±0.080a | 0.105±0.100a |
| Lead (mg/L) | 0.046±0.023b | 0.157±0.08a | 0.156±0.100a | 0.146±0.077a | 0.128±0.09a | 0.125±0.087a |
Keywords: Temp- temperature, EC- electrical conductivity, TDS- total dissolved solids, DO- dissolved oxygen, BOD- biochemical oxygen demand, NO3– nitrate-nitrogen, PO4– phosphate-phosphorus
Table 2: Mean Concentrations of Oxidative Stress Enzymes in Mussels across Sites
| Sites | SOD (u/ml) | CAT (u/ml) | GSH (μg/ml) |
| Site A | 23.10±2.68b | 5.26±1.71d | 7.75±2.02bc |
| Site B | 35.22±1.80a | 39.78±3.33a | 18.06±1.57a |
| Site C | 16.48±1.40c | 26.88±2.65b | 8.37±0.83b |
| Site D | 16.79±1.26c | 24.72±1.68c | 7.45±0.89c |
Means followed by superscripts with different letters across the columns are significant at p<0.05
Table 3: Mean Concentrations of Oxidative Stress Enzymes in Mussels across Seasons
| Seasons | SOD(u/ml) | CAT(u/ml) | GSH(μg/ml) |
| Dry | 23.06±7.73a | 24.70±12.77a | 10.62±4.69a |
| Wet | 22.08±8.02a | 23.40±12.46a | 10.11±4.65a |
Means followed by superscripts with different letters across the columns are significant at p<0.05
Table 4: DNA Damage Parameters in Hemolymph of Anodonta marginata across Sites and Seasons (Mean ±SD)
| LHEAD | LTAIL | HDNA | TDNA | TM | GDI | ||
| Sites | A | 45.2±11.94a | 9.2±3.97ab | 91.42±1.88ab | 8.58±1.88ab | 0.81±0.43a | 0.13±0.05a |
| B | 27.2±10.3a | 10.4±4.74a | 70.48±13.07b | 29.62±13.28b | 3.08±1.98b | 0.53±0.35b | |
| C | 35.6±9.85ab | 7.3±2.58a | 88.45±3.75a | 11.55±3.75a | 0.83±0.39a | 0.16±0.07a | |
| D | 46.2±11.71a | 5.2±3.68a | 98.4±2.65a | 1.6±2.65a | 0.16±0.39a | 0.04±0.03a | |
| Seasons | Dry | 38.80±15.71a | 7.95±4.49a | 86.07±12.43a | 13.93±12.43a | 1.17±1.08a | 0.23±0.25a |
| Wet | 38.30±10.41a | 8.10±3.96a | 88.31±12.60a | 11.74±12.78a | 1.27±1.87a | 0.20±0.27a |
Means followed by superscript with different letters across the columns are significant at p<0.05
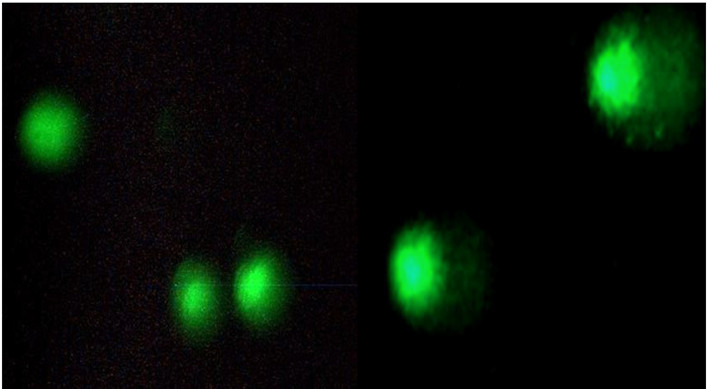
Fig 1: Comet Assay images showing DNA migration in some of the samples
Table 5: Mean Mutagenic Indices of Water in Strains of Salmonella typhimurium
| Variable | Categories | TA98 | TA 100 |
| Concentrations | 15
10 5 |
4.89±4.27a
4.54±3.97a 3.71±3.05a |
7.18±6.36a
6.82±6.11a 6.17±5.82a |
| Sites | Site A
Site B Site C Site D |
1.95±0.50c
8.79±2.48a 6.69±1.18b 0.09±0.25d |
2.67±0.68c
13.8±3.94a 10.37±2.12b 0.05±0.19d |
| Seasons | Dry
Wet |
4.32±3.64a
4.44±3.97a |
6.40±5.60a
7.05±6.50a |
| Interaction Concentration: Site | p.value: | 2.59e-10*** | 0.623 |
Means followed by superscript with different letters across the columns are significant at p<0.05.
DISCUSSION
Kano State is one of the major Industrial hubs in Nigeria, with Challawa Industrial Area being one of the three industrial estates in the state. It houses a number of industries including tanneries, textile, food, agro-allied and plastic industries, that produce vast quantities of wastewater that are steadily discharged into the river. Physico-chemical parameters employed to observe quality of water were pH, Conductivity, TDS, Turbidity, DO, BOD, Nitrates and Phosphates.
The mean monthly results obtained for pH from the surface water samples of River Challawa in the four sampling sites ranged between 5.86 ± 0.22 in September and 7.91 ± 0.31 in May. The mean value obtained for pH was 7.32 ± 0.90. Some observed values of pH were slightly lower than the acceptable limit required for drinking water by WHO which ranged from 6.5 to 8.5. The values obtained in this study were in the same range with that obtained by Iyama and Edori, (2013); Udiba et al. (2018) and Edori et al., (2021) from the Isiodu River, River Challawa and Whuo stream respectively. Mean pH values ranging from 7.21 ± 0.02 – 10.46 ± 0.01 and 7.23 – 7.65 have previously been reported for different sampling points along Challawa River by Wakawa et al. (2008) and Udiba et al. (2018) respectively.
Acidic water increases the rate of corrosion of metallic materials, pipes, cement walls and plumping materials, but alkaline water is a revelation that the water is disinfected and suitable for use (Rahmanian et al., 2015; Edori & Kpee, 2016). The acidic nature of the water in the river may be due to the prevailing domestic and industrial activities which has led to the deposition of metallic materials in the river within the sampled locations. When the pH values of water are on the extreme, it affects the taste and sweetness of the water. The efficiency and effectiveness of biochemical reactions within any water body hinges on pH as reported by Edoris et al. (2021).
The mean value obtained for electrical conductivity in the surface water of River Challawa was 298 ± 109.06 μS/cm. The values reported for electrical conductivity in this work were within the permissible limits of electrical conductivity by WHO in any aquatic environment. The values reported for conductivity in this study were quite higher in comparison to that from Edori and Nna (2018) which ranged between 11.60 ± 2.68 and 15.61 ± 3.01 μS/cm; Abdar (2013) in Morna Lake, Shirala, India and those detected by Sharma and Walia (2017) in Satluj River, Himachal Pradesh, India. The high level of the conductivity observed in the river may be due to run-off of industrial waste according to Verma et al. (2012).
The mean value obtained for total dissolved solids from River Challawa was 222 ± 93 mg/L which varied from 87 – 416 mg/L. The values obtained were within the permissible value of 1000 mg/L by WHO for potable water). Sigler and Bauder (2015) reported that total dissolved solids, basically is the sum of all minerals dissolved in the water system. These include carbonate, bicarbonate, chloride, fluoride, sulphate, phosphate, nitrate, calcium, magnesium, sodium, and potassium, but other ions dissolved in the water could also contribute to the total dissolved solids observed. Meays and Nordin (2013), added that, compounds of soil organic matter such as humic and or fulvic acids are also vital components of total dissolved solids.
Turbidity in the water samples of River Challawa in the four sites sampled varied from 133 – 208 NTU. The mean value obtained for turbidity was 168 ± 14.9 NTU. The values recorded for turbidity in this study were higher than the WHO value of 10 NTU for drinking water and for other domestic use. Turbidity is the extent to which a water body is clear or opaque. The values recorded for turbidity in this research was found to be higher in value than those reported by Edori and Nna (2018) in the New Calabar; and that obtained by Yapo et al., (2012) in a river in Abidjan City and Edori et al. (2022) from Whuo stream in Rivers. This could be attributed to the discharge of waste and urban run-off which creates large number of organic materials and hence increased the turbidity of River Challawa according to Indabawa (2010). Kinuthia et al. (2020) also reported turbidity levels between 160.33 – 544.67NTU in a study from open drainage channels in Kenya which indicates the presence of suspended solids in the water bodies. The level in which particles are suspended or dissolved in any given aquatic system contributes to the high turbidity of that aquatic environment. The high values of turbidity observed from the river might have originated from high level of chemicals and effluents discharged into the river through drainages from Challawa Industrial Area. High turbidity levels in a water body hinders the effective penetration of light into greater depth and hampers the photosynthetic activities and destroys or decreases normal aquatic life and upsets the value and appearance of surface water (Gupta and Singh, 2011). The level in which microorganisms, phytoplankton and zooplankton occur in the aquatic system increases the level of water turbidity (Edori & Kpee, 2016; Edori & Nna, 2018; Edori et al., 2022).
Results of DO from this study were lower than the WHO (2018) recommended limits of at least 5mg/L in water. A study by Odiba (2017) also shows DO of 3.9 mg/L in wet season which increase to 4.7 mg/L in dry season. A study by Ewim et al. (2022) also showed values similar to the present study (3.70 – 7.60 mg/L). The lower values could be attributed to breakdown of organic matter by aerobic microbes. This agreed with the research findings of Dike et al. (2013) in River Jakara and Oniye et al. (2002) in Zaria dam. The highest dissolved oxygen concentration was observed in January which coincided with lower surface water temperature. This observation could be attributed to the seasonal changes in air temperature resulting from the North-East trade winds (Harmattan) which is typical of the season. These findings are in agreement with the Devangee et al. (2013), Magami et al. (2014) and Jabbi (2018) in their studies on Kankariya, Vastrapur, Malav, and Chandola Lake, India, Shagari and Yardantsi Reservoirs respectively. Meays and Nordin (2013) reported that the important factors that control the dynamics in surface water dissolved oxygen concentration include; temperature, atmospheric pressure, photosynthetic activities of algae, cyanobacteria and aquatic macrophytes. The highest dissolved oxygen concentrations recorded in January coincided with minimum temperature observed. Increase in DO compared with the high temperature recorded in this study show that the site with low values of DO have high values of temperature (28.26 ºC) which is in line with the findings of Akinbile and Yusoff (2011); Ewim et al., (2022). Low dissolved oxygen in effluent when discharged into rivers has adverse effects on aquatic biota as less oxygen will be available for aquatic life as reported by Shaibu and Audu (2018).
BOD values ranged from 22.5 mg/L in May to 39.77 mg/L in August with a mean value of 27.69 ± 0.26 mg/L. The high values could be attributed to presence of organic waste in the environment which initiates various microbial activities, hence creating high biochemical oxygen demand (Dike et al., 2013). Similar observations were made by Akan et al. (2013) in Jakara waste water, Indabawa (2010), Dike et al. (2013) in River Jakara and Safana (2018) in River Ginzo. Biodegradation activities initiated by microorganisms that often increases biochemical oxygen demand decreases dissolved oxygen, hence the negative correlation (Dike et al., 2013). The highest value recorded was during the wet season (39.77 mg/L) while the lowest value recorded was 22.5 mg/L during the dry season. This finding is supported by Essien-Ibok et al. (2010) in Mbo River; due to the increased input of organic matter into waste channels.
Nitrate ranged between 9.89 mg/L and 25.39 mg/L with a mean value of 15.40 ± 4.35 mg/L. The mean value obtained was higher than the 10 mg/L accepted for nitrates in water for drinking and other domestic purposes by WHO. The reason could be due to excessive influx of farmlands where fertilizers are used to boost up crop production according to Safana (2018). The level of nitrates recorded in this investigation were higher than those reported by Etim et al. (2013) in the Qua Iboe River in Akwa Ibom, and Sikoki and Anyanwu (2013) in Onu-Iyi-Ukwu Stream in Niger Delta, Nigeria. Low level of dissolved oxygen decreases the efficient conversion of ammonia to nitrite and then to nitrate, that leads to an increased level and quantity of ammonia and nitrite in the aquatic systems, and thereafter producing higher level toxicity to the water environment (Suthar et al., 2009).
The values of Phosphate ranged between 2.31 mg/L (October) and 5.73 mg/L (December) with the mean value found at 3.67 ± 0.58 mg/L. The mean value is within the WHO safe limit of 5mg/L for phosphate in water. This also coincides with findings of Shaibu and Audu (2019) from tannery effluents of Challawa industrial area. Highest concentration obtained was in the dry season while the lowest was in the wet season. This could be as a result of decrease in water volume, intensive agricultural activities and use of pesticides to dry season crops around the river according to Ibrahim (2009).
The concentration of heavy metals (Cadmium, Chromium, Copper, Lead, Manganese and nickel) in the four (4) sampling sites varied in terms of water, sediment, and mussels. Site B had the highest concentration of heavy metals in water, sediment and mussels. This could probably be as a result of lots of human activities and being an effluent discharge point. Therefore, it receives more pollutants as agreed by the finding of Sani et al. (2022) from River Challawa and Ibrahim and Sa’id (2010) who observed the Jakara River to be more contaminated than Kusalla dam. Lower levels of heavy metals were observed in site A (upstream) in water, sediment and mussels where human activities are less. There is also high concentration of metals in site C which also receives effluent from the Challawa industrial area. This could also probably be due human activities such irrigation, improper waste discharge and disposal, use of fertilizers and pesticides etc), and flow of effluent from site B which agrees with the findings of Sani et al. (2022).
The levels of heavy metals revealed monthly variations. These variations in concentrations resulted from changes in seasonal temperature, runoff levels, and level of water in the river as reported by Akan et al. (2009) and Sani et al. (2022). Higher mean level of metals in water, sediment, and mussels were recorded during dry season and lowest mean value recorded was in wet season. However, the variations were not significant. This is in agreement with the outcome of a study by Sani et al. (2022) and Aladesanmi et al. (2014) in the assessment of metals in fish, water, and sediment in River Challawa and Osun state respectively. This is as a result of higher temperatures with elevated activities in metabolic rate, ventilation and feeding regimes in the dry season (Nussey et al. 2000). The lower concentrations during wet season were due to metal dilution associated with heavy rains (Obasohan and Eguavoen, 2008).
The order of heavy metals levels observed in water and mussels were in the sequence of site B > site C > site D > site A while that of sediment is in the sequence site B > site C > site A > site D. The variation in the magnitude of contamination might be due to contamination level of the areas as reported by Ibrahim and Sa’id (2010).
Pearson correlation analysis of the levels of heavy metals in the different samples (water, sediment and mussels) revealed a positive relationship between heavy metals in water and mussels, and between sediment and mussels (p < 0.05). All correlation coefficients were positive and this implies that an increase in the level of metal in water causes a corresponding increase in its level in mussels and vice versa. The same pattern applies for metals in sediment and mussels. The findings from the current study were in conformity with the finding of Sani et al. (2022) and Karlsson et al. (2012) which states that an increase in concentration of an abiotic factor affects the concentration in biotic factor.
Oxidative Stress Biomarkers
The activity of SOD was elevated across all sites with the highest level at site B (23.10 u/mol). This could be as a result of heavy metals in all sites with site B having the highest concentration. The accumulation of heavy metals might have triggered the production of superoxide anions. This results to the induction of SOD whose primary role is to accelerate the dismutation of the toxic superoxide radical (O2-) produced during oxidative processes to Hydrogen peroxide and Oxygen. This is in agreement to the findings of Musa and Imam (2021). Biochemically, the first and the most effective antioxidant enzyme that acts against the free radical formation process is SOD (Ighodaro and Akinloye, 2018; Yang et al., 2019). The significant increase in SOD values in this study may be a response of the first defense system to ROS induced by xenobiotics in the tested water as indicated by Ighodaro and Akinloye (2018), Sedeno-Diaz and Lopez-Lopez (2022).
Similarly, the nutrients from agricultural runoff imply the presence of other agrochemicals, their metabolites, and byproducts could also form potential ROS. These results are in agreement with Castañeda-Chávez and Lango-Reynoso (2021), Sedeno-Diaz and Lopez-Lopez (2022).
Levels of CAT recorded in mussels from River Challawa had the highest mean of 39.78 u/ml in site B, while the lowest mean of 5.26 u/ml was reported in site A. This could be as a result of higher levels of pollutants in the site, which contributed to higher levels of SOD, therefore, resulting to higher level of CAT. Activities of CAT and SOD are two indicators of oxidative stress. There is usually a rise of ROS and reactive metabolites as a result of the interactions between different enzyme systems, including detoxifying enzymes (Akinsanya et al., 2020). CAT degrades hydrogen peroxide that SOD produces by the dismutation of superoxide ion in periods of prolonged stress (Batista et al., 2014). According to Akinsanya et al. (2020), increased CAT activity can prevent the potential toxicity of free radicals which consequently may protect the mussels from oxidative damage.
Levels of GSH in mussels from River Challawa ranged from 3.45 μg/ml in site A to 21.45 μg/ml in site B. GSH showed an elevated level in all the sites and GSH is well understood to be a substrate for the activity of GST. The increase recorded in GSH formation in a high level suggests an adaptation and protective mechanism by this biomolecule against oxidative stress induced by heavy metal and pesticide residues which agrees with the findings of Musa and Imam (2021) and Farombi et al. (2007).
Comet Assay
The genotoxicity detected at the sampling sites of River Challawa could be attributed to the presence of heavy metals in effluents discharged from the Industrial Area and Kano city. The DNA damage due to heavy metals is related to mutations brought about by metals in living cells as they form strong covalent bonds with the DNA resulting in the formation of DNA adducts that prevent replication of DNA and leads to DNA damage as reported by Khan et al. (2018). According to Fathallah et al. (2019), heavy metals have a tendency to bind to phosphates and a wide variety of organic molecules, including base residues of DNA, which can lead to mutations by altering primary and secondary structures of the DNA. In addition, exposure to such anthropogenic chemicals can have mutagenic and carcinogenic effects, often inducing cancerous diseases. Fathallah et al. (2019) also recorded moderate DNA damages in clams exposed to heavy metals from Monastir lagoon and Hergla water which were higher than those reported in this research with TDNAs of 63.85 and 42.16 % respectively. Sani and Abdullah (2016) also reported varying degrees of DNA damage in hemocytes of metal workers in Kano; this was attributed to the presence of metals such as Chromium, Nickel, Cadmium, Manganese, Lead and Cobalt in welding fumes. Nwani et al. (2013) reported varying degrees of DNA damage in fish exposed to glyphosate at different concentrations. Genotoxicity assessment using comet assay on hemocytes and gill cells of Corbicula fluminea on its exposure to gasoline was carried out and results revealed significant DNA damage in hemocytes and gill cells as reported by Fedato et al. (2010).
Ames assay revealed that the wastewater contains various frame-shift and base-pair mutagens detected by the bacterial strains TA98 and TA100 respectively. Mutagenic activities expressed as Mutagenic Index using the TA98 strains in Sites B (8.79 ± 2.48) and C (6.69 ± 1.18) were greater than 2.0 while those of sites A (1.95 ± 0.50) and D (0.09 ± 0.25) were less than 2.0 (table 3). Mutagenic indices using TA100 in stations A (2.67 ± 0.68), B (13.8 ± 3.94) and C (10.37 ± 2.12) were also greater than 2.0 while that of Site A (0.05 ± 0.19) was less than 2.0 as shown in table 3. The samples produced responses that were twice as high as that of negative controls which indicates potential mutagenicity. These site-specific differences observed in the different strains could be as a result of presence of different xenobiotics from the industrial effluents such as metals, pesticides, microplastics etc which drains into River Challawa at sites B and C whose values were higher. This coincides with the reports of Liu et al. (2015) as well as those of Nagendran (2010) in surface waters of Madurai district, Anjum et al. (2012) in soil irrigated with wastewater, Villela et al (2013) from a study of wastewater in Brazil and Zeyad et al. (2019) in pesticide industry wastewater. In research conducted by Atasov et al. (2012) in effluents of three hospitals, all samples indicated significant mutagenic potentials in vitro. However, Iji et al (2021) reported that neither TA98 and TA100 were able to produce a response twice as high as those of negative control in samples impacted by acid mine drainage in South Africa. Bhargavi et al (2019) also reported no response of TA98 and TA100 in different doses of pesticide mixtures.
TA100 bacterial strain was observed to be more sensitive which indicates the presence of base-pair mutagens, while TA98 was less sensitive which indicates less frame-shift mutagens. Differences in mutagenic index between TA98 and TA100 were significant (p>0.05). Findings of Villela et al (2013), Zeyad et al. (2019), Zeyad et al. (2022) and Khan et al. (2022) (MI- 15.42) contradicted those reported in this study while Alabi et al. (2014a) and Alabi et al (2014b) in soil leachate and tobacco industry wastewater reported similar findings.
The genotoxic potential of a river basin under the impact of agricultural, urban and industrial activities influence of climatic variation was investigated using different strains of Salmonella. The upper river basin showed low pollution level mainly from small farming activities. Higher mutagenic responses were indicated at Sinos river in the middle and lower reaches, influenced by large discharge from domestic sewers and industries as reported by Lemos et al. (2009). This agrees with the findings of this research.
Mutagenicity reported was dose-dependent in both strains with higher mutagenic index occurring in the highest concentration of test sample (TA98- 4.89, TA100- 7.18). The differences were however not statistically significant (p>0.05). Findings of Villela et al (2013) in wastewater, Alabi et al. (2014a) in Indomie noodles seasoning and Zeyad et al. (2019) in pesticide industry wastewater all agreed with these finding.
CONCLUSION
The physico-chemical analysis of wastewater revealed numerous genotoxic substances in the form of organic and inorganic pollutants which are directly or indirectly harmful to the ecosystem and human health. Similarly, as a result of pollutants and their accumulation in the tissues of mussels, the oxidative stress biomarkers showed a considerable level of antioxidant activity. Bacterial reverse mutation assay demonstrated that the wastewater showed mutagenicity by reverting the Salmonella tester strains (TA98 and TA100). Strain TA100 showed highest response in the terms of mutagenic index as well as mutagenic potential which indicates the presence of base-pair mutagens. Furthermore, the wastewater also induced damage in the DNA in comet assay. The findings thus showed that the combination of physico-chemical analysis along with the toxicity assessment (using bioassays) would provide valuable and more realistic information about the joint toxicity of chemical pollutants present in industrial effluents. As evident by these assays, it is recommended that the effluents from the industries should be treated appropriately to minimize the presence of the genotoxic compounds before discharging into the river.
Conflict of Interest
The authors have declared no conflicts of interest with respect to the authorship of this article.
REFERENCES
- Akan J. C., Abdulrahman, F. I., Ayodele, J.T. & Ogugbuaja, V.O. (2009). Impact of Tannery and Textile Effluent on the Chemical Characteristics of Challawa River, Kano State, Nigeria. EJEAFChe, 8(10): 1008-1032.
- Alabi, A.O., Esan, E.B., Odunukan, O.C., and Shokunbi, O.S. (2014). Assessment of the mutagenic and genotoxic potential of indomie noodle seasoning using bacterial (Salmonella) reverse mutation and SOS Chromo tests. Journal of Innovative Biology, 1(4), 210-214.
- Ali M.M., Ali M.L., Islam M.S. and Rahman M.Z. (2016). Preliminary Assessment of Heavy Metals in Water and Sediment of Karnaphuli River, Bangladesh. Environment Nanotechnology Monitoring Management,5: 27.
- Alsbou E.M.E. and Al-Khashman O.A. (2018). Heavy Metal Concentrations in Roadside Soil and Street Dust from Petra Region, Jordan. Environmental Monitoring Assessment 190(1): 48.
- Bhargavi, B.R., Vellanki, R.K. & Kanallah, J.R. (2019). Evaluation of certain Pesticide mixtures for their Mutagenicity using Ames Salmonella typhimurium – Reverse Mutation Assay. Journal of Experimental Biology and Agricultural Science, 7(6), 606-612
- Bhateria, R., & Jain, D. (2016). Water quality assessment of lake water: a review. Sustainable Water Resources Management, 2(2), 161-173. DOI: 10.1007/s40899-015-0014-7
- Borsuk, G., Ptaszyńska, A. A., Olszewski, K., Domaciuk, M., Krutmuang, P., & Paleolog, J. (2017). A new method for quick and easy hemolymph collection from Apidae adults. PLOS ONE, 12(1). https://doi.org/10.1371/journal.pone.0170487
- Dike, N.I., Ezealor, A.U., Oniye, S.J. and Ajibola, V.O. (2013). Pollution studies of River Jakara in Kano, Nigeria using selected physico-chemical parameters. International Journal of Research in Environmental Science and Technology, 3(4): 122-129.
- Edokpayi, J. N., Odiyo, J. O., & Durowoju, O. S. (2017). Impact of wastewater on surface water quality in developing countries: A case study of south africa. Water Quality. https://doi.org/10.5772/66561
- Farrington J.W., Tripp B.W., Tanabe S., Subramanian A., Sericano J.L., Wade T.L., Knap A.H. and Edward D. (2016). Goldberg’s Proposal of “the Mussel Watch”: Reflections After 40 Years. Marine Pollution Bulletin. 110: 501-510.
- Fernandez-Maestre R., Johnson-Restrepo B. and Olivero-Verbel J. (2018). Heavy Metals in Sediments and Fish in the Caribbean Coast of Colombia: Assessing the Environmental Risk. International Journal of Environment Research, 1(2018): 8.
- Gupta S.K. and Singh J. (2011). Evaluation of Mollusc As Sensitive Indicator of Heavy Metal Pollution in Aquatic System: A Review. Institute of Integrative Omics and Applied Biotechnology Journal, 2: 49-57.
- Khan, B., Ho, K., & Burgess, R. (2020). Application of Biomarker Tools Using Bivalve Models Toward the Development of Adverse Outcome Pathways for Contaminants of Emerging Concern. Environmental Toxicology And Chemistry, 39(8), 1472-1484. DOI: 10.1002/etc.4757
- Khan, S., Anas, M., & Malik, A. (2019). Mutagenicity and genotoxicity evaluation of textile industry wastewater using bacterial and plant bioassays. Toxicology Reports, 6, 193–201. https://doi.org/10.1016/j.toxrep.2019.02.002
- Kinuthia, G.K., Ngure, V., Beti, D.et al. Levels of heavy metals in wastewater and soil samples from open drainage channels in Nairobi, Kenya: community health implication. Sci Rep 10, 8434 (2020). https://doi.org/10.1038/s41598-020-65359-5
- Krishnakumar, P., Qurban, M., & Sasikumar, G. (2018). Biomonitoring of Trace Metals in the Coastal Waters Using Bivalve Molluscs. Trace Elements – Human Health And Environment. DOI: 10.5772/intechopen.76938
- Malami, D., Zakaria, Z., Mohammed, M., & Audu, A. (2014). Comparison of levels of some metals in the water and sediment from Challawa Gorge Dam, kano, nigeria. Bayero Journal of Pure and Applied Sciences, 7(1), 80. https://doi.org/10.4314/bajopas.v7i1.15
- Rajeshkumar S. and Li X (2018). Bioaccumulation of Heavy Metals In Fish Species From The Meiliang Bay, Taihu Lake, China. Toxicology Report. 5: 288.
- Saeed MD, Mahmoud AM (2014) Determination of some Physicochemical Parameters and some Heavy Metals in Boreholes from Fagge LGA of Kano Metropolis Kano State -Nigeria. World Journal of Analytical Chemistry 2(2): 42-46.
- Sani, A., Idris, K. M., Abdullahi, B. A., & Darma, A. I. (2022). Bioaccumulation and health risks of some heavy metals in Oreochromis niloticus, sediment and water of Challawa River, Kano, Northwestern Nigeria. Environmental Advances, 7, 100172. https://doi.org/10.1016/j.envadv.2022.100172
- Uddin, A.H., Khalid, R.S., Alaama, M., Abdualkadir, A.M., Kasmuri, A. & Abbas, S.A. (2016). Comparative study of three digestion methods for elemental analysis in traditional medicine products using atomic absorption spectrometry. Journal of Analytical Science Technology7, (6) https://doi.org/10.1186/s40543-016-0085-6
- Udiba, U., Oko, O. M. & Anyim, B. P. (2018). Heavy Metals Profile of Challawa River Basin around Challawa Industrial layout, Kano and its Implications for Cultivated Vegetables. Sumerianz journal of scientific Research, 1 (1), 8-15.
- Ullah, S., Begum, M., Dhama, K., Ahmad, S., Hassan, S. and Alam, I., 2016b. Malathion induced DNA damage in freshwater fish, Labeo rohita (Hamilton, 1822) using alkaline single cell gel electrophoresis. Asian Journal of Animal and Veterinary Advances, 11(2), 98-105.
- Uzairu, A., Okunola, O. J., Wakawa, R. J., & Adewusi, S. G. (2014). Bioavailability studies of metals in surface water of River Challawa, Nigeria. Journal of Applied Chemistry, 2014, 1–9. https://doi.org/10.1155/2014/648453
- Sani, A., Gaya, M.B. and Abubakar, F.A. (2016) “Determination of some heavy metals in selected cosmetic products sold in Kano Metropolis, Nigeria,” Toxicology Reports, 3, 866–869. Available at: https://doi.org/10.1016/j.toxrep.2016.11.001.
- Sani, A., Idris, K. M., Abdullahi, B. A., & Darma, A. I. (2022). Bioaccumulation and health risks of some heavy metals in Oreochromis niloticus, sediment and water of Challawa River, Kano, Northwestern Nigeria. Environmental Advances, 7, 100172. https://doi.org/10.1016/j.envadv.2022.100172
- Shaibu, A.N. and Audu, A.A. (2020) “Evaluation of physiochemical parameters and some heavy metals from tannery effluents of Sharada and Challawa Industrial Areas of Kano State, Nigeria,” Nigerian Journal of Basic and Applied Sciences, 27(2), 162–171. Available at: https://doi.org/10.4314/njbas.v27i2.22.
- Rajput, S., Kaur, T., Arora, S., & Kaur, R. (2019). Heavy Metal Concentration and mutagenic assessment of pond water samples:A case study from India. Polish Journal of Environmental Studies, 29(1), 789–798. https://doi.org/10.15244/pjoes/103449
- Khan MI, Khisroon M, Khan A (2018). Bioaccumulation of Heavy Metals in Water, Sediments, and Tissues and Their Histopathological Effects on Anodonta cygnea (Linea, 1876) in Kabul River, Khyber Pakhtunkhwa, Pakistan. BioMedical Research International; 2018: 1-10.
- Indabawa, I.I. (2012): Bioinstrumentation Lecture Note for Postgraduate Students, Bayero University Kano.
- Ali, H., Khan, E. and Ilahi, I. (2019) “Environmental chemistry and ecotoxicology of hazardous heavy metals: Environmental persistence, toxicity, and bioaccumulation,” Journal of Chemistry, 2019, 1–14. Available at: https://doi.org/10.1155/2019/6730305
- WHO (World Health Organisation) (2008). Guidelines for Drinking-water Quality, 3rd ed., 1. Geneva, p. 1459. 2nd ed