
Exploring Lifestyle Patterns for Consumption Behavior of Sri Lankan Households
- Dr. K.A.K. Gnanaweera
- 402-414
- Jul 13, 2024
- Economics
Exploring Lifestyle Patterns for Consumption Behavior of Sri Lankan Households
Dr. K.A.K. Gnanaweera
Senior Lecturer / Coordinator- Management Science Unit
Faculty of Applied Sciences, University of Sri Jayewardenepura, Sri Lanka
DOI: https://doi.org/10.51244/IJRSI.2024.1106032
Received: 24 May 2024; Revised: 06 June 2024; Accepted: 13 June 2024; Published: 13 July 2024
ABSTRACT
The purpose of the study is to assess qualitatively household income levels and their relationship with lifestyle patterns from a Sri Lankan perspective. This descriptive study intends to explore household consumption patterns and their significant relationship with social, economic, and environmental concerns. For data gathering, online questionnaires were simultaneously distributed among different household segments in Sri Lanka to determine Sri Lankan household consumption patterns and perceptions. The sample of the study consisted of 136 families belonging to middle-class and high-middle-class entities that were taken into the study to assess contingency among total household income level and head of household age, contingency between family income, and the preferred location to buy food Items, the households’ major shift from their ordinary expenditure pattern when there is a change in major economic factors, and the households’ major shift from their ordinary expenditure pattern when there is an environmental change in the economy. The findings show that age could not be the reason for getting a high or low salary, and other factors like demographics and education can be counted as this reason. The findings further illustrate that different income levels wish to select different locations to purchase food items. Furthermore, different outcomes in the general environment; inflation and COVID-19, made householders alter their expenditure patterns significantly. Every household is ready to give up traveling for leisure during pandemics and inflation. However, the findings explored that only a few were ready to give up education and investment plans.
Key Words: Household, Consumption pattern, Economic, Environmental, Middle-class
INTRODUCTION
Beginning of the 21st century, with the rise of capitalism in developed nations, many citizens from different nations have to adjust their lifestyles for many dynamisms in the economies, political, environmental, and technological. For instance, some households (a group of persons normally living together and taking food from a common kitchen constitutes a household) have had to follow political and economic conditions; in Chinese capitalism, some may have fully liberal conditions; and freedom of speech, while devising lifestyle changes according to fluctuations in internal and external aspects in the environment and economy. significant contingency among total household income level and head of household age. Further, Agarwala and Drinkwater (1972) mention that considerable socio-economic factors (married female participation in the labor force, education composition, age composition, and degree of urbanization) are considered to influence expenditure patterns too. Further, an individual’s average labor wages and consumption at each age, influenced by institutions, society, biology, and personal preference, may summarize their economic behavior over the course of their life (Lee et al., 2006).
Purpose of the Study
According to the aforementioned information, developing nations in South Asia, Sri Lanka, India, Pakistan, etc., also have different lifestyle patterns according to household income and consumption levels. Therefore, the study aims to subjectively evaluate household income levels and their relationship with lifestyle patterns from a Sri Lankan perspective. Because Sri Lankan lifestyle pattern has diverged for many reasons; family income, relative prices of goods and services, and the household’s unique set of needs or preferences.
Research Objectives
The following objectives have been developed to illustrate the real condition of Sri Lankan communities’ consumption patterns, their relationship with income level, and other main concerns like environmental and economic changes.
- According to Campbell and Mankiw (1990), Flavin (1981) reported that consumption is “excessively sensitive” to income. Hence, from the Sri Lankan perspective, is there any significant relationship between income level and consumption pattern?
- The Keynesian view that a country’s aggregate saving rate is driven by its total level of income (Sablic, 2016). Even though money income is considered to be the major determinant of consumption, what other factors of lifestyle behavior are to be considered to have a significant relationship with consumption patterns?
- Panic and illness—pandemics or price disparities in the economy—can strangle production, consumption, and overall well-being (Evans, 2020). Therefore, Sri Lankan households’ consumption patterns can affect environmental and economic change.
This study is organized as follows. The next section, Literature Review, presents some empirical evidence on consumer consumption patterns and income level relationships and some hypotheses related to income and consumption theories. The next section, Methods and Proposition Development, presents the study’s method and proposition to assess. Then, before the study’s conclusion, the next section elaborates on the analysis and discussion. Finally, brief concluding remarks are provided in the last section.
Theoretical Background
Human plunder and the ruin of nature are closely associated with consumption patterns (Tu et al., 2013). Therefore, for decades, economists have shown interest in lifestyles and their relationship with changing the focus on never-before-adapted consumption patterns. Tu et al. (2013) further indicate that the purpose of consumption is to satisfy needs; however, in a society of capitalism, to sell more products, but result could be the unnecessary consumption patterns. Further, Mustapha, Rashid, and Nasir (2011) state that the spending behavior of a society -Malaysians- significantly impacts the economic condition. But Mustapha et al. (2011) elaborate further that one of the factors influencing the above phenomenon is the income level in the society which is the main factor that determines individual consumption spending. Saving rates and consumption levels worldwide could vary widely due to factors such as inflation, production capacity, the nation’s cultural aspects, and environmental conditions. For instance, regional differences in saving behavior in the world have been rising, which is likely to drive saving away from socially desirable levels (Loayza et al., 2000), based on, in practice, a host of externalities, market failures, and policy-induced falsifications. However, All economic activity takes place in the physical world and requires resources like energy, materials, and land, whether it be cybernetic or tangible.
The saving rates in other developing countries and regions stagnated or declined (Loayza, 2000). There are such large differences in income across countries too; for example, the United States or Canada are more than 30 times as rich as others such as Mali or Uganda (Acemoglu and Ventura, 2002), further, the distribution of income has not changed much over this period. Hence, lifestyle patterns could vary due to this reason. For instance, rich households tend to be homeowners, and poor households tend to be renters. But other concerns are also significant for owning a house, e.g. a fraction of rich households are renters (Yang, 2009). This could be a reason for the lack of farsightedness of the head of the household; being reactive rather than proactive in different circumstances, or the consumption pattern of the household; a desire to buy branded items to lack control overeating outside.
METHOD AND RESEARCH PROPOSITION
The study design, using a qualitative approach, is a descriptive study with the intention of further exploring household consumption patterns and their significant relationship with social, economic, and environmental concerns. For data gathering, online questionnaires in English with the same contents were simultaneously distributed among different household segments in Sri Lanka.
This research used a structured questionnaire as a survey instrument to determine Sri Lankan household consumption patterns and perceptions. The sample of the study consisted of 136 families belonging to middle-class and high-middle-class entities were taken into the study to assess were taken into the study to assess the following research propositions:
- PROPOSITION 1: There is significant contingency among total household income level and head of household age.
- PROPOSITION 2: There is significant contingency between family income and the preferred location to buy food Items.
- PROPOSITION 3: The household would shift significantly from its ordinary expenditure pattern when major economic factors change, such as inflation (an extreme rise in prices), even though it has a positive attitude towards planning.
- PROPOSITION 4: The household would take a major shift from their ordinary expenditure pattern when there is an environmental change in the economy; panic towards health impacts even though there is a positive attitude towards planning.
ANALYSIS AND DISCUSSION
The analysis of the study has been divided into two sections to elaborate on the main aspects of the research objectives. The first section will elaborate on the descriptive data to identify the characteristics of the sample. Then, the next section elaborates on the supporting evidence associated with propositions to support or deny the fact: point out differences and relationships, and provide information about them. This study deliberately, depending on the qualitative phase- presents results in tables and figures to describe the outcome of the questionnaire and to match the accomplished facts, support or not, propositions.
The following information in the figures elaborates on selected characteristics of the sample (136 family households). Figure 1 represents the family sizes of the sample and it is quite illustrative that half the sample represents four to five-member families (4: 72 and 5: 31). Then Figure 2 represents the gender of the head of household:
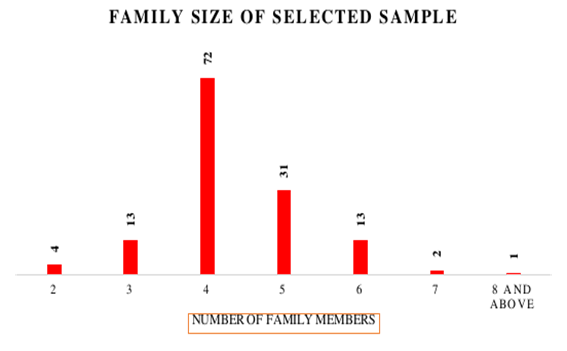
Fig. 1: The family size of the selected sample
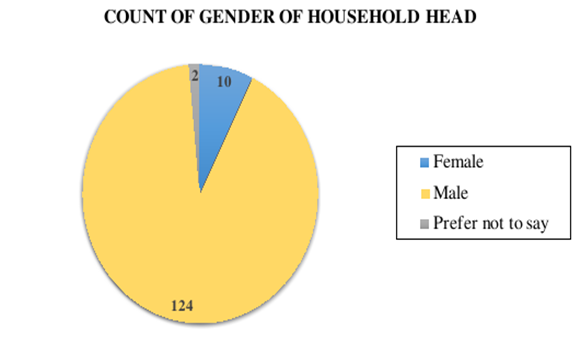
Fig. 2: The gender of the head of the household
Figure 3 illustrates the age category of the head of household. Based on sample responses, most of the household heads (87) belong to the 50 to 59 age category, and 32 heads of households belong to the 60 to 69 age category.
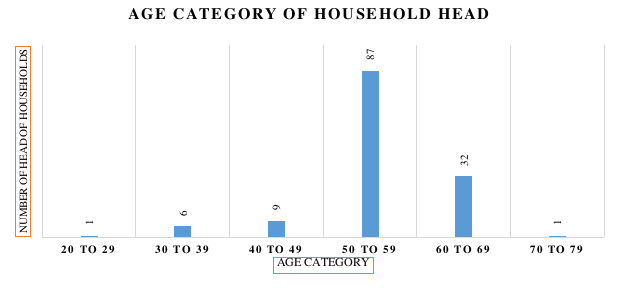
Fig. 3: Age category of the Head of Households
Figure 4 represents critical information to depict the study’s main purpose in halfway; income mode for each family household. It is usual to receive the highest mode of income as a Salary- cheque mode (81) compared to other modes of income like entrepreneurship or financial investments. However, according to the figure, there are families (8) that depend on Financial Investment/Securities/Deposits rather than ordinary income- salary. Further, the agriculture activities also represent 12, and indirect businesses – on a monthly basis can be seen as 23 modes. The income level of a private company is disclosed around Rs. 61,000, and renting a house also counts in the sample; their income is around 121,000 to 150,000 rupees.
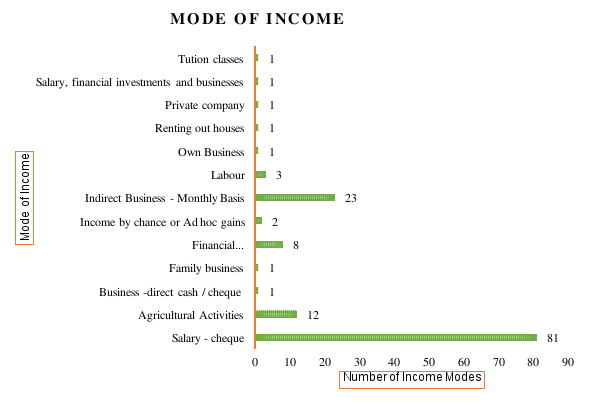
Fig. 4: Mode of Income
Then, finally, the following figure (5) represents the information on the income category for the mode of income. The figure depicts that there are a higher number of households belonging to Rs. 41,000 to 60,000 (26) and Rs. 61,000 to 80,000 (28) categories. Further, the information in the figure shows there are 9 households are income generated less than Rs 20,000. Less than Rs. 20,000 income category comes from agricultural activities, income by chance or ad-hoc gains, labor work, and indirect businesses. In contrast, income classification from Rs. 101,000 to 200,000 belongs to salary –cheques, indirect businesses (1), financial investments (1), and renting houses (1). Further, above Rs. 250,000 income generators per month belong to salary –cheque and financial investments (1).
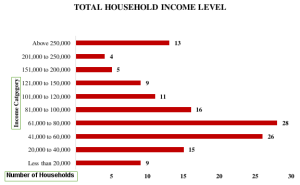
Fig. 5: Mode of Income
The following explanation related to the proposition assessment according to the major elements selected from the particular questionnaire. Therefore, this section will explain each proposition declared in the research to support the purposes of the study, with sufficient evidence from the selected data.
1. PROPOSITION 1: There is significant contingency among total household income level and head of household age.
The following table (01) shows that most of the household heads belonging to the age category “50 to 59” have higher income per month but the age category “60 to 69” shows, comparatively, a low salary combination on a monthly basis except one person in the category of 126,000 rupees to 150,000 rupees. Besides, the age category “30 to 39” has two households whose monthly income belongs to the category of “above Rs. 250,000”. Still, this category shows less income salary generation compared with “50-59” category. Even though, the age between 60 to 69 shows mixed results on an income basis, still, in that category household heads have more salary income compared to the “30 to 39” and “40 to 49” categories. Therefore, proposition 01 can be accepted according to the data that have been disclosed in this study. Still, age could not be the reason for getting a high or low salary other factors like demographics and education can be counted to this reason.
Table 1: Relationship between Age of Household Head and their Income level
| Age of Household Head | Head of Household’s Monthly Income |
| 20 to 29 | 51,000 – 65,000 |
| 30 to 39 | Above 250,000 |
| 30 to 39 | 36.000 – 50,000 |
| 30 to 39 | 51,000 – 65,000 |
| 30 to 39 | 65,000 – 80,000 |
| 30 to 39 | 36.000 – 50,000 |
| 30 to 39 | Above 250,000 |
| 40 to 49 | 51,000 – 65,000 |
| 40 to 49 | 20,000 – 35,000 |
| 40 to 49 | 20,000 – 35,000 |
| 40 to 49 | 51,000 – 65,000 |
| 40 to 49 | 65,000 – 80,000 |
| 40 to 49 | 65,000 – 80,000 |
| 40 to 49 | 101,000 – 125,000 |
| 40 to 49 | 126,000 – 150,000 |
| 40 to 49 | 86,000 – 100,000 |
| 50 to 59 | 101,000 – 125,000 |
| 50 to 59 | 201,000 – 250,000 |
| 50 to 59 | 101,000 – 125,000 |
| 50 to 59 | 151,000 – 200,000 |
| 50 to 59 | 201,000 – 250,000 |
| 50 to 59 | 126,000 – 150,000 |
| 50 to 59 | 101,000 – 125,000 |
| 50 to 59 | Above 250,000 |
| 50 to 59 | 101,000 – 125,000 |
| 50 to 59 | Above 250,000 |
| 50 to 59 | 201,000 – 250,000 |
| 50 to 59 | 201,000 – 250,000 |
| 50 to 59 | Above 250,000 |
| 50 to 59 | 151,000 – 200,000 |
| 50 to 59 | 126,000 – 150,000 |
| 50 to 59 | 101,000 – 125,000 |
| 50 to 59 | 126,000 – 150,000 |
| 50 to 59 | 101,000 – 125,000 |
| 50 to 59 | Above 250,000 |
| 50 to 59 | 201,000 – 250,000 |
| 50 to 59 | 126,000 – 150,000 |
| 50 to 59 | 201,000 – 250,000 |
| 60 to 69 | 36.000 – 50,000 |
| 60 to 69 | 51,000 – 65,000 |
| 60 to 69 | 65,000 – 80,000 |
| 60 to 69 | 65,000 – 80,000 |
| 60 to 69 | 126,000 – 150,000 |
| 60 to 69 | 36.000 – 50,000 |
| 60 to 69 | 51,000 – 65,000 |
| 60 to 69 | 20,000 – 35,000 |
| 60 to 69 | 86,000 – 100,000 |
| 60 to 69 | 36.000 – 50,000 |
| 70 to 79 | 20,000 – 35,000 |
2. PROPOSITION 2: There is significant contingency between family income and the preferred location to buy food Items.
Consumption patterns cannot be limited to just consuming, and they have to relate to the way households buy their groceries in different locations. Hence, Proposition 2 elaborates on whether there is any major difference between the household’s income and location preferences in purchasing essential goods and services. Accordingly, figure 6 shows income level between “61,000 to 80,000” has significant interest in retail shops near local residences, similar to “41,000 to 60,000”. Comparatively, income categories from “101,000 to 200,000” do not show much attention to buying their products and services from local retail shops. Similarly, figure 7 shows that the “101,000 to 120,000” category is not interested in buying their products from Sunday fairs. Moreover, figure 8 proves that householders who have earnings in good figures, e.g., more than Rs. 60,000 to above 250,000, they substantially interested in purchasing their essential items from supercenters. Therefore, proposition 02 has to accept this condition. Because higher-income generated households could have items like transportation and credit card payment facilities, they prefer to travel and make purchases from idle places when they have much demand power.
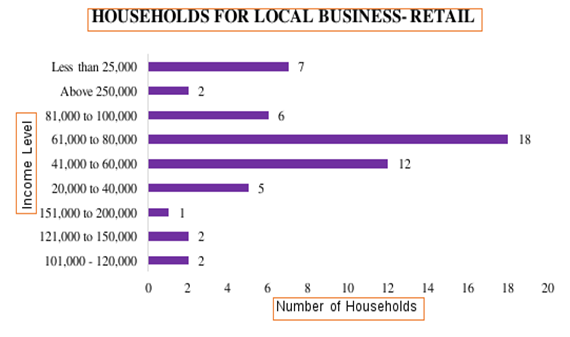
Fig. 6: Relationship between Income Level and Retail Shop Preferences
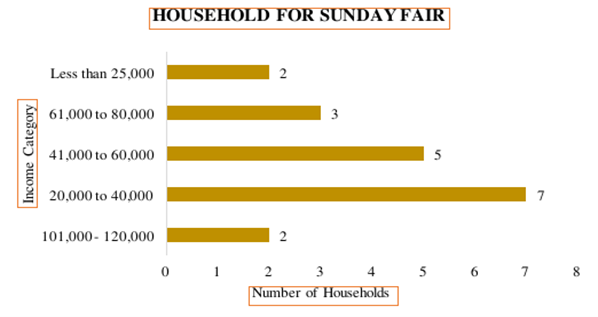
Fig. 7: Relationship between Income Level and Sunday-Fair Preferences
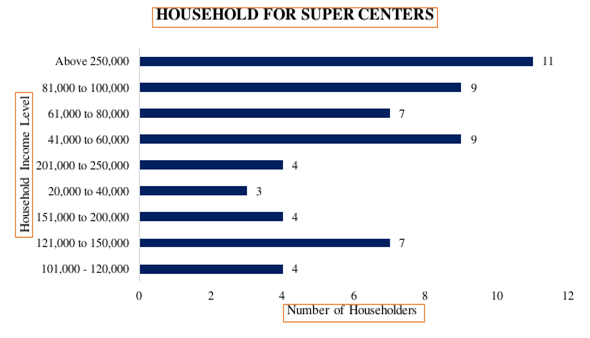
Fig. 8: Relationship between Income Level and Super Center preferences
When there is an economic change, low interest rates, exchange rate fluctuation, and high taxes, people are more reluctant to keep their normal routine of spending on goods and services other than essential items like food and health. However, the attitude of lifestyle planning is quite a considerable factor in determining lifestyle patterns when there is a significant change in the economy. For instance, when there is a high interest for savings, people are more reluctant to spend, but if a household has planned his or her savings in a long-term perception, high interest may not be fully considered for savings to spending. Proposition 3 is going to discover this sequence.
3. PROPOSITION 3: The household would shift significantly from its ordinary expenditure pattern when major economic factors change, such as inflation (an extreme rise in prices), even though it has a positive attitude towards planning.
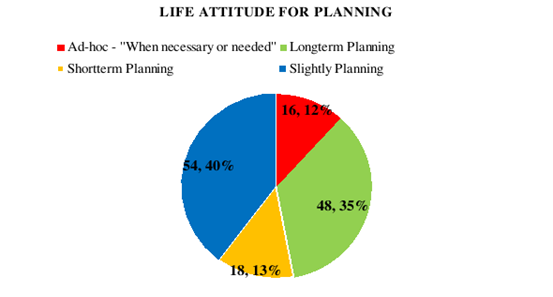
Fig. 9: Life Attitude for Planning
According to Figure 9, 40% of households depend on a slightly planning attitude rather than long-term planning (35%). However, 18% belong to short-term and ad hoc planning, where people take actions when needed instead of before the reaction (proactive), shown in 12%.
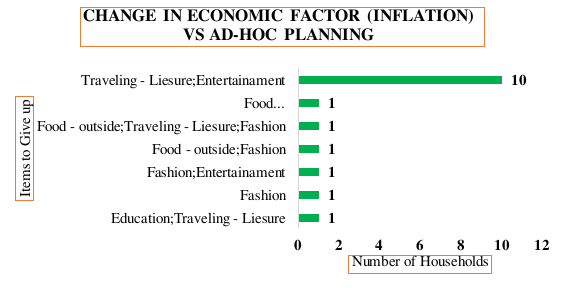
Fig. 10: Items given up by the households with Ad-hoc planning due to changes in Inflation
Ad-hoc planners are more reluctant to give up food and education, but the most preferable elements they are willing to give up is traveling and entertainment, but habit like eating outside is not a desirable thing to give up (refer to figure 10). Figure 11 displays that long-term planners have different choices and are willing to give more items than Ad-hoc planners (figure 10) because their choices are traveling, entertainment, food from outside, and fashion. Figures 12 and 13 represent short-term planners and slight planners. Consequently, their main choice to give up due to inflation is traveling instead of investments and education. According to attitude towards planning (long-term, short-term, ad-hoc, and slightly), the major finding is that they are willing to give up traveling (leisure) to other categories, and the combination with traveling comes up with fashion, entertainment, and food from outside. On the other hand, some are willing to give up investments and education as well, but on a small scale.
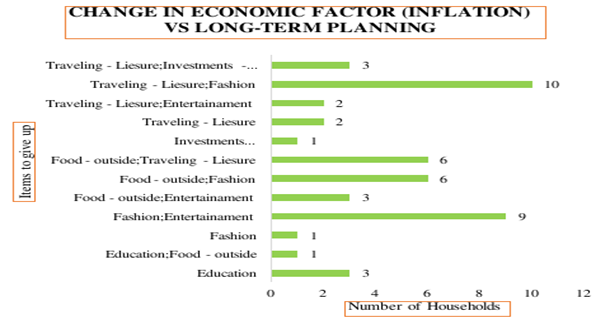
Fig. 11: Items that are given up by households with Long-term planning due to changes in Inflation
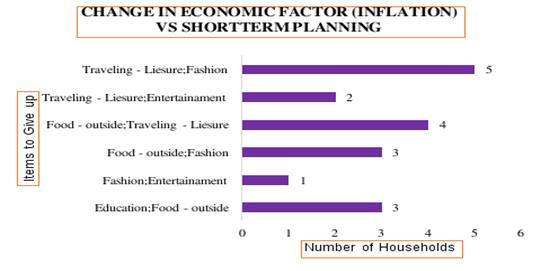
Figure 12: Items given up by the households with Short-term planning due to changes in Inflation
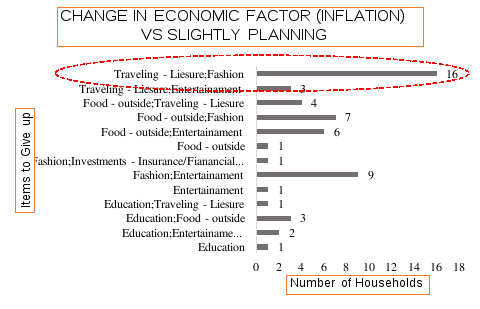
Fig. 13: Items that are given up by the households with Slight planning due to changes in Inflation
4. PROPOSITION 4: The household would take a major shift from their ordinary expenditure pattern when there is an environmental change in the economy; panic towards health impacts even though there is a positive attitude towards planning.
The proposition 4 is quite significant for the current situation in a global aspect, i.e., COVID-19. This is a considerable aspect of the world, and the reaction toward this is another economic disaster, even though good hygiene can prevent infection. This is significantly contrasted to the financial breakdowns in the business cycle because the financial crisis is a part of the outcome due to the response; closedown, health issues, the uncertain period for the vaccine, etc. Due to this care, many people reacted differently between environmental and political circumstances. Figures 14 to 17 show that the most reluctant choice to consume in an environment panic is outdoor food (food from outside); for every aspect of planning attitude – long term or slightly planning. Figure 14 illustrates ad-hoc planners are willing to give their entertainment capacity due to the panic in the health factor. Hence, figure 15 shows long-term planners are willing to give up electronics, charitable contributions, and outdoor food. Figure 16 shows; that short-term proposers are willing to give up their electronic components to other elements like education subscriptions and data. Figure 16 shows the same results on unenthusiastic choices as other figures; 14 to 15 and 17.
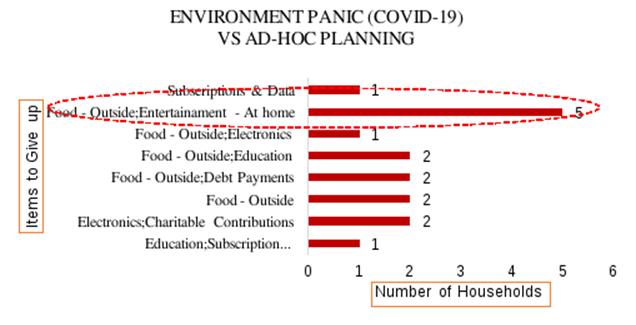
Fig. 14: Items given up by the households with Ad-hoc planning due to environmental panic (COVID-19)
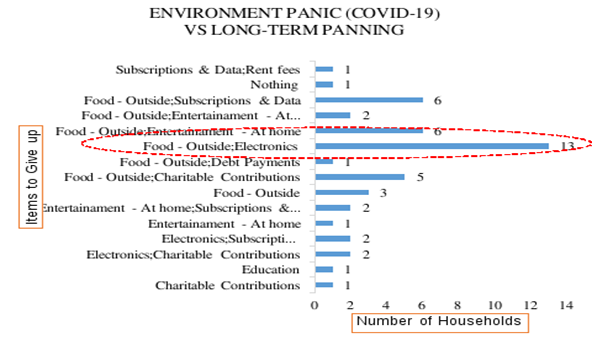
Fig. 15: Items give up by households with Long-term planning due to Environmental panic (COVID-19)
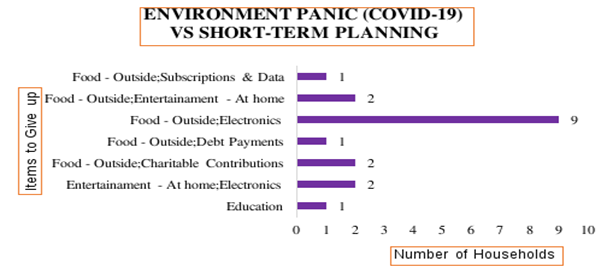
Fig. 16: Items given up by the households with short-term planning due to Environmental panic (COVID-19)
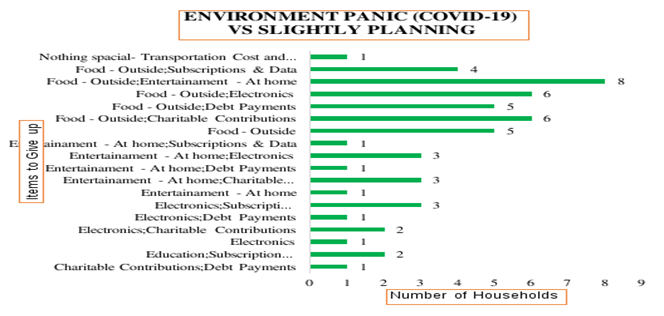
Fig. 17: Items given up by the households with Slight planning due to Environmental panic (COVID-19)
Finally, the results and discussion section have proven that many consumers belong to different household characteristics; income, planning attitude, consumption patterns, and locations for purchasing. Hence, after the above inspections, the following verdicts are made regarding the selected propositions:
- Proposition 1: Accepted
- Proposition 2: Accepted
- Proposition 3: Accepted
- Proposition 4: Accepted
The main objective of the study is to elaborate on the outcome of the study and discuss whether there is a significant relationship between household income and lifestyle patterns. Further. Are there any changes in the pattern of lifestyle for a different outcome in the environment and economy? Hence, this reveals that, overall, a different household with different income levels is not very relevant, especially for the changes in inflation and pandemic consequences, from a Sri Lankan perspective. However, the income level will decide where to purchase goods and services for a certain level.
- According to Campbell and Mankiw (1990), Flavin (1981) reported that consumption is “excessively sensitive” to income. Hence, from the Sri Lankan perspective, is there any significant relationship between income level and consumption pattern?
- The Keynesian view that a country’s aggregate saving rate is driven by its total level of income (Sablic, 2016). Even though, money income is considered to be the major determinant of consumption, what are the other factors of lifestyle behavior are to be considered to have a significant relationship with consumption patterns?
- Panic, illness, or price disparity in the economy can strangle production, consumption, and overall well-being (Evans, 2020). Therefore, Sri Lankan households’ consumption patterns can affect environmental and economic change.
CONCLUSION
Sri Lanka has recently seen a rapid increase in consumption patterns; outdoor food, locations for purchasing, lifetime planning, etc. It is vital to identify information on consumption patterns and lifestyle patterns due to the series of changes in household incomes, socio-economic factors, and environmental factors in Sri Lanka. Therefore, it would be interesting for economic policies to see what factors are compatible with the household’s consumption and lifestyle patterns. This study broadly concerns household income disparity and its relevance to household lifestyle patterns. To assess this purpose, the study mainly focuses on four different propositions where all the propositions are accepted after analyzing the information. Firstly, the study found that there is a significant attachment between the age of the head of household and income level. Secondly, it is clear that there is variability between the household’s income level and the locations in which people prefer to purchase goods and services. Finally; thirdly and fourthly, found that even though there is income level disparity among households and life planning attitudes, the environment panic; COVID-19, and variation in major economic factors; inflation, are quite similar for almost every household compared to their choice of reluctant to purchase or satisfy. For instance, every household is ready to give up traveling for leisure when there are pandemics and inflation in society. Only a few were ready to give up education and investment plans.
Another striking finding of this study is significant there is a disparity among attitudes towards the planning of lifestyle or consumption patterns. For instance, when there is a pandemic issue, every household is unwilling to purchase outdoor food rather than a charitable contribution, investments, education, etc. but ad-hoc planers are not a desirable thing to give up eating outside. In addition to that, the study explored that the biggest factor to give up when there is high inflation is traveling for leisure along with electronics and fashion items. The study evolves in lifestyle patterns of Sri Lankan communities, but it was quite impossible to find the exact reason for the different shifts towards the consumption level and lifestyle patterns due to the changes in the social factors and this leaves it for further research.
AUTHOR(S) NOTE
K.A.K. GNANAWEERA is a Senior Lecturer in Management and Coordinator of the Management Science Unit – Mathematics Department, Faculty of Applied Sciences, the University of Sri Jayewardenepura, Sri Lanka (email: kamal@sjp.ac.lk).
Declaration of Conflicting Interests: There are no possible conflicts of interest regarding the study, writing, and/or publication of this paper.
Financial Disclosure: No specific grant was given for this research by any governmental, private, or nonprofit funding organization.
REFERENCE
- Acemoglu, D., & Ventura, J. (2002). The world income distribution. The Quarterly Journal of Economics, 117(2), 659-694.
- Agarwala, R., & Drinkwater, J. (1972). Consumption functions with shifting parameters due to socio-economic factors. The Review of Economics and Statistics, pp. 89-96.
- Campbell, J. Y., & Mankiw, N. G. (1990). Permanent income, current income, and consumption. Journal of Business & Economic Statistics, 8(3), 265-279.
- Cobb-Clark, D. A., Kassenboehmer, S. C., & Sinning, M. G. (2016). Locus of control and savings. Journal of Banking & Finance, 73, 113-130.
- Evans, O. (2020). Socio-economic impacts of novel coronavirus: The policy solutions. BizEcons Quarterly, 7, 3-12.
- Flavin, M. A. (1981). The adjustment of consumption to changing expectations about future income. Journal of political economy, 89(5), 974-1009.
- Huggett, M., & Ventura, G. (2000). Understanding why high-income households save more than low-income households. Journal of Monetary Economics, 45(2), 361-397.
- Lee, R., Lee, S. H., & Mason, A. (2006). Charting the economic life cycle.
- Loayza, N., Schmidt-Hebbel, K., & Servén, L. (2000). Saving in developing countries: an overview. The World Bank Economic Review, 14(3), 393-414.
- McConnel, C. E., & Deljavan, F. (1983). Consumption patterns of the retired household. Journal of Gerontology, 38(4), 480-490.
- Mustapha, N. H. N., Abd Rashid, N. K., & Nasir, A. (2011). Household income and expenditure relationships: A simultaneous equation approach. Chinese Business Review, 10(6).
- Sablik, T. (2016). Life-Cycle Hypothesis. Focus, Third/Fourth Quarter, 8-8.
- Tu, J. C., Huang, Y. C., Hsu, C. Y., & Cheng, Y. W. (2013). Analyzing lifestyle and consumption patterns of hire groups under product-service systems in Taiwan. Mathematical Problems in Engineering, 2013.
- Yang, F. (2009). Consumption over the life cycle: How different is housing? Review of Economic Dynamics, 12(3), 423-443.