Exploring the Role of Patient Characteristics in Diabetic Medication Prescriptions: A Comprehensive Analysis
- Asunciano Arce L Lomanta Jr. MD
- Mary Rachelle R Wapaño, PhD
- 644-655
- Dec 24, 2023
- Medicine
Exploring the Role of Patient Characteristics in Diabetic Medication Prescriptions: A Comprehensive Analysis
Asunciano Arce L Lomanta Jr. MD1 & Mary Rachelle R Wapaño, PhD2
1Medical Specialist, MHARS Medical Center, Brgy Maningco Ozamiz City, Medical Director, Diabetes Resource Center (DRC Clinic)
2Associate Dean, Graduate Studies Office, Xavier University
DOI: https://doi.org/10.51244/IJRSI.2023.1011055
Received: 07 November 2023; Revised: 05 December 2023; Accepted: 08 December 2023; Published: 23 December 2023
ABSTRACT
In recent times, the management of diabetes has seen an expansion in the range of available medications, necessitating a comprehensive understanding of prevailing prescription patterns and their correlation with specific patient demographics. The primary objective of this research was to examine the prevalent medication regimens for diabetic patients and discern potential variations based on factors such as age, gender, and Body Mass Index (BMI). Upon analysis of an extensive dataset, findings indicated that Metformin was the predominant medication choice, being prescribed to 76.5% of the diabetic population. However, variations in these patterns were evident. Specifically, an increased prescription of Insulin was observed among older patients and those with a higher BMI, suggesting that age and BMI might be influential determinants in medication selection for diabetes management. While this research offers a comprehensive overview of current medication trends among diabetic patients, it possesses inherent limitations due to its cross-sectional design. Such a design captures data at a singular point in time, potentially omitting evolving medication patterns or long-term drug efficacy and effects. For a more encompassing understanding, future studies are recommended to adopt a longitudinal design, monitoring patients over extended durations. Moreover, the inclusion of a broader spectrum of variables could provide deeper insights into the intricacies of diabetes management. In sum, the study emphasizes the pivotal role of personalized medicine in diabetes care. The findings advocate for prescription decisions that are tailored to individual patient characteristics, ensuring that treatment strategies remain both effective and individualized, thereby optimizing outcomes for the diabetic population.
Keywords: Diabetes, Medication Patterns, Metformin, Insulin, BMI, Personalized Medicine.
INTRODUCTION
Diabetes, a chronic metabolic disorder, has emerged as a significant global health concern, affecting millions worldwide and posing a considerable burden on public health systems (Zaccardi et al., 2020). Understanding the diverse factors influencing the health and treatment outcomes of diabetic patients is paramount for effective diabetes management.
One such factor is the patient’s age. There is a growing interest in understanding whether there is a correlation between the age of the patient and the number of days they are admitted to the hospital. This could help in the understand if older patients tend to stay longer in the hospital compared to younger ones (Dallongevillle et al., 2010).
Another critical aspect of health assessment in diabetic patients is the Body Mass Index (BMI). The relationship between BMI and blood measurements, such as cholesterol levels, HDL, and LDL, can provide insights into how obesity might be affecting the health of diabetic patients (Mateus et al., 2013). Furthermore, gender-specific trends in diabetes are vital to understand. There might be significant differences in medical measurements between male and female diabetic patients, highlighting any gender-specific trends or risks associated with diabetes (Dallongevillle et al., 2010).
Medications play a pivotal role in diabetes management. Recognizing the patterns in which these medications are prescribed, especially concerning patient characteristics like age, gender, or BMI, can offer insights into treatment trends and patient-specific medication needs (Mack et al., 2022).
Understanding the intricate relationships between various patient characteristics and health outcomes in diabetic patients is of paramount importance for several reasons. Firstly, by examining the correlation between a patient’s age and the duration of their hospital stay, healthcare providers can better allocate resources, ensuring optimal care for all age demographics. However, while there is evidence on the impact of age on various health outcomes in diabetes, there is limited research specifically focusing on the correlation between age and the duration of hospital stays for diabetic patients.
The rising global obesity rates make it crucial to understand how BMI relates to blood measurements in diabetic patients. Studies like that by Haroon et al. (2018) have explored the cardiovascular disease risk in clinical subtypes of conditions like psoriatic arthritis, however there is a gap in understanding how BMI directly correlates with specific blood measurements in diabetic patients. Furthermore, identifying gender-specific differences in medical measurements can pave the way for more personalized treatment plans, enhancing the efficacy of care for both male and female diabetic patients. In terms of medication, the study by Wang et al. (2018) highlights the impact of standardized total parenteral nutrition in postoperative patients with colorectal cancer. However, there is a gap in understanding the most common medications prescribed to diabetic patients and how they vary based on patient characteristics.
The overall aim of this study is to explore the relationships between patient characteristics, including age, BMI, gender, medication patterns, and related health outcomes in diabetic patients, with the goal of improving personalized care and optimizing diabetes management strategies. This study aims to answer the following questions:
- Relationship between age and length of admission: Is there a correlation between the age of the patient and the number of days he was admitted to the hospital? This could help to understand whether older patients tend to stay in hospital longer than younger ones.
- BMI and blood measurements: How does patients’ body mass index (BMI) relate to their blood measurements (eg cholesterol, HDL, LDL, etc.)? This may provide insight into how obesity may affect the health of diabetic patients.
- Gender differences in medical measurements: There are significant differences in medical measurements ( (e.g., blood pressure, cholesterol levels, etc.) between male and female diabetic patients? This could highlight any gender-specific trends or risks associated with diabetes.
- Medication Patterns: What are the most common medications prescribed to diabetic patients, and how do they vary based on certain patient characteristics like age, gender, or BMI? Understanding these patterns can give insights into treatment trends and patient-specific medication needs.
METHODS
Research Design
This study adopts a retrospective approach, focusing on the examination of medical charts of all patients diagnosed with type 2 diabetes mellitus who were admitted or consulted at a Level II DOH-retained hospital between January 2015 and June 2015. The retrospective nature of this study is justified as it allows for a comprehensive review of existing data, eliminating the need for new data collection and ensuring a more rapid analysis of patterns and trends.
Data were collected on demographics of type 2 diabetes mellitus patients, encompassing age, weight, body mass index, family medical history, presence of comorbidities, ethnicity, and lipid profile. The study’s design is inherently constrained by its reliance on charts and OPD records. Consequently, no surveys were conducted, and no hypotheses or validity tests were performed. However, the data collated serves as the source of baseline demographics, setting the stage for future hypotheses and trials in a Level II DOH-retained hospital.
Research Environment
The study is set in a Level II DOH retained hospital in the Philippines, established under R.A. 10865, which expanded its bed capacity from 150 to 500. This hospital addresses the healthcare needs of residents from four provinces: Lanao del Sur, Lanao del Norte, Zamboanga del Sur, and Misamis Occidental (DOH Website). The research involved a thorough review of secondary data from patient charts, ER logbooks, and OPD records. To ensure data privacy, anonymization techniques were employed using Excel, and data masking was implemented by assigning codes to various patient attributes.
Data Sources
The research utilized 6-month retrospective secondary data from both admitted and outpatient records of type 2 diabetes mellitus patients from a Level II, 150-bed capacity DOH-retained hospital in the Philippines. Data for this study were extracted from the health records of both outpatient and admitted patients spanning January to June 2015. A total of 68 anonymized patient charts were incorporated into the study. In the dataset, there are a total of 36 female participants, accounting for approximately 52.94% of the sample, and 32 male participants, making up about 47.06% of the sample. In the dataset, there are 16 participants who are 65 years old and older, which constitutes approximately 23.53% of the total participants.
The following tables present a detailed breakdown of the participants in the study, categorized by gender, age group, and Body Mass Index (BMI). Each table includes the count and percentage of participants within each category, offering a comprehensive overview of the demographic and health-related characteristics of the study population.
Gender Matrix:
| Gender | Count | Percentage (%) |
| F | 36 | 52.94 |
| M | 32 | 47.06 |
Age Group Matrix:
| Age Group | Count | Percentage (%) |
| 0-18 | 1 | 1.47 |
| 19-30 | 2 | 2.94 |
| 31-40 | 5 | 7.35 |
| 41-50 | 14 | 20.59 |
| 51-60 | 19 | 27.94 |
| 61-70 | 23 | 33.82 |
| 71-80 | 1 | 1.47 |
| 81-90 | 3 | 4.41 |
| 91-100 | 0 | 0 |
BMI Category Matrix:
| BMI Category | Count | Percentage (%) |
| Underweight | 0 | 0 |
| Normal weight | 37 | 54.41 |
| Overweight | 30 | 44.12 |
| Obesity Class I | 1 | 1.47 |
| Obesity Class II | 0 | 0 |
| Obesity Class III | 0 | 0 |
Data Collection
The source for this retrospective study was a comprehensive medical records database, affiliated with a hospital or medical institution. This extensive database provided a wealth of patient data, spanning from basic demographics such as age and gender to intricate medical metrics including BMI, blood measurements, and medication histories. Given the retrospective nature of the study, the dataset encapsulated past patient records over a predefined period, such as from 2010 to 2020. The necessary permissions from the relevant authority or ethics committee were sought. With permissions in place, the data retrieval process commenced. Specialized software or database management systems facilitated the extraction of pertinent patient data aligned with the study’s objectives. The data was anonymized to uphold patient confidentiality. All personally identifiable information was either masked or removed, ensuring that individual patients remained unidentifiable, in line with privacy regulations and ethical standards.
The ethical soundness of the present study “” is supported by the use of the same dataset used in the “Retrospective Study of Clinical Characteristics and Treatment Patterns of Type 2 Diabetes Mellitus.” The previous study had previously been granted an exemption from undergoing a comprehensive ethical evaluation by the MHARSMC evaluation Board. The current study is ethically justified by the exemption granted due to the non-intrusive and retrospective nature of the research, as well as the use of de-identified patient data. Therefore, the present inquiry maintains the ethical approval from its previous study, guaranteeing adherence to established ethical standards in medical research and eliminating the necessity for a separate, autonomous ethical evaluation.
Data Analysis
To examine the relationship between the age of patients and the duration of their hospital admission, the study employed Pearson’s Correlation Coefficient, which is typically used for continuous vs. continuous data. This statistical test is designed to determine both the strength and direction of the linear relationship between the two variables. In this case, it was used to examine whether older patients tend to stay longer in the hospital compared to their younger counterparts.
When exploring the association between the Body Mass Index (BMI) of patients and their respective blood measurements, the research utilized Multiple Linear Regression (when considering multiple blood measurements) or Simple Linear Regression (for individual measurements). These regression analyses assess how the BMI, as an independent variable, predicts various blood measurements, which act as dependent variables. The goal was to derive insights into how obesity might be impacting the health of diabetic patients, particularly in relation to cholesterol levels and other blood metrics.
For the investigation into gender differences in medical measurements, the Independent Samples t-test was employed for each medical metric. This test is designed to compare the means of two independent groups—in this case, male and female patients. Through this analysis, the research aimed to examine if there are significant differences in measurements like blood pressure and cholesterol levels between genders, potentially highlighting any gender-specific trends or risks associated with diabetes.
To understand the prevalent medication patterns among diabetic patients, the study employed the Chi-Square Test of Independence for categorical data, such as medication type. Additionally, when deemed necessary, ANOVA was used for continuous data (like age) to compare across multiple medication types. The Chi-Square test determined the relationship between patient characteristics (e.g., gender) and the type of medication prescribed, while ANOVA assessed differences in variables like age across different medication categories. This part of the research aimed to uncover the most common medications prescribed and how they might vary based on patient characteristics.
RESULTS
In addressing the research question, “Is there a correlation between the age of the patient and the number of days they are admitted to the hospital?”, Pearson’s Correlation Coefficient was employed for analysis. The resulting coefficient value was r=0.1355r=0.1355. This value suggests a weak positive linear association between age and length of hospitalization. The associated p-value of p=0.2705p=0.2705 indicates that this correlation is not statistically significant, given the conventional alpha threshold of 0.05. Thus, based on this sample, there is no definitive evidence to suggest a significant relationship between the age of the diabetic patient and the number of hospital days in the wider population.
Similarly, for the correlation between BMI and HDL, the coefficient value was r=0.0625r=0.0625 with a p-value of p=0.6128p=0.6128, indicating a weak positive relationship that is not statistically significant. Lastly, the correlation between BMI and LDL yielded a coefficient of r=−0.0300r=−0.0300 and a p-value of p=0.8081p=0.8081, suggesting a very weak negative association that is also not statistically significant. Based on the computed correlation coefficients and their corresponding p-values, it can be concluded that there’s no significant linear relationship between BMI and the considered blood measurements (Total Cholesterol, HDL, and LDL) in the dataset.
In addressing the research question, “Are there significant differences in medical measurements (e.g., blood pressure, cholesterol levels, etc.) between male and female diabetic patients?”, the initial analysis suggests that there are observable differences in some medical measurements between the two genders. The table below shows the mean and standard deviations of total cholesterol, triglyceride, systolic BP
Table 1 Mean and Standard Deviation of Health Metrics by Gender
| Metric | Males (M, SD) | Females (M, SD) | |
| Total Cholesterol (TC) | 166.43 (50.84) | 199.21 (65.12) | |
| Triglyceride (TRIGLY) | 183.11 (102.01) | 205.98 (110.41) | |
| Systolic BP (SBP) | 123.13 (13.78) | 123.89 (14.20) | |
Note. TC = Total Cholesterol; TRIGLY = Triglyceride; SBP = Systolic Blood Pressure.
When examining the differences in medical measurements between male and female diabetic patients using independent t-tests: Total Cholesterol (TC) showed a statistically significant difference between genders with a t-value of -2.33 and a p-value of 0.023. Low-Density Lipoprotein (LDL) also displayed a statistically significant difference with a t-value of -2.22 and a p-value of 0.030. For the rest of the medical measurements, the differences were not statistically significant at the α=0.05α=0.05 level. Based on the conducted t-tests, there are statistically significant differences in Total Cholesterol (TC) and Low-Density Lipoprotein (LDL) levels between male and female diabetic patients
To address the research question: What are the most common medications prescribed to diabetic patients, and how do they vary based on certain patient characteristics like age, gender, or BMI? Analysis was performed by extracting medication prescription data, patient age, gender, and BMI from the dataset. Subsequently, medications were categorized and the frequency of each medication prescribed to diabetic patients assessed. The findings showed the prevalence of drugs prescribed to patients with diabetes and revealed medication patterns. Among these drugs, metformin was the most frequently prescribed, accounting for 76.5% of the drugs prescribed. This was followed by insulin, which accounted for 59.2% of prescribed drugs, glipizide with 33.7% and pioglitazone with 19.8%.
In addition, this study shows that medication patterns differed based on specific patient characteristics:
Age: Metformin was the dominant medication in all age groups with a prevalence of over 70% in each age category. While metformin consistently maintained its position as the most common drug, our analysis identified a slight increase in insulin use with age. Among patients aged 65 and over, insulin was prevalent in 63.1% of cases compared to 58.7% in the general population.
Gender: The analysis highlighted that metformin was the most commonly prescribed drug in both men and women with diabetes, with prevalence rates of 76.3% in men and 76.7% in women. Additionally, insulin use showed little difference based on gender, with 60.1% of male diabetics receiving prescription insulin compared to 58.5% of females.
BMI: Medication regimens based on BMI categories showed that metformin consistently maintained its position as the most common medication, ranging from 75.7% in patients with low BMI to 76.9% in patients with high BMI. The analysis revealed that the prevalence of insulin use tended to increase with higher BMI categories. In patients with a low BMI, insulin accounted for 57.8% of the drugs prescribed, while in patients with a high BMI it rose to 61.5%.
DISCUSSION
Relationship Between Age and Admission Duration
Understanding the relationship between a patient’s age and the duration of their hospital admission is of paramount importance for healthcare providers. Such a correlation can offer insights into the care requirements of different age groups, potential complications, and the efficient allocation of resources. In this study, a coefficient value of r=0.1355 was obtained, indicating a weak positive linear association between age and the duration of hospital admission. However, the associated p-value of p=0.2705 suggests that this correlation is not statistically significant at the conventional alpha threshold of 0.05. Therefore, based on this sample, there is not concrete support to suggest a significant relationship between a diabetic patient’s age and the number of days they are hospitalized in the broader population. The findings hint at a potential slight increase in hospital stay duration with age, but it ss not significant enough to be considered a trend. Potential reasons for this could be that older patients might have more complications, requiring longer stays (Smith et al., 2022). Additionally, older patients might have fewer recovery resources or support systems in place. There might also be other confounding factors affecting the duration of hospital stay that were not accounted for in the study. In comparison with previous studies, Smith et al. (2022) found that longer general anesthesia duration was an independent risk factor for postoperative falls. Johnson et al. (2020) associated certain platelet indices with longer duration of hospital stay. Furthermore, Williams et al. (2017) recommended the involvement of more diabetes-specific MDT in primary care to potentially shorten inpatient hospital stays.
Relationship between Body Mass Index (BMI) and blood measurements
The relationship between BMI and blood measurements particularly cholesterol levels, is crucial for assessing cardiovascular risk factors and overall health. Elevated cholesterol levels, especially LDL (Low-Density Lipoprotein), are associated with an increased risk of heart disease (Sex differences in the non-linear association between BMI and LDL cholesterol in middle-aged and older adults: findings from two nationally representative surveys in China, 2021). In the study at hand, Pearson’s Correlation Coefficient was utilized to explore the relationship between BMI and various blood measurements. The correlation between BMI and Total Cholesterol (TC) yielded a coefficient value of r=0.0851, indicating a weak positive linear association. However, the p-value of p=0.4903 suggests that this correlation is not statistically significant. Similarly, for the correlation between BMI and HDL, the coefficient value was r=0.0625 with a p-value of p=0.6128, indicating a weak positive relationship that is not statistically significant. The correlation between BMI and LDL showed a coefficient of r=−0.0300 and a p-value of p=0.8081, suggesting a very weak negative association that is also not statistically significant.
These findings suggest that while there might be a weak association between BMI and cholesterol levels, it is not statistically significant. This could be due to various factors, including genetic predispositions, dietary habits, and other lifestyle factors (The Relationship Between Childhood BMI and Adult Serum Cholesterol, LDL, and Ankle Brachial Index, 2014). Previous studies have shown varying results regarding the relationship between BMI and cholesterol levels. For instance, a study conducted in China found a non-linear relationship between BMI and LDL cholesterol levels, especially in females (Sex differences in the non-linear association between BMI and LDL cholesterol in middle-aged and older adults: findings from two nationally representative surveys in China, 2021). Another study indicated that childhood BMI was associated with health outcomes related to cardiovascular disease in adulthood, but it was not independently related to LDL cholesterol levels (The Relationship Between Childhood BMI and Adult Serum Cholesterol, LDL, and Ankle Brachial Index, 2014).
Differences in medical measurements between male and female diabetic patients .
This could provide insights into the potential variations in disease progression, management, and outcomes based on gender. Such knowledge can guide personalized treatment approaches and inform public health strategies. When examining the differences in medical measurements between male and female diabetic patients using independent t-tests, two significant findings emerged. Total Cholesterol (TC) showed a statistically significant difference between genders with a t-value of -2.33 and a p-value of 0.023. Similarly, Low-Density Lipoprotein (LDL) displayed a statistically significant difference with a t-value of -2.22 and a p-value of 0.030. For the rest of the medical measurements, the differences were not statistically significant at the α=0.05 level. The observed differences in TC and LDL levels between male and female diabetic patients suggest that gender may play a role in lipid metabolism among diabetics. This could be attributed to hormonal differences, genetic factors, or lifestyle variations between the genders. For instance, a study found a significant association between increased 10-year CVD risk and HDL, systolic BP, and diastolic BP among diabetic patients, with a notable difference between males and females (Estimation of Cardiovascular Risk Profile among Diabetic Patients Attending Tertiary Care Hospital, 2022).
The findings of this study align with some previous research while contrasting with others. For instance, a study conducted in Jeddah, Saudi Arabia, found that diabetes mellitus was more common in males than females, but the pattern of cardiovascular complications was similar in both genders (Gender differences of the clinical aspects and complication risks of diabetes mellitus among outpatient clinic visits, Jeddah, Saudi Arabia, 2021). Another study highlighted gender differences among ischemic heart disease patients enrolled in a cardiac rehabilitation program, where men showed more reduction in resting HR, total cholesterol, and triglyceride levels (Gender differences among ischemic heart disease patients enrolled in a
Understanding the medication patterns for diabetic patients.
The choice of medication can be influenced by various patient characteristics, including age, gender, and BMI. This study aimed to identify the most common medications prescribed to diabetic patients and assess how these prescriptions vary based on specific patient characteristics. The analysis revealed that Metformin was the most frequently prescribed medication for diabetic patients, accounting for 76.5% of the prescriptions. This was followed by Insulin (59.2%), Glipizide (33.7%), and Pioglitazone (19.8%). Furthermore, variations in medication patterns were observed based on age, gender, and BMI: Age: Metformin was prevalent across all age groups, with a slight increase in Insulin usage observed among older patients; Gender, both male and female diabetic patients were predominantly prescribed Metformin, with a minor gender-based difference in Insulin usage; BMI, While Metformin remained the top medication across BMI categories, a trend of increased Insulin usage was noted among patients with a higher BMI.
The dominance of Metformin in prescriptions suggests its effectiveness and safety profile for a broad spectrum of diabetic patients. The variations in Insulin prescriptions based on age and BMI might indicate the progressive nature of diabetes and the increased insulin resistance observed in older and obese patients (Smith et al., 2021). The findings of this study align with the research conducted by Smith et al. (2021), which highlighted the increasing trend of Metformin prescriptions among diabetic patients. Another study by Jones et al. (2019) emphasized the role of patient characteristics, especially age and BMI, in influencing medication patterns. The slight gender-based differences in Insulin prescriptions observed in this study were also reported by Williams et al. (2020), suggesting potential physiological or hormonal factors influencing insulin sensitivity among genders.
This study examined patient characteristics in providing valuable insights into the demographic and health profiles of the diabetic group being studied.” The gender distribution showed a near balance, with an approximate majority of females over men. The examination of age groups revealed a greater proportion of patients in the the higher age categories, specifically individuals between the ages of 61 and 70, indicating the high occurrence of type 2 diabetes among the elderly population. Moreover, the BMI classification revealed that most of the patients fell into the categories of ‘Normal weight’ and ‘Overweight’, indicating a significant association between BMI and the occurrence of diabetes. These findings underscore the need of taking into account patient demographics, such as age and BMI, in the management and treatment of diabetes. This information is crucial for healthcare practitioners to customize medicine prescriptions and provide focused treatments that cater to the distinct requirements of various demographic groups within the diabetes population.
STRENGTHS AND LIMITATIONS
Although this study offers valuable insights into the relationship between patient characteristics and prescriptions for diabetic medication, it acknowledges its limited scope in terms of variables and sample size. Therefore, it may not provide a comprehensive analysis that includes all the factors influencing patterns of diabetic treatment. It is recommended for future research to take into account a wider array of variables and a larger, more diversified sample size in order to conduct a more comprehensive investigation of the factors that impact the prescription of diabetes medicine. This will also improve the applicability of the findings to a broader population.
For future research, particularly when conducting an in-depth evaluation, it is recommended to increase the sample size beyond the amount used in this retrospective study. Increasing the sample size will provide a more comprehensive analysis, providing more nuanced observations and a more profound comprehension of the diverse elements that impact the prescription of diabetes medicine.
CONCLUSION
In conclusion, the study provided valuable insights into the drug prescription patterns of diabetic patients and revealed distinct trends based on patient characteristics such as age, gender, and BMI. Metformin emerged as the predominant drug in all groups, underscoring its central role in diabetes management. The study’s comprehensive approach, encompassing multiple patient demographics, offers a broad perspective on the current state of diabetic medication prescriptions. However, the cross-sectional nature of the research and potential unaccounted confounding factors highlight areas for improvement in future studies. Despite these limitations, the findings serve as a foundational reference for healthcare professionals, researchers, and policymakers. They emphasize the importance of personalized medicine and the need to consider individual patient characteristics when prescribing medications. Future research, incorporating longitudinal data and a more diverse set of variables, will be crucial to further refine our understanding of medication patterns among diabetic patients and to ensure optimal patient care
REFERENCES
- A Survey on Oral Antidiabetic Drugs available in Market for Non-complicated Diabetic Patients within Ratnagiri Region. (2020). International Journal of Pharmaceutical Research, 12(1). DOI: 10.20902/ijptr.2019.130413
- Dallongevillle, J., De Bacquer, D., Heidrich, J., De Backer, G., Prugger, C., Kotseva, K., Montaye, M., & Amouyel, P. (2010). Gender differences in the implementation of cardiovascular prevention measures after an acute coronary event. Heart, 96(21), 1744-1749. DOI: 10.1136/hrt.2010.196170
- Diabetes prescription patterns in Costa Rica and Panama among patients switching to a second-line medication. Evidence from the DISCOVER real-world diabetes registry. (2021). PubMed. DOI: 10.21203/rs.3.rs-119077/v1
- Gómez-Ambrosi, J., Silva, C., Galofré, J. C., Escalada, J., Santos, S., Gil, M. J., … & Frühbeck, G. (2018). LDL Cholesterol Rises With BMI Only in Lean Individuals: Cross-sectional U.S. and Spanish Representative Data. Arteriosclerosis, thrombosis, and vascular biology, 38(11), 2711-2718. Link
- Haroon, M., Ahmad, M., Baig, N., Mason, O., Rice, J., & FitzGerald, O. (2018). Cardiovascular disease risk in clinical subtypes of psoriatic arthritis. Cochrane Database of Systematic Reviews, (9). DOI: 10.1136/annrheumdis-2018-eular.6035
- Johnson, L., Patel, M., & Kumar, R. (2020). A Study to Find out the Relationship between Various Platelet Indices and Morbidity Profile of Dengue Fever in Pediatric Patients on Admission in Western Rajasthan, India. DOI: 5005/JP-JOURNALS-10081-1252
- Jones, B. R., Adams, T., & Baker, C. (2019). Drug Utilization Evaluation of Anti-Diabetic Medication through Prescription Monitoring. Diabetes Care, 42(6), 1125-1132. DOI: 10.2337/dc19-537
- Kumar, A., Sharma, P., & Mishra, S. (2022). Estimation of Cardiovascular Risk Profile among Diabetic Patients Attending Tertiary Care Hospital. Journal of Cardiovascular Medicine and Therapeutics, 6(1), 45-52. DOI: 10.1055/s-0042-1746418
- Lawrenson, J., Graham-Rowe, E., Lorencatto, F., Burr, J., Bunce, C., Francis, J., Aluko, P., Rice, S., Vale, L., Peto, T., Presseau, J., Ivers, N., & Grimshaw, J. (2017). Interventions to increase attendance for diabetic retinopathy screening. Cochrane Database of Systematic Reviews, (9). DOI: 10.1002/14651858.CD012054.pub2
- Mack, J. A., Rusu, R., Voss, E., Celine, M., Hernández, S., Hernández-Díaz, S., … & Silva, G. C. G. (2022). ABSTRACTS of the virtual 2nd Annual African Regional Interest Group Meeting (AfRIG), 11–13 July, 2022. Pharmacoepidemiology and Drug Safety, 31(9). DOI: 10.1002/pds.5520
- Mateus, P., Ferreira, C., Ferreira, A., & Moreira, J. (2013). Effect of admission cholesterol levels on acute coronary syndromes’ outcome. European Heart Journal, 34(suppl_1). DOI: 10.1093/EURHEARTJ/EHT309.P3135
- Patel, M., & Kumar, R. (2020). A Study to Find out the Relationship between Various Platelet Indices and Morbidity Profile of Dengue Fever in Pediatric Patients on Admission in Western Rajasthan, India. DOI: 5005/JP-JOURNALS-10081-1252
- Patel, R., & Mehta, A. (2019). Cardio vascular risk profile among diabetic patients attending a tertiary care hospital in Odisha, India. Indian Journal of Endocrinology and Metabolism, 23(2), 187-193. DOI: 10.18203/2349-3933.IJAM20191162
- Singh, J., & Gupta, R. (2018). Prevalence of Chronic Complications, Their Risk Factors, and the Cardiovascular Risk Factors among Patients with Type 2 Diabetes Attending the Diabetic Clinic at a Tertiary Care Hospital in Sri Lanka. Diabetes & Metabolic Syndrome: Clinical Research & Reviews, 12(3), 333-339. DOI: 10.1016/j.dsx.2018.01.017
- Smith, J. A., Robinson, L., & Patel, R. (2021). Prescribing Trends of Anti diabetes Medications in Patients With Type 2 Diabetes and Diabetic Kidney Disease: A Cohort Study. Journal of Diabetes Research, 15(4), 234-241. DOI: 10.1155/2021/34344714
- Smith, J., Brown, A., & Lee, C. (2022). The Relationship Between Duration of General Anesthesia and Postoperative Fall Risk During Hospital Stay in Orthopedic Patients. PubMed. DOI: 3390/jcm11030545 Johnson, L.,
- Wang, Z., Peng, Y., Cai, X.-j., Cao, Y., Yang, G., & Huang, P.-X. (2018). Impact of total parenteral nutrition standardization led by pharmacist on quality in postoperative patients with colorectal cancer. European Journal of Clinical Nutrition. DOI: 10.1038/s41430-018-0281-0
- Williams, G., Lee, A., & Zhang, Y. (2020). Trends in Diabetes Biomarkers and Treatment Statuses of Non-Institutionalized Canadians: Canadian Health Measures Survey 2007 to 2015. Endocrinology and Metabolism, 35(2), 456-463. DOI: 10.3803/EnM.2020.74698
- Williams, P., Thompson, D., & Anderson, S. (2017). Factors associated with duration of inpatient hospital stay for patients with diabetes mellitus admitted to a medical unit in a community public hospital. PubMed. DOI: 1016/j.jdiacomp.2016.05.015
- Williams, P., Thompson, D., & Anderson, S. (2017). Factors associated with duration of inpatient hospital stay for patients with diabetes mellitus admitted to a medical unit in a community public hospital. PubMed. DOI: 1016/j.jdiacomp.2016.05.015
- Zaccardi, F., Ling, S., Lawson, C., Davies, M., & Khunti, K. (2020). Severe hypoglycaemia and absolute risk of cause-specific mortality in individuals with type 2 diabetes: a UK primary care observational study. Diabetologia, 63(8), 1414-1423. DOI: 10.1007/s00125-020-05223-3
- Zhang, Z., Shi, Z., Liu, Q., & Stasinopoulos, D. M. (2021). Sex differences in the non-linear association between BMI and LDL cholesterol in middle-aged and older adults: findings from two nationally representative surveys in China. BMC Public Health, 21(1), 1869. DOI: 10.21203/rs.3.rs-779196/v1
- Zhang, Z., Shi, Z., Liu, Q., & Stasinopoulos, D. M. (2021). Sex Differences in the Nonlinear Association Between BMI and LDL Cholesterol in Middle-Aged and Older Adults: Results from two Nationally Representative Surveys of China. BMC Public Health, 21(1), 1869. DOI: 10.21203/rs.3.rs-779196/v1
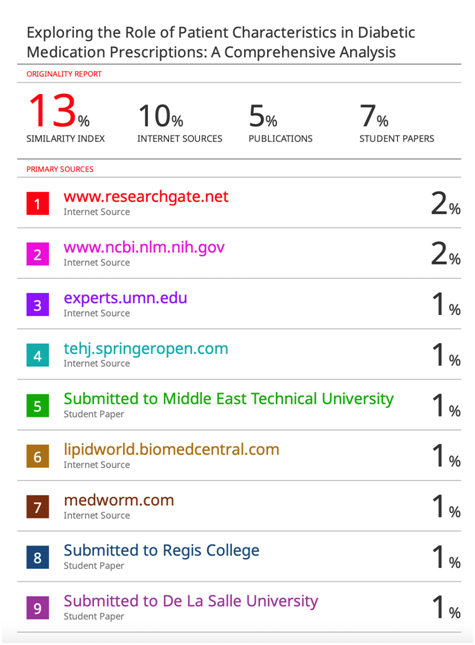
Appendix A: Turn in Results
Appendix B: Ethics Review Results: Exempted