
Impact of Exchange Rate Shock on Foreign Direct Investment in Nigeria.
- Sesan Oluseyi Adeniji
- Ajibola IvieLasaki
- 265-273
- May 1, 2024
- Finance
Impact of Exchange Rate Shock on Foreign Direct Investment in Nigeria.
Sesan Oluseyi Adeniji1, Ajibola IvieLasaki2
1Department of Finance, Real Estate, and Decision Sciences, 2Department of Economics,
Frank Barton School of Business, Wichita State University, Wichita, Kansas, USA
DOI: https://doi.org/10.51244/IJRSI.2024.1104021
Received: 06 March 2024; Accepted: 28 March 2024; Published: 01 May 2024
ABSTRACT
This study examines the underlying forces of foreign direct investment (FDI) response to the exchange rate shock in Nigeria, covering the period 1981 to 2021. Including long-run analysis, this study employs the VEC model innovation accounting as an econometric analysis technique. The outcomes reveal that in the long run, exchange rate appreciation, a thriving domestic investment environment, and economic size positively drive foreign inflows. Conversely, rising economic instability, particularly associated with increasing price levels, negatively impacts foreign investment. The Innovation accounting analysis indicates that FDI positively responds to shocks in exchange rates, GDP, and capital. However, the strength of these responses diminishes over time. The relationship with consumer price index (CPI) shocks appears more complex, with varying reactions over the specified horizon. Hence, policymakers are urged to prioritize exchange rate stability, promote economic growth and innovation, and enhance the domestic investment environment. Addressing economic instability and inflation is crucial, necessitating robust policies to maintain economic stability. Continuous monitoring of CPI is advised, and long-term policy planning is recommended to ensure sustained positive impacts on FDI. Additionally, international collaboration is encouraged to foster a stable global investment environment.
Keywords: Exchange rate, FDI, Shock, VECM, Innovation
JEL Classifications: F31, F21, C32, O31
INTRODUCTION
The intricate global financial terrain is intertwined with the movements of international investments, where Foreign Direct Investment (FDI) plays a crucial role in shaping economic outcomes across borders. Central to this economic scenario is the varied interaction between currency value fluctuations and the strategic choices of multinational firms in their overseas investments. With the expansion of global interconnectedness and the intensification of international trade, the impact of currency rate variations on FDI has garnered increased attention from academics, decision-makers, and the investment community, striving to unravel the complex economic mechanisms at play.
Historically, exchange rate shocks, characterized by abrupt and significant fluctuations in currency values, have been recognized as potent sources of economic uncertainty. The profound impact of these shocks on FDI decisions is a subject of enduring interest and inquiry within the realm of international finance and economics. The inherent volatility associated with exchange rate shocks injects a sense of uncertainty into the strategic calculus of multinational corporations. The sudden and unforeseen movements in currency values pose challenges for investors, altering the risk landscape and influencing the perceived stability of potential FDI destinations. As Alfaro et al. (2004) and Aizenman and Kendall (2008) elucidate, understanding the ramifications of this uncertainty is paramount for investors charting their course in an ever-evolving global marketplace.
Moreover, in the realm of FDI, the inherent currency risk stemming from exchange rate shocks becomes a critical consideration for investors. The anticipated returns on foreign investments are intricately tied to the potential depreciation of host country currencies, leading investors to carefully assess the impact on repatriated profits. Borensztein et al. (1998) and Goldberg and Kolstad (1995) delve into the nuanced relationship between currency risk and the attractiveness of FDI in specific geopolitical contexts.
Further, beyond the realm of risk, exchange rate shocks unfold a narrative of competitiveness that significantly influences FDI decisions. Fluctuations in currency values can render a host country’s exports more competitive or, conversely, introduce production cost challenges. Eichengreen and Irwin (1995) and Razin and Sadka (2007) provide insights into the dynamic interplay between exchange rates and a host country’s competitive positioning, offering a lens through which investors evaluate the desirability of foreign markets. In response to the uncertainties posed by exchange rate shocks, multinational corporations deploy a myriad of hedging strategies to mitigate risks. The availability and efficacy of these financial instruments become crucial determinants influencing the decision to engage in FDI. Allayannis and Ofek (2001) as well as Bartram (2007) highlight the significance of hedging as a strategy for creating robust investment approaches in the face of fluctuating currency values.
Additionally, the maturity and complexity of financial markets in the recipient country plays a critical role in determining how exchange rate fluctuations influence FDI. For example, comprehensive financial systems provide investors with advanced risk management tools, which can help lessen the negative impacts of currency instability. Similarly, Borensztein et al. (1998) and Alfaro et al. (2004) investigate the nuanced association between the advancement of financial markets and the strength of FDI strategies.
Moreover, against the backdrop of exchange rate dynamics, the stability of a host country’s macroeconomic environment emerges as a critical determinant of investment appeal. Well-managed inflation rates, robust fiscal policies, and overall economic stability contribute to lower currency volatility, making certain nations more attractive to foreign investors. Lee and Milesi-Ferretti (2001) and Durnev and Kim (2005) provide empirical insights into the symbiotic relationship between macroeconomic stability and the attractiveness of FDI destinations.
This research strives to enhance the intricate understanding of the diverse dynamics that propel and at times hinder cross-border investments. By exploring the interplay of risk, competitive positioning, macroeconomic stability, and the intricacies of financial market development, this study seeks to construct a detailed framework. This framework is intended to decode the intricate interrelation between exchange rate fluctuations and the strategic maneuvers of multinational corporations, particularly within the Nigerian economic setting.
EMPIRICAL LITERATURE
In examining the forces that shape foreign direct investment (FDI), numerous studies have deepened the collective grasp of the various elements that affect the flow of FDI.
For Sierra Leone economy, Faroh and Shen (2015) investigated how interest rates influenced FDI between 1985 and 2012, uncovering through their multiple regression analysis that FDI inflows were significantly affected by exchange rate fluctuations and the degree of trade openness. Meanwhile, Suliman et al. (2015) adopted a broader lens, focusing on the link between FDI and real exchange rates in low-income countries across Sub-Saharan Africa. Their research, utilizing a panel data methodology, suggested that while a depreciating real exchange rate could enhance FDI attraction, the volatility associated with real exchange rates tended to increase the unpredictability of FDI inflows. Majavu and Kapingura (2016) conducted a study on the factors influencing FDI in South Africa between 1985 and 2012, using the Johansen co-integration test and Vector Error Correction (VEC) model. Their research indicated that GDP and openness to trade had a positive effect on FDI, whereas the consumer price index and corporate taxes were negatively associated with FDI inflows. In a separate study, Sane (2016) analyzed the drivers of FDI in ECOWAS countries from 1985 to 2015 through panel data analysis, finding that higher GDP per capita and greater economic freedom were conducive to FDI, but an unfavorable exchange rate and openness to trade deterred it.
Furthermore, Eregha (2019) examined the impact of exchange rate movements, their volatility, and uncertainty on FDI in the West African monetary zone from 1980 to 2014, discovering that an increase in the exchange rate positively affected FDI, while uncertainty around it had a detrimental effect, despite the positive contributions of GDP and trade openness to FDI inflows. Boga (2019) delved into the factors affecting FDI in Sub-Saharan Africa between 1975 and 2017, employing the Panel ARDL (PMG) method. The findings highlighted that long-term FDI inflows were positively influenced by factors such as GDP growth, openness to trade, domestic credit availability, the presence of natural resources, and the development of telecommunication infrastructure. In a related study, Jaiblai and Shenai (2019) explored what drives FDI in ten countries within Sub-Saharan Africa over the period 1990 to 2017, using the same Panel ARDL (PMG) approach. Their analysis suggested that the exchange rate and trade openness did not significantly affect FDI, whereas factors like inflation and the state of infrastructure played a positive role in attracting FDI. Furthermore, Lee and Brahmasrene (2020) focused on how exchange rate fluctuations are related to FDI inflows, specifically in the context of China.
Using the Vector Error Correction (VEC) approach, the results suggested that exchange rates have a negative influence on FDI inflows over the long term. Additionally, this analysis did not reveal any short-term effects or a direct causal link between exchange rate fluctuations and FDI inflows. Okonkwo et al. (2021) applied the ARDL methodology to assess the connection between FDI and exchange rates in Nigeria from 1981 to 2018, finding a notable influence of the real exchange rate on FDI in both short and long durations. Akinlo and Onatunji (2021) investigated how FDI correlates with exchange rate volatility in ECOWAS nations from 1986 to 2017, with their country specific ARDL analysis showing that nominal exchange rate volatility generally had a negative effect on FDI. In a related study, Oladeji, and Musa (2022) analyzed the impact of exchange rate volatility on foreign direct investment in Nigeria from 1980 to 2018, with their three-variable error-correction model indicating a significant negative effect of exchange rate volatility on FDI.
METHODOLOGY
This investigation utilizes a time series dataset that includes measures such as foreign direct investment (expressed in billions of Naira), the exchange rate (local currency units per US dollar, averaged over the period), real GDP (also in billions of Naira), gross fixed capital formation (in billions of Naira), and the consumer price index. The data for real GDP is obtained from the statistical bulletins of the Central Bank of Nigeria (CBN), while the remaining indicators are derived from the World Development Indicators (WDI) database. The timeframe of this analysis spans 41 years, from 1981 to 2021, with the study using annual data points. Furthermore, the research adopts a five-variable Vector Error Correction (VEC) model to analyze the effects of fluctuations in the exchange rate on foreign direct investment:
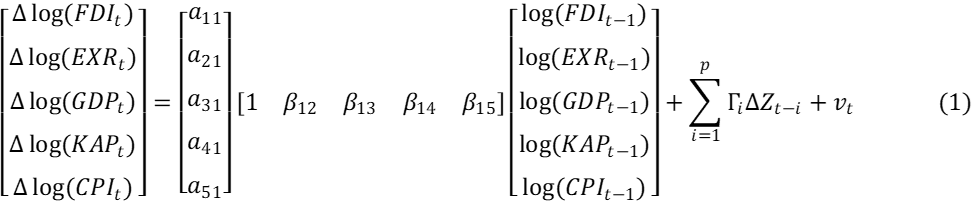
FDI stands for the volume of foreign direct investments; EXR denotes the exchange rate, represented by the value of Naira against the Dollar; GDP signifies the real gross domestic product; KAP is used to indicate domestic capital, measured through gross fixed capital formation, and CPI represents the consumer price index. It can be noticed that the left-hand side of equation (3.1) corresponds to the vector of the variables in growth form since a change in the log of a variable is equivalent to the growth of the variable. Therefore, ∆ log (FDIt) is the FDI growth rate, ∆ log (EXRt) is the exchange rate returns, ∆ log (GDPt) is the output growth, ∆ log (KAPt) is the investment returns and ∆ log (Pt) is the inflation rate. The exchange rate directly affects the cost of investment for foreign entities. When the currency of a host nation weakens, it can reduce the cost for foreign entities to make investments within that country, thereby potentially increasing the influx of foreign direct investment. Conversely, an appreciation may increase the cost. Therefore, the parameter is β12 expected to be positive. Also, FDI decisions consider market access and growth prospects; a strong and growing market, for example, may attract FDI even with a less favourable exchange rate. Therefore, the parameter β13 is expected to be positive. Moreover, a thriving domestic investment environment may enhance the likelihood of attracting foreign direct investment by creating a stable, competitive, and attractive business climate. Therefore, the parameter β14 is expected to be positive. Further, countries with stable macroeconomic conditions are generally more attractive to foreign investors. Hence, the parameter β15 is expected to be negative.
In scholarly discussions, the concept of innovation accounting is often delineated through three main analyses: impulse response analysis, forecast error variance decomposition, and historical decomposition (Rao, 2012). Moreover, there are several ways to compute innovation accounting such as structural identification, Cholesky factorization, diagonal, and the generalised approach. However, this study employed the orthogonalized impulse response approach of innovation accounting because it separates the variables shocks in the system so that their effects in the system are unique.
RESULT DISCUSSION
Table 1: Descriptive statistics
| Variable | Mean | Std. dev. | cv | Min | Max |
| FDI | 21.101 | 1.127 | 0.053 | 19.058 | 22.903 |
| EXR | 3.597 | 2.008 | 0.558 | -0.482 | 5.994 |
| GDP | 10.398 | 0.533 | 0.051 | 9.683 | 11.190 |
| KAP | 28.356 | 1.974 | 0.070 | 25.191 | 31.697 |
| CPI | 3.022 | 2.085 | 0.690 | -0.715 | 5.870 |
Note: cv is the coefficient of variation
Table 1 displays the summary statistics for the principal variables, offering insights into their central tendencies and variability. The mean Foreign Direct Investment (FDI) stands at 21.101, reflecting the average level of investment over the observed period. With a standard deviation of 1.127, FDI exhibits relatively low variability around this mean. The coefficient of variation (coefficient of variation) at 0.053 reinforces this, indicating a modest degree of relative variation. The variable representing the exchange rate shows an average value of 3.597 and a variation measure of 2.008, indicating the central tendency and spread of exchange rate figures. The variability measured at 0.558 points to a moderate fluctuation around the average. For Gross Domestic Product (GDP), the average value stands at 10.398, reflecting the typical economic output. Given the standard deviation of 0.533 and a variability coefficient of 0.051, the GDP figures demonstrate minimal fluctuation from the average, suggesting stability. The capital variable has a mean of 28.356, indicating the average level of capital absorption. The standard deviation of 1.974 and a moderate coefficient of variation of 0.070 suggest a moderate level of relative variability. Consumer Price Index (CPI), with a mean of 3.022, signifies the average level of inflation. However, the high standard deviation of 2.085 and a substantial coefficient of variation of 0.690 points to considerable variability relative to the mean.
Table 2: Augmented-Dickey fuller and Phillips-Perron unit root test result summary.
| variable | term | ADF | Phillips-Perron | Remark | ||
| @level | @ 1diff. | @level | @ 1diff. | |||
| ln(FDI) | no c | -1.952 | -10.134*** | -1.644 | -10.125*** | I(1) |
| c | -2.996 | -10.014*** | -3.048 | -10.014*** | I(1) | |
| c + t | 0.325 | -10.174*** | 0.560 | -10.147*** | I(1) | |
| ln(EXR) | no c | -2.107 | -5.375*** | -2.258 | -5.375*** | I(1) |
| c | -1.388 | -5.747*** | -1.390 | -5.878*** | I(1) | |
| c + t | 1.966 | -4.313*** | 1.426 | -4.375*** | I(1) | |
| ln(GDP) | no c | -0.951 | -3.979*** | 0.442 | -3.979*** | I(1) |
| c | -1.891 | -3.877** | -3.021 | -3.735** | I(1) | |
| c + t | 3.251 | -2.271** | 3.108 | -2.654*** | I(1) | |
| ln(KAP) | no c | 0.668 | -3.928*** | 0.297 | -3.893*** | I(1) |
| c | -2.229 | -3.929** | -2.205 | -3.928** | I(1) | |
| c + t | 6.459 | -0.630 | 4.571 | -2.185** | I(1) | |
| ln(CPI) | no c | -1.627 | -3.690*** | -1.684 | -2.920* | I(1) |
| c | -0.985 | -4.002** | -0.885 | -2.974 | I(1) | |
| c + t | 0.774 | -1.638* | 1.963 | -1.493 | I(1) | |
*** p < 0.01; ** p < 0.05; * p < 0.1
Table 2 showcases the outcomes of the unit root tests conducted on the study’s variables, incorporating three distinct hypotheses: the absence of a constant, the presence of only a constant, and the inclusion of both a trend and a constant within the test framework. The data in Table 2 indicate that initially, the variables do not exhibit stationarity; however, they attain stationarity following the application of the first difference. This suggests that the variables are integrated of the first order. Consequently, there is a necessity to explore the long-term association among the variables under study, which in this research, is facilitated through the application of the Johansen cointegration method.
Table 3: Lag selection criteria
| Lag | LR | FPE | AIC | HQIC | SBIC |
| 0 | 0.000298 | 6.07134 | 6.14809 | 6.28904 | |
| 1 | 447.96 | 6.40E-09 | -4.68426 | -4.22378 | -3.37811* |
| 2 | 64.521 | 4.70E-09 | -5.07673 | -4.23251 | -2.68212 |
| 3 | 87.688 | 2.10E-09 | -6.09531 | -4.86737 | -2.61225 |
| 4 | 108.61* | 6.8e-10* | -7.67949* | -6.06781* | -3.10797 |
Note: Asterisk denotes lag selected by criterion
Table 3 presents the outcomes of selecting the optimal lag length based on various statistical criteria. Although numerous criteria exist for this purpose, they all share a common objective: to choose the lag length that minimizes information loss. Research indicates that the Schwarz Information Criterion (SIC) tends to select the most suitable model in a concise manner, particularly with data of shorter frequencies. However, it’s recognized that no single test definitively outperforms others. The majority of these criteria, with the exception of the SBIC for lag 1, favor selecting lag 4. Yet, this analysis opts for lag 2, suggesting the suitability of a Vector Error Correction (VEC) model of order one, corresponding to a Vector Autoregression (VAR) model of order 2.
Table 4 outlines the findings from the Johansen cointegration test, employing trace and maximum eigenvalue statistics. The conventional approach in this test is to interpret a full-rank result as an indication for the appropriateness of a VAR model, whereas a reduced-rank result suggests the use of a VEC model. A zero rank result indicates that a VAR model with differenced variables should be estimated, adjusting for non-stationarity.
Table 4 Johansen cointegration test
| rank | Params | LL | Eigenvalue | Trace stat. | 5% cv | Max stat. | 5% cv |
| 0 | 5 | 76.344 | . | 88.833 | 68.52 | 35.658 | 33.46 |
| 1 | 14 | 96.504 | 0.635 | 48.514 | 47.21 | 18.230 | 27.07 |
| 2 | 21 | 107.190 | 0.414 | 27.142* | 29.68 | 14.566 | 20.97 |
| 3 | 26 | 115.564 | 0.342 | 10.394 | 15.41 | 2.924 | 14.07 |
| 4 | 29 | 119.842 | 0.193 | 1.838 | 3.76 | -0.000 | 3.76 |
| 5 | 30 | 120.761 | 0.045 |
Note: * denotes selected rank
The analysis of the trace statistics suggests that the hypothesis of no cointegration is not supported, revealing the presence of two cointegrating vectors within the model. This finding suggests a long-term association between FDI and the included variables, indicating interconnected dynamics over an extended period.
Table 5: VEC model long-run and short-run adjustment estimates
| Variable | Coeff. | Ect(t-1) | Coeff. |
| ln(EXRt) | 0.675***
(0.186) |
∆ ln(EXRt) | 0.140
(0.099) |
| ln(GDPt) | 6.851***
(0.891) |
∆ ln(GDPt) | 0.036***
(0.123) |
| ln(KAPt) | 2.535***
(0.463) |
∆ ln(KAPt) | 0.029
(0.047) |
| ln(CPIt) | -1.293***
(0.417) |
∆ ln(CPIt) | -0.021
(0.038) |
*** p < 0.01; ** p < 0.05; * p < 0.1
Table 5 outlines the long-term coefficients within the Vector Error Correction (VEC) framework. The coefficients related to the level variables represent the long-term estimations, while those marked with delta (∆) signify short-term adjustment estimations. The findings indicate that an appreciation in the exchange rate (i.e., the dollar strengthening against the Naira) positively affects FDI over the long term; specifically, a 1% appreciation in the exchange rate correlates with an average increase of approximately 0.68% in FDI. Furthermore, a 1% increase in GDP correlates with an average 6.85% increase in FDI inflows, and a 1% increase in domestic capital correlates with a 2.54% increase in FDI inflows. Conversely, a 1% increase in the Consumer Price Index (CPI) is associated with an average decrease of 1.29% in FDI over the long term. Additionally, the findings reveal that only real GDP among the variables shows a significant response to deviations from the long-term equilibrium, with a 3.6% adjustment. However, this suggests that GDP tends to diverge from its steady-state path rather than converge towards it.
The presented Figure 1 illustrates the dynamic responses of Foreign Direct Investment (FDI) to shocks in the economic variables over a ten-period horizon. It can be observed that, initially, the shock to the variables is shown to have zero impact on the FDI. However, at horizon 1, a positive shock to the exchange rate brings about a 0.07% deviation to the FDI above its normal level, suggesting that a stronger exchange rate positively influences foreign direct investment. This corroborates with the study of Eregha (2019) and Okonkwo et al. (2021) but contrary to Suliman et al. (2015), Sane (2016), Lee and Brahmasrene (2020), Akinlo and Onatunji (2021), Oladeji and Musa (2022). However, the subsequent periods show a gradual decline in the magnitude of this response, indicating a diminishing impact of exchange rate shocks on FDI over time. This implies that, initially, a favorable exchange rate encourages foreign investment, but the strength of this incentive diminishes in the following periods.
Similarly, at horizon 1, GDP increases by about 0.28% above its steady state due to a positive shock to GDP. This implies that higher GDP positively affects foreign direct investment. This is in line with the study of Majavu and Kapingura (2016), Sane (2016) and Boga (2019). However, like the exchange rate, the subsequent periods witness a gradual reduction in the magnitude of this response, signifying a diminishing impact of GDP shocks on FDI. This suggests that an initially favorable economic output encourages foreign investment, but the strength of this incentive wanes over time.
Further, for capital, a positive shock brings about a 0.072% deviation to the FDI above the steady state at horizon 1. This indicates that higher capital positively influences foreign direct investment. Similar to the patterns observed with exchange rate and GDP, the subsequent periods show a decline in the magnitude of the response, suggesting that while an initial surge in capital encourages foreign investment, its impact weakens over time.
Regarding the Consumer Price Index (CPI), a positive shock at horizon 1 results in a 0.074% increase above the normal level. This implies that a higher consumer price index positively influences foreign direct investment. However, in contrast to the other variables, the response to CPI shocks shows fluctuations in subsequent periods, alternating between positive and negative values. This suggests a more nuanced relationship between FDI and consumer price index shocks, indicating that the impact of inflation on foreign investment is variable and less predictable.
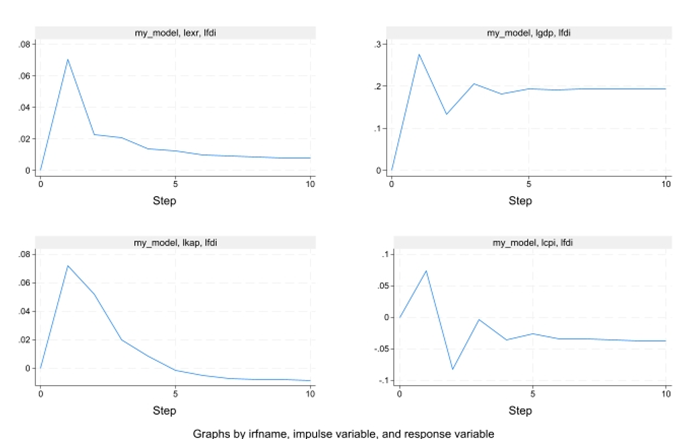
Figure 1: Response of FDI to exchange rate shock and the other macro variables.
CONCLUSION AND POLICY RECOMMENDATIONS
This research investigates the effects of fluctuations in exchange rates on foreign direct investment (FDI), utilizing the Vector Error Correction (VEC) model to explore these dynamics. The findings from the long-term analysis indicate that an appreciation of the exchange rate, along with the size of the economy and a robust domestic investment climate, positively influences the inflow of foreign investment. Also, a rise in economic instability captured by rising price levels has been shown to impact foreign investment inflow negatively. The innovation accounting analysis revealed that FDI is positively responsive to shocks in exchange rates, GDP, and capital, but the strength of these responses diminishes over time. The relationship with consumer price index shocks appears more complex, with varying reactions over the specified horizon. In light of these findings, the research advocates for developing and implementing policy measures aimed at reducing fluctuations and uncertainties in the exchange rate to enhance the appeal of foreign investments.
Furthermore, it is recommended that policy makers devise and execute growth-oriented strategies, such as investments in infrastructure, education, and technological advancements, to attract foreign investment further. Likewise, improving regulatory frameworks, reducing bureaucratic hurdles, and providing incentives for domestic businesses can contribute to a more attractive environment for foreign investors. Further, Policymakers should stay vigilant to changes in the consumer price index and adjust policies accordingly to ensure a favorable investment climate. Similarly, Policymakers should prioritize measures to maintain economic stability and control inflation to instill confidence in foreign investors.
REFERENCES
- Aizenman, J., & Kendall, J. (2008). The internationalization of venture capital and private equity. Journal of International Money and Finance, 27(5), 855-876.
- Akinlo, A. E., & Onatunji, O. G. (2021). Exchange Rate Volatility and Foreign Direct Investment in Selected West African Countries. The International Journal of Business and Finance Research, 15(1), 77-88.
- Alfaro, L., Chanda, A., Kalemli-Ozcan, S., & Sayek, S. (2004). FDI and economic growth: the role of local financial markets. Journal of International Economics, 64(1), 89-112.
- Allayannis, G., & Ofek, E. (2001). Exchange rate exposure, hedging, and the use of foreign currency derivatives. Journal of International Money and Finance, 20(2), 273-296.
- Bartram, S. M. (2007). Corporate cash flow and the real exchange rate. Journal of International Money and Finance, 26(4), 516-534.
- Boğa, S. (2019). Determinants of foreign direct investment: A panel data analysis for Sub-Saharan African countries. EMAJ: Emerging Markets Journal, 9(1), 80-87.
- Borensztein, E., De Gregorio, J., & Lee, J. W. (1998). How does foreign direct investment affect economic growth? Journal of International Economics, 45(1), 115-135.
- Durnev, A., & Kim, E. H. (2005). To steal or not to steal: Firm attributes, legal environment, and valuation. The Journal of Finance, 60(3), 1461-1493.
- Eichengreen, B., & Irwin, D. A. (1995). Trade blocs, currency blocs, and the reorientation of world trade in the 1930s. Journal of International Economics, 38(1-2), 1-24.
- Eregha, P. B. (2019). Exchange rate, uncertainty, and foreign direct investment inflow in West African monetary zone. Global Business Review, 20(1), 1-12.
- Faroh, A., & Shen, H. (2015). Impact of interest rates on foreign direct investment: Case study Sierra Leone economy. International Journal of Business Management and Economic Research, 6(1), 124-132.
- Goldberg, L. S., & Kolstad, C. D. (1995). Foreign direct investment, exchange rate variability, and demand uncertainty. International Economic Review, 36(4), 855-873.
- Jaiblai, P., & Shenai, V. (2019). The determinants of FDI in sub-Saharan economies: A study of data from 1990–2017. International Journal of Financial Studies, 7(3), 43.
- Lee, J. W., & Brahmasrene, T. (2020). Exchange rate movements and structural break on China FDI inflows. Contemporary Economics, 14(2), 112
- Lee, J. W., & Milesi-Ferretti, G. M. (2001). International trade in financial services: The impact of foreign exchange. International Monetary Fund Staff Papers, 48(2), 268-296.
- Majavu, A., & Kapingura, F. M. (2016). The determinants of foreign direct investment inflows in South Africa: an application of the Johansen co-integration test and VECM. Journal of Economics, 7(2-3), 130-143.
- Okonkwo, J. J., Osakwe, C. I., & Nwadibe, E. (2021). Exchange Rate and Foreign Direct Investment in Nigeria. Sciences, 11(1), 213-232.
- Oladeji, B., & Musa, M. (2022). Effect of exchange rate volatility on foreign direct investment in Nigeria. ScienceOpen Preprints.
- Rao, V. K. (2012). Innovation Accounting with Incomplete Identification of a Structural VAR–An Application to Exchange Rates. Available at SSRN 2154775.
- Razin, A., & Sadka, E. (2007). Foreign direct investment: Analysis of aggregate flows. Economic Policy, 22(37), 300-362.
- Sane, M. (2016). Determinants of foreign direct investment inflows to ECOWAS member countries: Panel data modeling and estimation. Modern Economy, 7(12), 1517.
- Suliman, A., Elmawazini, K., & Shariff, M. Z. (2015). Exchange rates and foreign direct investment: Evidence for sub-Saharan Africa. The Journal of Developing Areas, 203-226.