
Integrated Geophysical and Geochemical Evaluation of Groundwater Vulnerability to Open Dumpsite: A Case Study of Part of Zango-Daji Groundwater, Lokoja, North Central Nigeria.
- Danga Onimisi Abdulmalik
- Christopher Chukwudi Ezeh
- 821-839
- Apr 13, 2025
- Education
Integrated Geophysical and Geochemical Evaluation of Groundwater Vulnerability to Open Dumpsite: A Case Study of Part of Zango-Daji Groundwater, Lokoja, North Central Nigeria.
Danga Onimisi Abdulmalik1 and Christopher Chukwudi Ezeh2
1Confluence University of Science and Technology, PMB 1040, Osara, Kogi State, Nigeria
2Enugu State University of Science and Technology, Agbani, Enugu State, Nigeria
DOI: https://doi.org/10.51244/IJRSI.2025.12030063
Received: 07 March 2025; Accepted: 19 March 2025; Published: 13 April 2025
ABSTRACT
This study aimed to assess the impact of dumpsite leachate plume on groundwater in Zango Daji, within Latitude 7⁰46’00”N to 7⁰50’00”N and Longitude 6⁰37’00”E to 6⁰41’00”E. It utilized geophysical methods, including six electrical imaging lines (three 2D resistivity and three Induced Polarization), nine Vertical Electrical Sounding (VES) data points, and groundwater analysis. The data were quantitatively and qualitatively processed using RES2DINV, WINRESIST and SURFER software. 2D resistivity and IP profiles taken at the dumpsite showed low resistivity (11.7–51.8 Ωm) and chargeability (-0.7 to 1.45 msec) in the topsoil and fractured basement zones, indicating leachate migration pathways. A profile 100 m west of the dumpsite showed moderate resistivity (11–422 Ωm) and chargeability (2–6.2 msecs), suggesting a clayey lithologic cover, which act to impede leachate plume flow to the subsurface groundwater. The eastern profile had lower resistivity (29–299 Ωm) and chargeability (>2.7 msec), indicating contamination. The VES results aligned with the 2D resistivity findings. Geochemical analysis of five water samples revealed slightly acidic to alkaline conditions, with cation concentrations following the order Ca > Na > Mg > K and anion concentrations Cl > SO4 > HCO3. Most physiochemical parameters were within WHO (2017) limits, except for chloride, TDS, COD, and lead, which exceeded limits at and east of the dumpsite. The eastern area’s low resistivity and chargeability were linked to elevated physiochemical parameters, likely due to contamination from the dumpsite. Geochemical plots indicated chlorine dominance in groundwater. The study concluded that groundwater quality was affected by anthropogenic activities rather than natural rock-water interactions, with contamination more evident in the eastern zone.
Keywords: Dumpsite, Leachate Plume, Induced Polarization, Groundwater contamination, Physiochemical Parameters
INTRODUCTION
According to Sustainable Development Goal 6, [1], freshwater is crucial for both national and human health, hence the need to ensure the availability and sustainable management of water and sanitation for all. The distribution of freshwater resources within a region, varies greatly throughout time and space, potability of this invaluable resource has seriously been affected in most cases, by the same human that depends on it for survival. The importance of potable groundwater for life cannot be overemphasized for both plants and animals. Studies have revealed that development, sustainability, and general domestic, and industrial activities depend directly and indirectly on groundwater, [2-4]. So water is essential for life sustenance, since all life activities depend directly or indirectly on it, so a holistic study of this invaluable resource is important to ensure continuity of life. Groundwater as a free gift of nature is expected to be available and be in a pure state, unfortunately, many factors have distorted this expectation, the groundwater resources have been contaminated as a result of human anthropogenic activities resulting from indiscriminately sited dumps, with leachate percolating the subsurface to pollute our groundwater system, as illustrated in figure 1.

Figure. 1: Illustration of global current situation of open dumpsite impacts on groundwater and the environment, modified after [5].
Over time, integrated geophysical and geochemical methods have been used to assess the potability of our groundwater system. The common approach for geophysical surveys is the resistivity method which can be used to identify groundwater potential zone and the condition to some extent [6]. The geophysical resistivity method is based on the composition and layering of the subsurface geoelectric layers, interpretation of the soil’s physical characteristics, and underground structures, cavities, and bodies from various geological environments [7]. The Electrical Resistivity Tomography (ERT) method has proven to be one of the most efficient and economical geophysical methods that is used for the delineation of potential groundwater zones.
A variety of applications of the resistivity methods have been published extensively in the literature, for groundwater evaluation and exploration, A few examples are; [8-13] applied electrical resistivity (1D, 2D, and 3D resistivity surveys) for groundwater evaluation and delineated various subsurface layers based on their resistivity signatures. Other authors like [14-18] integrated the electrical resistivity method with the Induced Polarization method for subsurface lithologic delineation and mapping of clayey lithologies, groundwater contaminant zones, and saltwater intruded zones. Many authors have employed integrated geophysical and geochemical methods, to assess the suitability of groundwater for consumption, domestic use, and irrigation, A few among them are; [19], [20], [5], and [21], the studies involved the collection VES data, integrated with some water samples analysis data to identify potential water zone and the pollution status of the groundwater in the outskirt of Kaduna state, Ikom-Mamfe, Cross River State, the metropolis of Kaduna, in Kaduna state, Nigeria and Thandava River basin in India respectively, their findings revealed that zone characterized with low resistivity also has elevated groundwater chemistry.
Leachate plumes generated by Municipal Solid Waste (MSW) can be perfectly mapped and identify characteristics of plume contaminants through the integration of geophysical technique with physiochemical water analysis, [5, 22, 23]. Therefore, a holistic environmental study can be carried out by employing a combined electrical resistivity technique and physiochemical water analysis [5].
Geophysical methods, like resistivity and IP methods, provide subsurface information with little or no environmental impact. It also helps in comparing and distinguishing between various rock layers with different electrical properties [3,16]. Since subsurface information about lithologic stratigraphic sequence, geoelectric parameters, geoelectric layers, etc. can be studied through resistivity measured to infer the subsurface condition for groundwater prospecting and leachate plume evaluation [24]. Integrated geophysical methods can also assist in waste disposal problems by locating geological features of interest like faults that aid dumpsite leachate plume flow [25]. Hence the present study focuses on employing integrated geophysical methods (Resistivity and Induced Polarization) and geochemical methods for the assessment and investigation of the groundwater vulnerability to open dumpsite leachate plume and the associated environmental hazards within Zango Daji, part of Lokoja metropolis, North Central Nigeria.

Figure 2: Map of Nigeria, inset map of Kogi state, inset location map of the study area, showing the dumpsite and electrode spacing on profile line 1 (Zango Profile 1)
Location and Geology of the Study Area
Lokoja, is located in the North central part of Nigeria, it falls within Latitudes 7°45′00″ and 7°51′00″ and Longitudes 6°38′30″ to 6°44′00″, covering a total surface area of 165 km2. Zango Daji falls within Lokoja metropolis, it is bounded 7⁰46’00”N and 7⁰50’00”N to Longitude 6⁰37’00”E and 6⁰41’00”E, covering a surface area of 55 km2. The location of the study area and the pictorial view of the dumpsite studied is shown in figure 2. Geologically, Lokoja transcends the Basement complex and Sedimentary terrain (Figure 3). The Precambrian crystalline basement complex consists of migmatite and migmatite gneiss, undifferentiated granite and granite gneiss and biotite hornblende gneiss, which occupy from the Central to Southwest, western and Northwest of Lokoja [26]. While the Cretaceous to Recent sediments of the Southern Bida Basin occupy the eastern flank, the sediments are alluvium and feldspathic sandstone and siltstone. The northern part of the area is made of ridges (Mount Patti) of Cretaceous sediments of the Southern Bida Basin (Lokoja Sub- Basin) which are the Lokoja, Patti and Agbaja formation. The ridges are dominantly composed of feldspathic sandstone and siltstone which are separated by the biotite hornblende gneiss [27,28]. Conglomerates, coarse false-bedded sandstones, fine to medium-grained sandstone, siltstone and claystone are known to occur in Lokoja Formation [27]. The Agbaja Ironstone is the youngest oolitic ironstone unit in the southern Bida Basin. It is well exposed at Agbaja, where three sub-facies i.e. oolitic, concretional and massive ironstones have been recognized by [28]. The study area is located at the Basement complex part of Lokoja.
Lokoja, experiences a wet and dry seasonal climate, typical of Nigeria’s Guinea Savanna zone. Situated at the confluence of Rivers Niger and Benue, Lokoja spans both crystalline and sedimentary hydrogeological provinces. The area’s drainage system is primarily comprised of Rivers Niger, Benue, and Mimi, a Niger tributary. Lokoja is characterized with 60% mean annual humidity during rainy season and maximum temperature of 37.90 C between December and April and average annual rainfall of about 1000mm [29]. The groundwater availability varies between crystalline and sedimentary terrain, for the Basement, the groundwater depends on the degree of rock weathering, fracturing and interconnectivity of the fractures, while the sedimentary terrain has multi aquifer system and the groundwater here is controlled by primary porosity and pore space interconnectivity [30], which is mainly access through hand dug well (season dependent, poor in dry season), boreholes and springs.
Local Geology:
Lokoja metropolis has a unique geology that transcends the Southwestern Basement complex terrain and the southern Bida Basin, otherwise called the mid-Niger Basin. The study area which Zango Daji town within Lokoja metropolis is situated within the Basement complex terrain of Lokoja, underlain by Migmatite Gneiss and migmatite rocks of the southwestern Basement complex rocks [30], as shown in figure 3.

Figure 3: Digitized Geology map of the study area, modified After [30]

Figure 4: Map of Nigeria, inset map of Kogi state, inset location map of the study area, showing the water sampling locations
MATERIALS AND METHODOLOGY
The data for the present study was acquired using geophysical techniques (Resistivity and Induced Polarization methods) and geochemical techniques (Physiochemical analysis of groundwater samples). Three 2-D electrical resistivity and three Induced Polarization (IP) profile lines measuring 100 m to 150 m were acquired. A pair of 2D resistivity and IP profiles were acquired on the dumpsite, while the other two pairs were acquired approximately 100m east and west of the dumpsite respectively. Nine Vertical Electrical Sounding (VES) data (three on each profile) were acquired using Schlumberger array with 100 meters AB/2 spread. Five groundwater samples were collected for physiochemical analysis, two around the dumpsite profile, one on the western profile, and two on the eastern profile respectively. The location of the dumpsite, 2D resistivity, IP profiles and water samples are shown in the location map, figure 4.
Principle of 2-D Resistivity and Induced Polarization Survey
Both 2-D electrical resistivity tomography (ERT) and IP survey can be carried out with a multi-electrode resistivity meter or convectional resistivity meter, with the electrodes arranged on a straight line with a constant spacing “a”. The resistivity meter changes mode to measures the apparent resistivity and capacitive action of the subsurface (to locate zone where clay and conductive minerals are disseminated within their host rock) for both resistivity and IP measurements respectively. The results are processed with appropriate software like DIPROWIN, RES2DINV, etc. to produce a pseudo-section or resistivity tomography and IP tomography of the subsurface, as shown in figure 5, hence determination of the subsurface geoelectric parameters [31]. According to [32]. Combining resistivity and IP measurements is effective for complex mineral exploration and subsurface contamination determination. Electrical resistivity method can determine the subsurface resistivity variation, hence delineation zones of high conductivity as conductive zone for water, unfortunately clayey lithology also show this characteristic, making resistivity method ambiguous. So, complimenting resistivity method with IP helps to remove the ambiguity, and differentiate clayey lithologic layer from groundwater zones. IP chargeability generally increases with decreasing pore connectivity (Clayey zones) and decreases with zones of high groundwater conductivity (Contaminated groundwater zone) [33]. Both the 2D resistivity and Induced Polarization Chargeability data, were acquired with Wenner array (Figure 6)

Figure 5: Diagrammatic illustration of field procedure for 2D data acquisition for both resistivity and IP data, according to [33].
Geophysical Data Acquisition Array
Various electrodes arrangements (Array) can be employed in geophysical data acquisition, but the present study, employs two array types, which are the Wenner array (Horizontal profiling or expanding Probe), this is used to determine the horizonal subsurface variation in resistivity, as explained by figure 6. 2D resistivity and Induced Polarization data were acquired using Wenner array. The second array is the Schlumberger array, this was employed in the Vertical Electrical Sounding (VES) data acquisition, this array type is used to determine the vertical variation in the subsurface layer resistivity. The principle depends on the fact that the fraction of the electric current put into the ground, penetrating below any particular depth, increases with an increased separation of the current electrodes. Thus, if the electrode separation is increased, the potential distribution at the surface will be affected more and more by variations of resistivity with depth within the earth and deeper depth geoelectric information will be obtained [34]. Schlumberger array is diagrammatically illustrated in figure 7.
Table 1: Colour range for resistivity and chargeability values used for groundwater evaluation within the study area, With reference to [5,33,35-37]


Figure 6: Schematic diagram of Schlumberger array
Where:
ρa, apparent resistivity= 
MN= Distance between potential electrodes
AB distance between current electrodes.
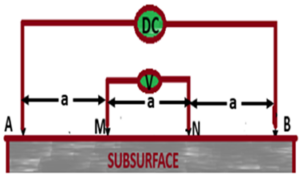
Figure 7: Schematic diagram of Wenner Array
Where:
ρa, apparent resistivity= 2πa x R in Ohm-
a= Inter-electrode spacing (at a = 5 m for the survey)
R= Resistance in Ohm
Data acquisition and processing
Integration of 2D electrical Resistivity, Induced Polarization (IP), Vertical Electrical Sounding (VES), and geochemical (physiochemical analysis) methods were employed for the present study. Three 2D resistivity and IP data profile lengths, measuring 100 meters to 150 meters in length, at 5 meters inter-electrode spacing; one profile line shown in fig. 1, was acquired on the dumpsite, while the other two were acquired 100 m, east and west of the dumpsite respectively. Nine (9) VES data points distributed as three on each profile (see figures. 8, 9, and 10) at AB/2 measuring 100 m, to correlate the 2D resistivity and IP findings. All geophysical data were acquired using ABEM, SAS 1000 resistivity meter. The data were qualitatively and quantitively interpreted using RES2DINV and WINRESIST for the 2D/IP data and VES data respectively. The level of confidence in the generated results was ensured by the Root Mean Square (RMS) error values [38].
The geochemical evaluation was done with five groundwater samples collected around 200 m radius of the dumpsite and around 2D resistivity and IP profiles’ locations, for physiochemical analysis, this was done to validate geophysical findings. Insitu parameters like the PH, TDS, EC, and Temperature were measured on the field with ANNAH electric meter. Heavy metals and cation analyses were done using the ICP-OES method at Agilent Technologies Covenant University, Nigeria, while Spectrophotometric, titrimetric, and Turbimetric methods were used to determine the concentration of major anions like Chloride (Cl), Nitrate (NO3) and Bicarbonates (HCO3), Phosphate (PO4) and Sulphate (SO4), BOD and COD at Prince Abubakar Audu University (PAAU), Kogi state, Nigeria. The physiochemical result were presented using various plots like Piper Trilinear diagram, Durov extended plot, Stiff plot and Schoeller plot according to [39- 41] and graphs for assessment of the groundwater quality within the study area, using software like Origin, Grapher and Excel.
RESULTS AND DISCUSSION
Geophysical (1D, 2D resistivity and IP) results of data at Zango Daji and implication on groundwater
Table 2 shows a summary of 2D resistivity and IP data obtained after qualitative and quantitative analysis of the raw data from Zango Profiles 1, 2, and 3 acquired on the dumpsite, 100 m west and 100 m east of the dumpsite respectively, as shown in fig. 8, 9 and 10, all the profiles are taken in approximately north/south azimuth. Table 1 shows ranges of typical resistivity and chargeability values that constrain the present interpretation, with reference from various researchers that made similar research [5,33,35-37]. Table 2, shows the resistivity values range of < 20 to 50 Ωm for the topsoil and lateritic cover to a depth of approximately 7 m, while some part along the topsoil shows very low resistivity of less than 11 Ωm, denoting the presence of dumpsite leachate here, the chargeability values here ranges from 0.3 milliseconds (ms) signifying the presence of groundwater and values greater than 5 msec, suggesting intercalation of clay in the topsoil [33,37]. The lateritic overburden is followed by layers interpreted as the weathered to fractured Basement to a depth of about 15 m, with characteristic resistivity values within the range of 120 to 700 Ωm, with some obvious zones showing low resistivity ( between 11 to 50 Ωm) characteristic of the dumpsite leachate observes at the topsoil, as shown in fig. 7, these values correlate with chargeability values that ranges between 0 to > 5msec for low resistivity, suspected leachate contaminated zone to the fractured Basement respectively. The fourth layer encountered is still weathered to a fractured Basement with varying resistivity and chargeability still shown in Table 2 to show the subsurface condition. A fresh Basement with a resistivity value range of 1000 to 3500 Ωm, was encountered at the central portion of profile 1 on the dumpsite, which was obvious during the survey and at a depth of approximately 17 m on profiles 1 and 2. The study revealed that the dumpsite sits on a fractured Basement, with evidence of likely leachate migration through the fracture to the subsurface shown in Fig. 7. Moreso, profile 2, shown in Fig. 8 acquired at 100 m west of the dumpsite shows lesser evidence of likely groundwater contamination due to moderate resistivity values (150 to 700 Ωm) encountered here and moderately high chargeability values (> 5 msec) that denotes the presence of clay cover. Profile 3, shown in fig. 9, acquired at 100 m east of the dumpsite shows evidence of likely groundwater contamination due to combined low resistivity (80 to 120 Ωm) and low chargeability (appr. 1 msec) values encountered here and lack of clayey cover that can impede leachate migration as shown in fig. 9. Details of the zone delineation based on the 2D resistivity and IP values of profiles 1, 2, and 3 are summarized in Table 2.

Figure 8: (a) and (b) are 2D Resistivity and IP Tomography respectively of Profile 1, acquired on dumpsite, with VES 1, 2 and 3 Positions.

Figure 9: (a) and (b) are 2D Resistivity and IP Tomography respectively of Profile 2, acquired 100 m, west of Dumpsite, with VES 4, 5 and 6 positions.

Figure 10: (a) and (b) are 2D Resistivity and IP Tomography respectively of Profile 3, acquired 100 m, east of Dumpsite, with VES 7, 8 and 9 positions.
Table 2: Summary of 2D resistivity and IP layer parameters of Zango Daji profile lines
| Profile Lines | Coordinates | Mean 2D resistivity (Ωm) | Mean IP Chargeability (msec) | Zone, Layer or Depth (m) | Interpretation | |||
| Start Point | End Point | |||||||
| Lat. (N) | Long (E) | Lat. (N) | Long. (E) | |||||
| Zango Profile 1 (Dumpsite Profile line) | 7° 48′ 48.6” | 6° 38′ 4.5” | 7° 48′ 51.1” | 6° 38′ 4.9” | < 50 | 0.3 | 7.2 | Topsoil with dumpsite leachate |
| >3500 | 2 | 0 – 5 | Outcrop of Fresh Basemen (Central) | |||||
| < 50 | 2 | 5-13.4 | Fractured Basemen (Leachate plume conduit) | |||||
| 150-700 | 2.5 | 13-16 | Weathered Basement | |||||
| > 1000 | >2.7 | >16 | Weathered to Fresh Basement | |||||
| Zango Profile 2 ( 100 m, west of profile 1) | 7° 48′ 50.2” | 6° 37′ 58.5” | 7° 48′ 47.4” | 6° 37′ 57.1” | <20 | 1.3 | 0-7 | Sandy clayey topsoil |
| <20 | 3 | 0-7 | Clayey lithology topsoil (btw 20-35 m length | |||||
| 25-120 | 1.3 | 7-10 | Fractured Basement with fresh water. | |||||
| 120-250 | 1.3 | 10-15 | Fractured to Weathered Basement | |||||
| 250-700 | 1.3 | >15 | Weathered to Fractured Basement | |||||
| Zango Profile 3 (100 m, east of profile 1) | 7° 48′ 44.1” | 6° 38′ 9.9” | 7° 48′ 41.4” | 6° 38′ 8.4” | < 30 | 2 | 0-6.7 | Topsoil (25 to 100 m end) |
| 150 -250 | > 2 | 0 – 5 | Clayey topsoil (0 to 25 m length) | |||||
| 80 -120 | 0-2 | 6-17 | Fractured to weathered Basement at central part, suspected to be contaminated btw 15 to 35 m length showing mean chargeability of 0 msec | |||||
| > 300 | 2.5 | 6-17 | Weathered Basement from 0 to 50 m length | |||||
Geo-electrical results of the VES and its implications on groundwater in Zango Daji.
Fig. 11, 13, and 15 are the geoelectric sections produced from the nine (9) VES acquired at Zango Daji, distributed evenly on the three 2D profile lines to correlate the resistivity findings and for a deeper depth probe of the subsurface. The summary is shown in Table 3. The nine VES data produce four-layer curve types, which are distributed as; six HA curve types (for off-dumpsite VES), one HQ, and two AK curve types on dumpsite profile, The geoelectric layers delineated are the topsoil, and lateritic layer, weathered to fractured/fractured Basement and fresh Basement based on the resistivity values and well log data with reference to [42]. The topsoil resistivity generally varies from 57.3 to 319 Ωm, to a depth of approximately 1.2 m, the lateritic soil has resistivity varying from 8.3 to 198 Ωm, to an approximate depth of 6.9 m, beneath this is weathered to fractured/fractured, with mean resistivity value of 251.2 Ωm, occurring to a depth of 30 m in some places (Figure 13), while fresh Basement with a resistivity value range of 986 to 9488 Ωm, occurs beneath in most cases, except for the geoelectric section of VES 1, 2 and 3 acquired on the dumpsite that shows low resistivity fractured Basement occurring from a depth of about 4 m to a depth beyond 15 m on VES 2, (Fig. 11), this low resistivity zone corresponds to low fractured path delineated on 2D resistivity profile shown in figure 8. This implies that the dumpsite in Zango Daji, sits on a fractured Basement and the possibility of dumpsite leachate plume migration to the subsurface cannot be debated. The geoelectric section for VES on profile 2 (100 m, west of dumpsite) as shown in Figure 13, shows a very low resistivity lateritic cover, which was interpreted from 2D resistivity and IP profile (Table 2 and figure 9) as clayey topsoil since clay generally has characteristic high chargeability and low resistivity [16,43,44]. Clay being an aquiclude, can impede leachate migration to the subsurface, while the layer below this zone has a moderate resistivity layer before the fresh Basement. Figure 15, shows the geoelectric section produced from VES 7, 8, and 9, acquired on profile 3, which is 100m east of the dumpsite or profile 1. The section generally shows a moderately low resistivity lateritic cover, comparing this with the IP profile in figure 10b, this area has less clay that can impede leachate flow from the surface, below this zone is a low resistivity fractured Basement, and then the fresh Basement. Due to the evidence of lack of clayey cover observed in this zone, the zone is more vulnerable to leachate contamination than the western axis if groundwater flows in that direction. Summarily, the VES was able to probe deeper (beyond 30 m depth) than the 2D resistivity result, the result is similar to the 2D resistivity and IP findings.

Figure 11: Geoelectric Section of VES 1, 2 and 3, on profile 1.

Figure 12: Depth Sounding curve of VES 1

Figure 13: Geoelectric Section of VES 4, 5 and 6, on profile 2.

Figure 14: Depth Sounding curve of VES 4

Figure 15: Geoelectric Section of VES 7, 8 and 9, on profile 3.

Figure 16: Depth Sounding curve of VES
Table 3: Summary of the VES (VES 1 to 9) acquired on profiles 1, 2 and 3 in Zango Daji
| VES Name | GPS Coordinates
|
Elevation (m) | 2D Traverse no. | No. of layers | Rest. in (Ohm-m) | Depth (m) | Inferred Lithology | Curve Types |
| Z V1 | N07° 48’47.4”, E06° 38′ 2.9”
|
101 | Zango P1 | 1,2,3,4 | 319, 198, 1318, 28.3 | 1.2,5, 14, — | Topsoil, Lateritic clay, Fresh and Fractured Basement | HQ |
| Z V2 | N07° 48′ 49’‘, E06° 38′ 2.9” | 107 | Zango P1 | 1,2,3,4 | 60.5,186, 435, 39.8 | 1.3,4.3,13, —- | Topsoil, Laterites, Fractured and highly Fractured Basement | AK |
| Z V3 | N07° 48’49.2”, E06° 37′ 38.2” | 116 | Zango P1 | 1,2,3,4 | 65,137, 1127 2053, 31.4 | 0.8,5.4, 12.2 ,24.5 —- | Topsoil, Weathered, Fresh and Fractured Basement | AK |
| Z V4 | N07° 48′ 50.9”, E06° 37′ 52” | 121 | Zango P2 | 1,2,3,4 | 74.5, 11.3, 343.7, 1026 | 0.7, 3.9, 12.5, —- | Topsoil, lateritic clay, fractured and fresh Basement | HA |
| Z V5 | N07° 48′ 50.1”, E06° 37′ 52” | 119 | Zango P2 | 1,2,3,4 | 159, 13.9, 733.5, 5402 | 0.6, 3.7, 10.2, — | Topsoil, lateritic clay, fractured and fresh Basement | HA |
| Z V6 | N07° 48′ 49.2”, E06° 37 47” | 123 | Zango P2 | 1,2,3,4 | 57.3, 8.3, 215, 986 | 0.6, 3.8, 33.2, — | Topsoil, lateritic clay, fractured and fresh Basement | HA |
| Z V7 | N07° 48′ 42”, E06° 38′ 8.9” | 162 | Zango P3 | 1,2,3,4 | 166, 34.1, 387, 9488 | 0.7, 6.0, 17.6, — | Topsoil, laterite, fractured to weathered and fresh Basement | HA |
| Z V8 | N07° 48′ 43”, E06° 38′ 9.2” | 165 | Zango P3 | 1,2,3,4 | 190, 63.3, 1329, 1703 | 0.9, 6.3, 24.9, — | Topsoil, laterite, weathered/fresh Basement and fresh Basement | HA |
| Z V9 | N07° 48′ 44.8”, E06° 38′ 11.2” | 163 | Zango P3 | 1,2,3,4 | 100, 45.3, 485, 1476.3 | 0.9, 5.8, 21.8, — | Topsoil, laterite, fractured to weathered and fresh Basement | HA |
Physicochemical Characteristics of water around the dumpsites
Table 4, shows the summary of the physiochemical field measurement and that of hydrochemical laboratory analyses of the groundwater within the study area. Major cations, anions, heavy metal analysis , BOD, and COD were done in the laboratory, while parameters like Electrical Conductivity (EC), Total Dissolved Solid (TDS), PH and temperature were measured in situ with ANNAH multimeter. All measurements, except EC, temperature, and Ph, were done in milligrams per liter (mg/l), and standard like the World Health Organization [45], was used to make inferences on the physiochemical parameters of the sampled groundwater and to determine the suitability or otherwise of the groundwater.
Table 4: Physio-chemical analysis of the sample water obtained from five water samples (ZL1 to ZL5) within a 250 m radius of the dumpsite for groundwater vulnerability risk assessment.
| S/N | 1 | 2 | 3 | 4 | 5 | 6 | |
| Sample ID | ZL1 | ZL2 | ZL3 | ZL4 | ZL5 | WHO (2017)
STANDARD
|
|
| Location coordinates/ Distance from Dumpsite | E6°37’55”, N7°48’46”/ 100m, west of Zango Dumpsite. | E6°38’01”, N7°48’50”/ Zango Dumpsite (ZD) | E6°38’01”, N7°48’46”/ 20 m, east of ZD | E6°38’09”, N7°48’41”/ 100 m, east of ZD | E6°38’26”, N7°48’36”/ 100 m, east of ZD | ||
| PH | 7.0 | 7.2 | 6.9 | 7.0 | 6.6 | 6.5-6.8 | |
| EC (msec/cm) | 0.97 | 1.09 | 0.795 | 1.14 | 1.38 | 0.1 | |
| TDS (mg/l) | 667 | 790 | 594 | 828 | 1012 | 600 | |
|
Heavy Metals |
Cd (mg/l) | 0.0011 | 0.0020 | 0.0030 | 0.0019 | 0.0016 | 0.003 |
| Cr (mg/l) | 0.0013 | 0.0044 | 0.005 | 0.005 | 0.004 | 0.05 | |
| Pb (mg/l) | 0.0217 | 0.1021 | 0.0044 | 0.0036 | 0.038 | 0.01 | |
| Fe (mg/l) | 0.112 | 0.189 | 0.098 | 0.078 | 0.081 | 0.3 | |
| Na (mg/l) | 3.23 | 20.35 | 18.21 | 27.20 | 34.00 | 200 | |
| Mg (mg/l) | 12.913 | 50.061 | 59.662 | 16.90 | 15.40 | 170 | |
| Ca (mg/l) | 6.048 | 10.654 | 15.150 | 34.400 | 39.800 | 500 | |
| Cl (mg/l) | 307.8 | 302.40 | 310.00 | 311.30 | 359.20 | 250 | |
| HCO3 (mg/l) | 13.60 | 12.90 | 14.80 | 16.90 | 17.40 | Appr. 600 | |
| SO4 (mg/l) | 27.20 | 25.80 | 29.40 | 39.80 | 45.50 | 250 | |
| BOD (mg/l) | 4.60 | 4.80 | 4.40 | 4.10 | 4.90 | 5 | |
| COD (mg/l) | 22.10 | 21.80 | 22.90 | 29.00 | 33.10 | 10 | |
Table 4 shows the physiochemical results of samples ZL1 to ZL5 and compared with the World Health Organization (WHO) standard (2017). Sample ZL1 was collected at the western axis of the dumpsite, while sample ZL2 was collected at the dumpsite, and samples ZL3 to ZL5 were collected at at eastern part of the dumpsite. The results revealed the pH values of four out of the five samples were slightly alkaline, that is values are higher than [45] permissible limit of 6.5-6.8, while only sample ZL5 with value PH value of 6.6, falls within WHO permissible limit. Figure 17, shows the variation of the TDS with the WHO standard, all the groundwater sampled show higher TDS than the permissible limit of 600 mg/l of the WHO, this implies that the water contains a high amount of dissolved substances, which invariably can increase the electrical conductivity and hence low resistivity recorded by the geophysical method. The EC values are grossly higher than the WHO permissible limit as shown in figure 20, the highest value (1.38 msec/cm) was recorded in sample ZL5, collected at the extreme eastern part of the study area, High EC could indicate the heavy presence of salt, high temperature, heavy metals, and higher impurities (dissolved substances, chemicals, and minerals) in the water [46].
Elevated Physiochemical Parameter and Health Implications
Elevated physiochemical parameters have several health implications for man and the environment. The high amount of TDS in groundwater can cause gastrointestinal problems and kidney stones depending on the element involved, [47]. Figure 18, shows the variation of the Biochemical Oxygen demand (BOD), the Chemical Oxygen Demand (COD), and the PH within the study area and a comparison made with the WHO standard for drinking water, the result revealed a high level of COD compared to the permissible limit, while the BOD values were within permissible limit. Elevated COD can reduce the dissolved oxygen level in the water, harming aquatic life [48], health risks to the consumers, like cancer, [49], neurological problems such as headaches, dizziness, and nausea [50], and increase waterborne diseases like cholera, dysentery and gastroenteritis [45]. The heavy metal analysis result shown in figure, shows that only lead exceeds the WHO permissible standard for drinkable water among the heavy metals analyzed, except for (ZL1), the only sample collected at the western axis of the dumpsite, this helps to validate the geophysical findings that show the eastern part of the dumpsite shows higher evidence of pollution that the western part, hence, the possibility of groundwater flowing eastward, which agrees with [3] that revealed that the groundwater within the study area is flowing eastward. Elevated lead in drinking water has been known to have adverse effects on both adults and children, causing lower IQ, attention deficit, malfunctioning of adult kidneys, and other brain behavioral problems [45, 52].
Hydrochemical Facies Analysis
Hydrochemical facies analysis is a method used to understand the chemical characteristics of groundwater. Four diagrams were employed for five groundwater samples used for the present study, they are the Piper Trilinear Diagram, the Durov Diagram, the Stiff plot, and the Schoeller plot.
The Piper Trilinear Diagram is a graphical representation that combines two triangles, one for cations and the other for anions. The intersection of these two triangles forms a diamond-shaped field, which provides information on the hydrochemical facies of the groundwater. The Piper plot as shown in figure 21, reveals that water type is a combination of NaCl, CaCl, and a mixed CaMgCl, and the preponderance of Chloride in all water samples, are reflections of human anthropogenic influence, vis a vis, the dumpsite leachate plume contamination influencing the water chemistry and not rock-water interaction within the study area.
Durov Diagram helps to infer the hydrological processes affecting the groundwater chemistry. The Durov Diagram shown in figure 22, indicates the predominance of reversal hydrochemical processes in the groundwater chemistry, this is indicated by the preponderance of sodium and Chloride over other ions. Reversal processes are pointers to human activities such as over-pumping of groundwater, injection of wastewater, and use of fertilizers and pesticides, [51].
Both Stiff and Schoeller plots help to show the variation of the major cation and anion in a water sample, consequently inferring the dominant anion and cation in such a sample. Stiff and Schoeller plots shown in figures 23 and 24 respectively show the preponderance of chlorine, magnesium, and sodium in the groundwater chemistry, which are still indications of human anthropogenic (dumpsite leachate) influence rather than rock water interaction. Furthermore, table 4 indicates that all the physiochemical parameters analyzed, show higher concentrations in the water samples, ZL3, ZL4, and ZL5 collected from the dumpsite to the eastern end of the study area than the sample ZL1 collected at the western part of the study area, this reveals why the geophysical result of the 2D, IP, and VES that shows lower resistivity and chargeable values at the eastern axis of the dumpsite that the western part, hence both geophysical and geochemical findings, indicates that the groundwater within the study area has been influenced by human anthropogenic activities, vis-à-vis, the dumpsite leachate migration and more pronounced at the eastern side of the dumpsite.

Figure 17: Level of TDS of the groundwater in Zango

Figure 18: Level of BOD, COD and PH of the groundwater in Zango

Figure 19: Concentration of heavy metals of the groundwater in Zango Zango

Figure 20: EC values of the groundwater in Zango

Figure 21: Piper Plot of the major Cations and anions

Figure 22: Durov Plot of the major Cations and anions

Figure 23: Stiff Plot showing the preponderance of Cl, Mg and Na.

Figure 24: Schoeller Plot showing the preponderance of Cl and Mg.
SUMMARY AND CONCLUSION
In summary, the study revealed that the dumpsite in question actually sits on a fractured Basement, this is revealed by an obvious fracture shown by a low resistivity value of less than 15 Ωm, leading from the surface to a depth below 10 m, at the central portion of Profile 1 acquired on the dumpsite. The IP profile along the resistivity profile also identified the fracture by showing low chargeability values of 0.7 to 1.4 msec, confirming the presence of water to aid dumpsite leachate migration from the surface downward as shown in figure 8. The VES resistivity values acquired on this profile also show low resistivity values between 28.3 to 39.8 (figure 11) along the identified fracture, confirming the 2D resistivity and IP tomography results. Profiles 2 and 3, shown in figures. 9 and 10 acquired at 100 meters west and east of the dumpsite respectively, revealed low resistivity topsoil to fractured Basement terrain with Profile 2 showing values that suggest clayey topsoil that can impede downward leachate flow. This is lacking in profile 3 acquired 100 meter east of dumpsite, that makes the groundwater at the eastern axis of the dumpsite suspected to be more vulnerable to either surface leachate downward flow and subsurface lateral leachate migration through the fractures. Geochemical analysis of the five water samples (ZL1 to ZL5) collected within the study area, correlates significantly with the geophysics result. Water samples (ZL2 to ZL5) collected at the dumpsite and the eastern axis of the dumpsite show a high concentrations of Heavy metals like lead, TDS, EC, and the chemical oxygen demand (COD) exceeding the permissible limits of the WHO. Water sample (ZL1) collected at the western axis of the dumpsite, shows that these physiochemical parameters concentrations are generally within the WHO permissible limits. These validate the geophysical findings that show lower resistivity and chargeability at the eastern axis than the western axis. Table 4, shows that other physiochemical parameters within WHO permissible limits are generally higher in water samples collected from the dumpsite to the eastern axis than those collected from the western counterpart. The major cation and anion analysis, reveals the preponderance of sodium, magnesium, and chloride ions than other ions in the groundwater sample, as shown in Table 4 and represented with Piper, Durov, stiff, and Schoeller plots in figures 21, 22, 23 and 24 respectively. This result shows that the groundwater chemistry is anthropogenically (dumpsite leachate plume flow) and not rock-water interaction influenced. This confirms that the water contamination revealed by higher concentration of physiochemical parameters at the eastern axis is as a result of human anthropogenic activities (dumpsite leachate flow) and not rock-water interaction. Furthermore, the groundwater within the study area is suggested to flow eastward, which agrees with [3], hence the reasons eastern part of the dumpsite showed higher evidence of geophysical anomaly and higher physiochemical concentrations. Conclusively, the research reveals that Zango dumpsite leachate plume and general human anthropogenic activity play a significant role in the groundwater chemistry within the study area and has significantly affected the groundwater condition within 100 m distance east of the dumpsite. Hence the reason many physiochemical parameters concentrations exceed WHO permissible limits for potable groundwater within 100 m radius, east of the dumpsite. The study therefore underscores the importance of integrating geophysical and geochemical methods for environmental and vulnerability studies.
Author contributions: Conceptualization, methodology, software, validation, formal analysis, investigation, resources, data curation, writing—original draft preparation, writing—review and editing, visualization funding acquisition: Danga Onimisi Abdulmalik. supervision, project administration, formal analyzing, review and editing: Christopher Chukwudi Ezeh.
Funding: This research didn’t receive any specific grant from funding agencies in the public, commercial, or not-for-profit sectors.
Conflict of interest: The authors declare no conflict of interest
Data availability statement: All the materials and data used for this research are available for further information.
REFERENCES
- United National General Assemby. (2015). Transforming our world: The 2030 Agenda for Sustainable Development (A/RES/70/1)
- Adagunodo T.A., Akinloye M.K., Sunmonu L.A., Aizebeokhai A.P., Oyeyemi K.D., Abodunrin F.O. (2018), Groundwater Exploration in Aaba Residential Area of Akure, Nigeria. Frontiers in Earth Science. 6(66), P. 1-12. Available from: https://doi.org/10.3389/feart.2018.00066
- Naiyeju J. O., Oladunjoye M. A., Adeniran M. A. (2021) Aquifer evaluation in parts of north‑central Nigeria from geo‑electrical derived parameters. Applied Water Science. P. 1-16. https://doi.org/10. 1007/s13201-021-01520-3.
- Mosuro, G.O., Princess H.A., Bayewu O, Moroof O.O. and Oluwadamilare O. (2022). 3D Electrical Resistivity Approach to Groundwater Exploration in Olabisi Onabanjo University Campus, Ago-Iwoye, Southwest Nigeria. Equity Journal of Science and Technology. 8(2), P. 83 – 89. https://dx.doi.org/10.4314/equijost.v8i2.14
- Alao, J. O., Lawal, H. A., & Nur, M. (2023c). Investigation of Groundwater Vulnerability to Open Dumpsites and its Potential Risk Using Electrical Resistivity and Water Analysis. Heliyon 8, e09855: https://doi.org/10.1016/j.heliyon.2022.e09855.
- Omar, J. H., Ahmad, N., Jelani, J., Suif, Z.., & Othman, M. (2023). Geophysical Investigation of Groundwater Resources using Electrical Resistivity and Induced Polarization Method. GEOMATE Journal, 25(107), P. 235–242. Retrieved from https://geomatejournal.com/ geomate/article/view /3916
- Fischanger F., Cesare Comina, Luigi Sambuelli and Catanzariti G. (2019). Geophysical anomalies detected by electrical resistivity tomography in the area surrounding Tutankhamun’s tomb,” J. Cult. Herit., (36), P. 63–71, https://doi.org/1016/j.culher.2018.07.011
- Arsene B., Elvis G., and Daniel N. (2018). Investigation for Groundwater Resources from Electrical Resistivity Tomography and Self-Potential Data in the Meiganga Area, Adamawa Cameroon. International Journal of Geophysics. (2018), P. 1-14. https://doi.org/1155/2018/2697585.
- Ezeamaka G.O., Mallam A., and Osagie A.U., (2022). Groundwater Exploration using 2D resistivity Imaging within Abuja Municipal Area Council, Nigeria. Science World Journal, 17(1), P. 175- 179.
- Hassan Alzahrani, Kamal Abdelrahman, and Saddam AliHazae (2022). Use of geoelectrical resistivity method for detecting near-surface groundwater potential zones at Riyadh city, Saudi Arabia. Journal of King Saud University – Science, 34(7) P. 102253.
- Aziman M., Saiful A., Ahmad T., Mohd Z. S. and Md M.F. dan Azlan, (2018). Electrical resistivity and induced polarization techniques for groundwater exploration, Int. Journal of Integrated Engineering,10(8), P. 56-60.
- Lieyana Azffri, Stefan Herwig Gödeke, and Mohammad Faizan Ibrahim, (2022). Electrical Resistivity Tomography and Induced Polarization Study for Groundwater Exploration In The Agricultural Development Areas of Brunei Darussalam. Environmental Earth Sciences, P. 1-24.
- Ezeh C.C., Ugwu G. Z., Austin O. and Okamkpa J. (2013). Using the relationships between geoelectrical and hydrogeological parameters to assess aquifer productivity in Udi LGA, Enugu State, Nigeria. International Research Journal of Geology and Mining (IRJGM) (2276-6618). 3(1), P. 9-18.
- Aizebeokhai A.P, Kehinde D. O. and Emmanuel S. J. (2016). Electrical resistivity and induced-polarization imaging for groundwater Exploration. SEG International Exposition and 87th Annual Meeting. 2486 – 2491. https://doi.org/10.1190/segam2016-13857737.1
- Andrea U. and Vagner R. E., (2018). Resistivity and Induced Polarization Application for Urban waste disposal site studies., Applied Geophysics with case studies of environmental and engineering Geophysics. P. 1-20. https://doi.org/5772/intechopen.81225.
- Danga, O.A. and Tijani, M.N. (2020). Hydro-geophysical Investigation of Saltwater Intrusion: A case study of Coastal Aquifers of Lagos State, Southwestern Nigeria. NMGS Ibadan 2020 Special Proceeding Publication, P. 123-128.
- Martinho, E. (2023). Electrical resistivity and Induced Polarization methods for environmental investigations: An overview. Springer, P. 234. https://doi.org/10.1007/s11270-023-06214-x
- Siti Lieyana Azffri, Mohammad Faizan Ibrahim and Stefan Herwig Gödeke, (2022). Electrical resistivity tomography and induced polarization study for groundwater exploration in the agricultural development areas of Brunei Darussalam. Environmental Earth Sciences 81, P. 233.
- Alao, J. O., Ayejoto, D. A., & Abubakar, F. (2024a). Environmental Burden of Waste Generation and Management in Nigeria. In: Souabi, S., Anouzla, A. (eds) Technical Landfills and Waste Management. Springer Water. Springer, Cham. P. 27-56. https://doi.org/10.1007/978-3-031-55665-42.
- Odong, P. O., Ebong, E.D., Awak, E.A. et al., (2024) Integrated geophysical and hydrogeochemical characterization of groundwater vulnerability conditions in part of Ikom-Mamfe Embayment, southeastern Nigeria. Sustain Water Resource. Manag. 10, P. 120. https://doi.org/10.1007/s40899-024-01094-3
- Kotra, K.K. Israel, Y., Surendra, P. and Sowjanya, P. (2016). Integrated Geophysical and Geochemical Assessment for Comprehensive study of the Groundwater. Water Air and Soil Pollution, An International Journal of Environmental Pollution, 227(6), P.1-16. https://doi.org/1007/s11270-016-2902-3.
- Okereke, I.D. and P. Harcourt, (2012). Electrical resistivity investigation of solid waste dumpsite at rumuekpolu in obio akpor L. G. A, Rivers State, Nigeria 1(11), P. 631–637.
- Okpoli, C.C. (2013). Application of 2D electrical resistivity tomography in landfill site: a case study of iku, ikare akoko, southwestern Nigeria, Hindawi–J. Geolog. Res. https://doi.org/10.1155/2013/895160.
- Veronica, P., Stefano, M. and Riccardo, F. ((2019). A review of the advantages and limitations of geophysical investigations in landslide studie, Hindawi @ Int. J. Geophysics. 27. https://doi.org/10.1155/2019/2983087.
- Sharma, A., Ganguly, R. and Gupta, A.K. (2020). Impact assessment of leachate pollution potential on groundwater quality: an indexing method, J. Environ. Eng. 146 (3), https://doi.org/10.1061/(ASCE)EE.1943-7870.0001647.
- Omada J.I., Omali A. and Awodi J.O. (2009). Physicochemical characteristics of surface water in parts of Lokoja Metropolis, Central Nigeria. Water resources. Journal of the Nigerian Association of Hydrogeologists. 19: Pp. 56-62.
- Obaje N.G. (2009). Geology and Mineral Resources of Nigeria. Lecture notes in earth sciences, Springer Dordrecht Heidelberg, London and New York., 221, P. 96–103.
- Akande, S.O., Ojo, O.J. and Ladipo, K., (2005). Upper Cretaceous Sequences in the Southern Bida Basin, Nigeria. A Field Guidebook. Mosuro Publishers, Ibadan 2005a, 60.Search in Google Scholar.
- Adewale, F.O. and Love J. (2018). Recent Changes in Onset and Cessation Dates of Rainfall and their Effects on Farming Activities in Sub Urban Areas of Lokoja, International Journal of Social Sciences (IJSS), no 2, vol.12. P. 34 -54, https://www.researchgate.net/publication/332514220.
- Ojoina O.A. (2014). Hydrogeophysical investigation of groundwater in Lokoja Metropolis, Kogi State, Central Nigeria. J Geography and Geol 6(1), P. 81-95. ISSN 1914-9779.
- Grifith, D. H., and Barker R.D. (1993). Two-dimensional resistivity imaging and modelling in areas of complex Geology. Journal of Applied Geophysics, 29(2-3), P. 211-225. https://doi.org 10.1016/0926-9851 (93)90005-5.
- Loke, M.H., (2011). Electrical resistivity surveys and data interpretation. in Gupta, H (ed.), Solid Earth Geophysics Encyclopedia (2nd Edition) “Electrical & Electromagnetic” Springer-Verlag, P. 276- 283.
- Telford, E., Geldart, W.M., Sheriff, R.E., (1990). Applied Geophysics. Cambridge University Press, UK.
- Koefoed, O., (1979). Ground Sounding Principle 1: Resistivity sounding measurements, Amsterdam: Elsevier Science Publishing Company.
- Keller, G. V., and Frischknecht, F. C. (1996). Electrical Method in Geophysical Prospecting. Pergamon Press Inc., Oxford.
- Kearey, P., Brooks, M. and Hill, I., (2002). An Introduction to Geophysical Exploration. Brackwell Science LTD., Oxford, UK.
- Murali, S. and Patangi, N. S. (2006). Principles and Application of Groundwater Geophysics for assessing groundwater pollution due to municipal solid waste disposal. Journal of Environmental Hydrology, 3rd Edition Association of Exploration Geophysicists, Hyderabad. (14), P. 1-12.
- Ekeocha, N.E., Okereke, I., Okonkwo, S. (2012). Electrical resistivity investigation of solid waste dumpsite at rumuekpolu in obio akpor L.G.A., rivers state, Nigeria, Int. J. Sci. Technol. 1 (11) (2012) P. 631–637.
- Piper A.M. (1994). A graphical procedure in the geochemical interpretation of water analysis. American Geophysical union Transaction, 25(6), P.914-923.
- Durove, S.A. (1948). Natural waters and graphical representation of their composition. Doklady Akademi Nauk SSSR, 59(6), P. 87-90.
- Stiff, H.A. (1951). The interpretation of chemical water analysis by means of patterns. Journal of petroleum Technology, 3(10), P. 15-17.
- Kizito O. M., Ikenna A. O., Aaron E. A., Solomon S. J., Ernest O. A., Fabian A and Jacob B. J. (2023). Integrating geoelectrical and borehole data in the characterization of basement-rock aquifers in the Lokoja area, northcentral Nigeria. Geosystems and Geoenvironmental journal: www.elsevier. com/locate/geoge. https: doi.org/10.1016/j.geogeo. 2023.100217
- Ayolabi, E.A., Odusote, O.E., and Awoyemi, M.O. (2009), Integrated geophysical investigation of subsurface using resistivity and Induced Polarization methods. Journal of Applied Sciences Research, 5(11), P. 2021-2032.
- Wynn, J.C., and Shirly J.E. (1975). Induced Polarization effects in clay-bearing rocks. Geophysics, 40(3), P. 391-401
- WHO, H.O. (2017). Guidelines for Drinking-Water Quality: Fourth Edition Incorporating the First Addendum, Licence, Geneva, 2017. CC BY-NC-SA 3.0 IGO, https:// apps.who.int/iris/bitstream /handle/10665/254637/9789241549950-eng.pdf? sequence.
- Ahmed, A.T., Alluqmani, A.E., Shafiquzzaman, M. (2018). Impacts of landfill leachate on groundwater quality in desert climate region, Int. J. Environ. Sci. Technol. https://doi.org /10.1007/s13762-018-2124-x.
- Kumar, P., and Sharma, S. (2019). Health risks associated with high TDS in groundwater. Journal of Water and Health, 17(3), P. 537-546. https://doi.org:10.2166/ wh.2019,134.
- Kumar, P., Kumar, V., & Sharma, S. (2017). Water Quality Assessment of Groundwater in Rural Areas of Punjab, India. Journal of Environmental Science and Health, Part B, 52, P. 439-447.
- International Agency for Research on Cancer (IARC). (2019). Some Chemicals Used as Solvents and Polymer Manufacture. IARC Monographs on the evaluation of Carcinogenic Risks to human, P. 122.
- Agency for Toxic Substances and Disease Registry (ATSDR). (2020). Toxicological Profile for Volatile Organic Compounds (VOCs). U.S. Department of Health and Human Services, Public Health Service.
- Freeze, R. A., & Cherry, J. A. (1979). Groundwater. Prentice-Hall, Englewood Cliffs, New Jersey.
- Kumar, P., Sharma, B., and Ganguly, R. (2020) Lead contamination on groundwater and its impact on human health: A review. Journal of Environmental Science and health, Part B, 55, 347-358. https://doi.org 10.1080/03601234.2020.1711523.