
Object Defect Detection Using Histogram Analysis and Spearman’s Correlation Coefficient
- Md. Mojahidul Islam
- Ahsan-Ul-Ambia
- A.O.M Asaduzzaman
- Md. Shohidul Islam
- Md. Atiqur Rahman
- 137-142
- Apr 27, 2024
- Computer Science
Object Defect Detection Using Histogram Analysis and Spearman’s Correlation Coefficient
Md. Mojahidul Islam, Ahsan-Ul-Ambia, A.O.M Asaduzzaman, Md. Shohidul Islam, Md. Atiqur Rahman
Dept. of Computer Science & Engineering, Islamic University, Kushtia, Bangladesh
DOI: https://doi.org/10.51244/IJRSI.2024.1104010
Received: 04 March 2024; Revised: 17 March 2024; Accepted: 23 March 2024; Published: 27 April 2024
ABSTRACT
In modern manufacturing industry, Automatic defect detection is becoming an attractive alternative to Human Inspection. Automatic defect detection on object surfaces is a compelling process. For accurate automated inspection and classification, computer vision image processing system has been widely used in manufacturing industries. In this article, we proposed histogram based automatic defect detection that process three objects at a time. In the first step we collect image from the camera, perform preprocessing, segmentation then we used histogram and Spearman’s correlation coefficient to find the defect or non-defect objects. The experimental analysis was evaluated on 300 images including defective and non-defective objects.
Key words: Computer vision, Defect detection, Segmentation, Histogram analysis, Spearman’s correlation.
INTRODUCTION
Surface defect detection has become an important work for manufacturers who strive to enhance the product quality and manufacturing efficiency [1-3]. Surface defects can affect not only the appearances of products but also their functionality, stability, safety, etc. Nowadays, skilled human inspectors use bright lights to detect defects in manufactured objects. The manual process of defect detection is worldly and highly reliant on the experience of human investigators, which cannot ensure the quality of the product. Furthermore, prolonged exposure to bright lights is harmful to human health. As a result, automatically inspecting object defects has become an important issue, and computer vision can play a critical role in this field. This work has been inspired by the need for an automatic defect detection strategy that identify the defect of the objects using machine vision because machine vision has made great advances in the past few decades. There are different types of challenging issues that must be considered when design a defect detection system: One of the primary challenges in object defect detection is the variability and complexity of defects, which can make it difficult to develop generalized detection models. Another challenge is the availability of labeled training data, especially for rare or unique defects, which can limit the performance of supervised learning approaches. Real-time processing requirements in industrial settings pose additional challenges, necessitating the development of efficient and scalable detection algorithms.
This work is concerned with an attempt to develop quality inspection system that used reference images and current inspection image. In general, quality inspection systems can determine whether an object’s surface matches the reference surface and thus meets the required product quality.
Although a human being can often distinguish a “good” printed image from a “bad” one without having a previous reference, but in many other situations a reference is essential. Furthermore, the task of detecting defects without a reference is almost infinitely complex. This means that quality inspection systems require a reference image. The general flow diagram of our proposed system is shown in below.
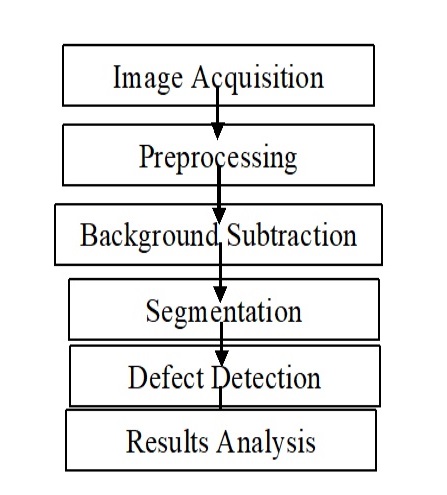
Fig. 1: The general structure of our proposed method.
Our proposed defect detection system can process three objects at a time. This system can be used in steel surface defect defection, titles surface defect detection and others general application in manufacturing industries.
RELATED WORKS
Object defect detection plays a crucial role in various industries such as manufacturing, quality control, and product inspection. Detecting defects accurately and efficiently is essential for ensuring product quality, reducing waste, and maintaining customer satisfaction. In recent years, there has been significant research interest in developing advanced techniques and methodologies for object defect detection. This literature review aims to provide an overview of the existing literature on object defect detection, including different approaches. Traditional methods for object defect detection often rely on manual inspection or simple automated techniques. While these methods are straightforward, they may lack robustness and accuracy, especially when dealing with complex defects or variations in lighting conditions. Anomaly detection techniques focus on identifying deviations from normal patterns rather than explicitly detecting predefined defects. Statistical methods, such as Gaussian Mixture Models (GMM) and Support Vector Machines (SVM), have been utilized for anomaly detection in various applications. Recent advancements in deep learning, such as Generative Adversarial Networks (GANs) and Variational Auto-encoders (VAEs), have shown promise in detecting anomalies in complex data distributions. The Otsu [5] algorithm is one of the best method for threshold selection in image processing applications. This algorithm partition an image into background and foreground classes. The authors in [6] utilize Neural Networks and Mutual information to identify the texture attribute from a tissue image. Literature [7] detect magneto-optical images defect by using cosine similarity to verify the image periodic variation by utilizing the color moment feature of the image. The paper [8] used SVM and color histogram methods to identify the defect from the particle boards. The literature [9] combined FSIFT and color moment features to detect the defect of the tile surface. This work focuses on defect detection in ceramic tiles using image processing techniques. The authors develop algorithms for preprocessing, feature extraction, and defect classification, demonstrating the effectiveness of their approach in detecting various types of defects in ceramic tile production lines.
IMAGE ACQUISITION SYSTEM
A digital camera is fixed in the tripod and positioned to view normal to the inspection table. The samples were placed under the camera keeping the relative position and zoom level (1x) unchanged. Three hundred sample images (hundred from each class) with fixed resolution and JPG format were captured. Several lighting methods are explored. Initially with background lighting, flash lighting and top lighting were tried. Finally, the diffused lighting gave the better-quality image and was selected. A HP Laptop computer with Intel Core i7 processor and 8 GB RAM was used for processing the data. Coding and processing were carried out in MATLAB R2015b software.
IMAGE PREPROCESSING
Before enter the segmentation and detection phase some preprocessing tasks are accomplished. In this step, cropping the image by crop image with dimensions x=620 and y =320. The cropped image ti (x,y) is preprocessed with the fuzzy based filter for restoring images corrupted by additive noise [3]. Next, apply a Spatial Smoothing (2D FFT) to reduce the effects of the background.
Image background Subtraction: To remove the background from the original image, we first compute the red, green and blue channel value using (1), and also find the background information using (2),
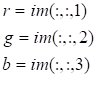 (1)
(1)
b=g-r*b (2)
Finally, we used ostu [5] method to segment the foreground from the original image.
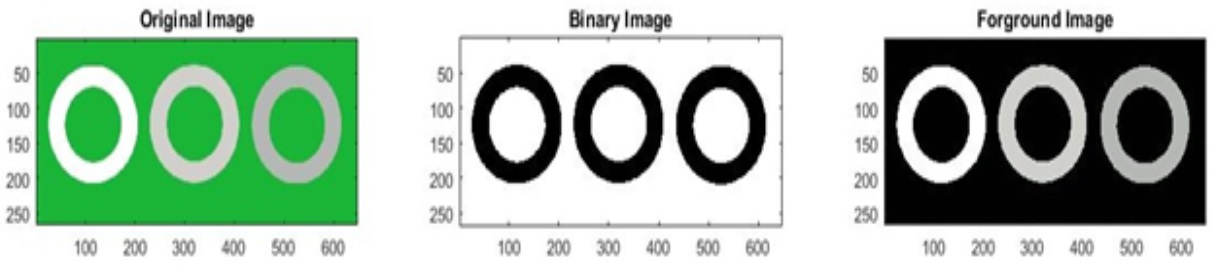
Fig. 2: The original image and corresponding foreground image.
SEGMENTATION
The process of digitization is important for the proposed system. In this system the captured image is saved in a disk file. The image data is extracted from file to convert into data file. The data file consists of gray level values. The segmentation process is almost impossible dealing with those data. To make the segmentation process easy threshold value T was used to convert image data file into binary form as below:
![]() (3)
(3)
Boundary Selection
The segmented files have no appropriate boundary. So, it is needed to detect the appropriate boundary of the file for further processing. In this section an appropriate boundary is detected by used horizontal projection profile and vertical projection profile method. The boundary of the file is found by scanning from top to bottom for upper borderY1, left to right for left border X1, bottom to top for lower border Y2 and right to left for right border X2. The searching is started from left top corner of the specific binary text files.
The horizontal projection profile used to fine the top and bottom row of the image boundary is shown in figure 3:
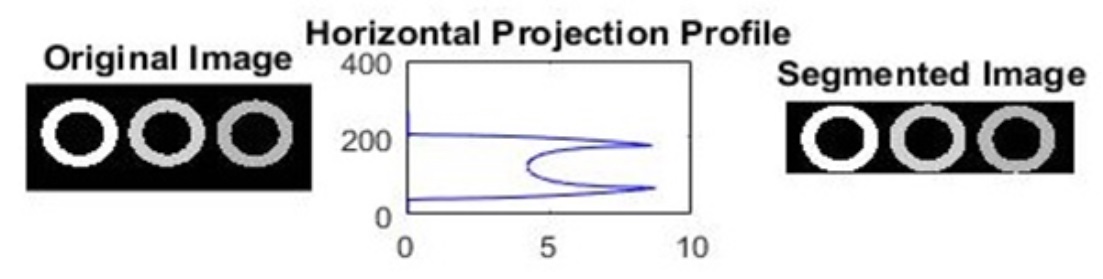
Fig. 3: Horizontal projection profile and corresponding segmented image.
The vertical projection profile used to fine the left and right boundary of the image shown in figure 4:
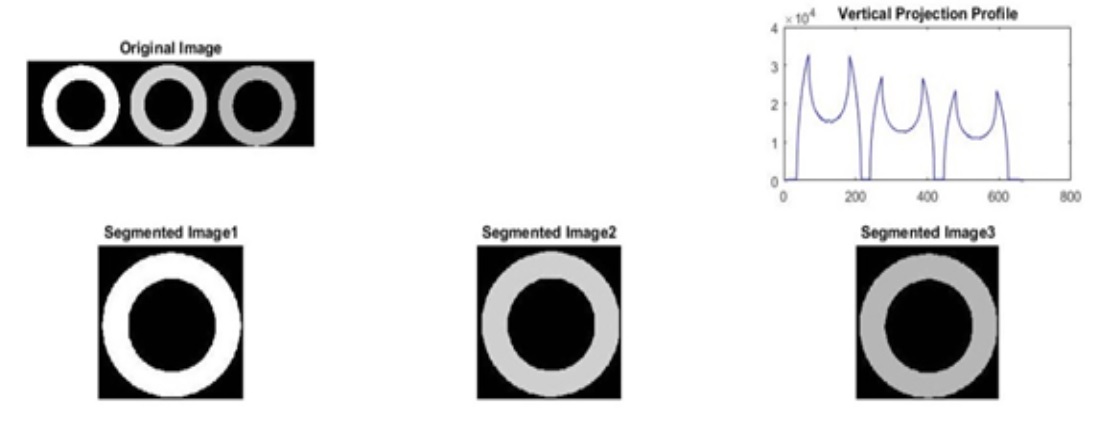
Fig. 4: Vertical projection profile and corresponding segmented image.
EXPERIMENT AND RESULTS
To find the dissimilarity of the image, firstly we find the mean value using the following equation,
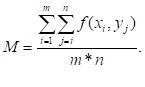 (4)
(4)
We find the mean value for all images and show that the mean value of the non-defected objects is higher than the mean value of the defected object.
Secondly, we process the histogram of the images. Histogram is the process to visualize the predominant intensities of an image. The histogram algorithm counts the total number of pixels at a specific intensity. In a plot, the x-axis represents the intensity value, while the y-axis represents the total amount of pixels with the corresponding intensity value.
The following figure shows the histogram of the defect and non defect object.
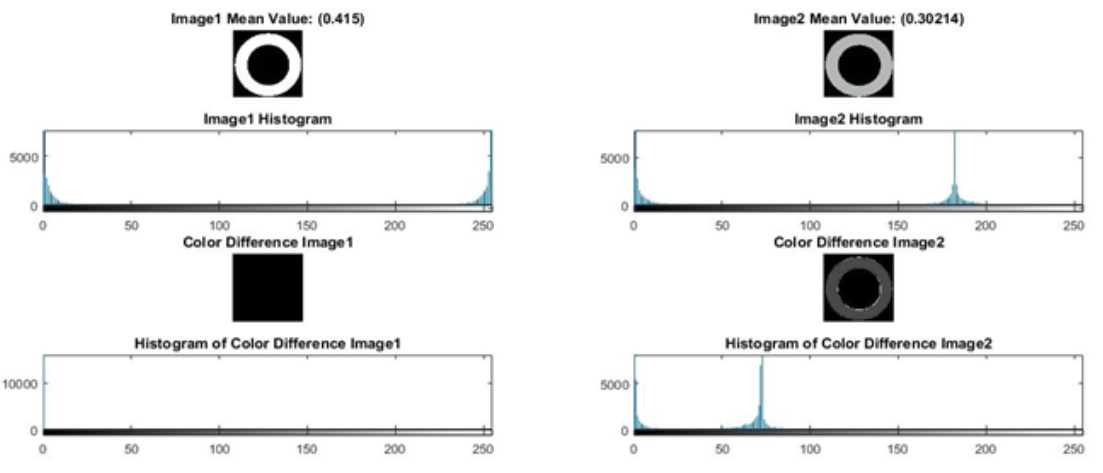
Fig. 5: Histogram analysis of the image.
Finally, we used the Spearman’s correlation coefficient to find difference between the reference image and input image.
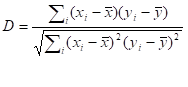 (5)
(5)
Where x and y are the reference and input image respectively, the subscript indices i refer to the pixel location in the image.
We use statistical measures based on sensitivity and specificity analysis [4] to assess the accuracy and efficacy of the proposed methods. The detection rate of the system is computed as follows:
Accuracy=  X100% (6)
Where TP and TN respectively are the number of the detected samples with and without defects; Nd and Nn are the total number of defect and non- defect samples respectively.
CONCLUSION
In this paper, a histogram-based vision system is developed for the purpose of object defect detection. Experimental analysis displayed that the proposed defect detection technique is effective. The average defect detection recognition rate is 96.89%. This research can take part in developing a computer-aided decision (CAD) system for automatic object defect detection. Future researcher could integrate multiple sensor modalities, such as vision, infrared, and acoustic, could enhance defect detection performance, especially in challenging environments. Exploring novel techniques such as self-supervised learning and semi-supervised learning may alleviate the need for large, labeled datasets and improve generalization capabilities.
REFERENCES
- J. Luo, Z. Zhang, Automatic colour printing inspection by image processing, J. Mater. Process. Technol. 139 (2003), 373–378.
- S. B. Dworkin, T.J. Nye, Image processing for machine vision measurement of hot formed parts, J. Mater. Process. Technol. 174 (2006), 1–6.
- M. S. Nair, G. Raju, Additive noise removal using a novel fuzzy-based filter, Computers & Electrical Engineering, 37 (2011), 644–655
- M. Burset, R. Guigó, Evaluation of gene structure prediction programs. Genomics 34 (3), 353–367.
- N. A Otsu, Threshold selection method from gray level histogram. IEEE Transactions on Systems, Man and Cybernetics, 9(1), 62-66 (1979).
- G. A. Azim and S. Nasir, Textile Defects Identification Based on Neural Networks and Mutual Information. International Conference on Computer Applications Technology (ICCAT), Sousse Tunisia, 20-22 January 2013.
- N. Ma, X. Gao, C. Wang, Y. Zhang, D. You, N. Zhang, Influence of Hysteresis Effect on Contrast of Welding Defects Profile in Magneto-Optical Image. IEEE Sens. J. 2020, 20, 15034–15042.
- P. Prasitmeeboon, H. Yau, Defect Detection of Particleboards by Visual Analysis and Machine Learning. In Proceedings of the 2019 5th International Conference on Engineering, Applied Sciences and Technology (ICEAST), Luang Prabang, Laos, 2–5 July 2019; pp. 1–4.
- J. H. Li, X.X. Quan, Y.L. Wang, Research on Defect Detection Algorithm of Ceramic Tile Surface with Multi-feature Fusion. Comput. Eng. Appl. 2020, 56, 191–198.