
Progress in Key Interventions for Reproductive and Maternal Health in High Priority Districts, India: Evidence from NFHS-4 and NFHS-5
- Shilpa Chaudhary
- Padma Suresh Mandala
- 133-144
- Feb 28, 2025
- Education
Progress in Key Interventions for Reproductive and Maternal Health in High Priority Districts, India: Evidence from NFHS-4 and NFHS-5
Shilpa Chaudhary & Padma Suresh Mandala
Janki Devi Memorial College, University of Delhi, New Delhi, India
DOI: https://doi.org/10.51244/IJRSI.2025.121500012P
Received: 18 January 2024; Accepted: 28 January 2025; Published: 01 March 2025
ABSTRACT
This paper assesses progress in key reproductive and maternal health (RMH) interventions in 190 high-priority districts (HPDs) across states and union territories in India using data from National Family Health Survey (NFHS) Rounds 4 and 5. The analysis of district-level performance across RMH indicators reveals the disparities and unequal progress across HPDs with results indicating a deterioration in RMH indicators in a larger number of HPDs in the non- Empowered Action Group (EAG) states compared to EAG states. The results also suggest that while some HPDs have made progress there is scope for considerable improvements in many districts that have exhibited limited progress. The cross-sectional district-level regression analysis indicates that the improvement in RMH outcomes is constrained by the poor economic status of households and the low status of women. Health infrastructure and the quality of healthcare services are also important determinants. The rising out-of-pocket expenditure in public health facilities shows the need for affordable reproductive and maternal healthcare facilities for low-income groups. The review of progress between 2015-16 and 2019-21 highlights the need for concerted district-level policy action on the indicators that show poor or regressive performance in HPDs to achieve the SDG goals in reproductive and maternal healthcare.
Keywords: High-priority districts, Reproductive and maternal health, SDG Goal 3, India
INTRODUCTION
Reproductive and maternal health (RMH) is an important determinant and indicator of overall health of a country. As part of SDG-3, UN (2015) which targets good health and well-being, SDG 3.1 aims to reduce the global maternal mortality ratio to less than 70 per 100,000 live births by 2030, the two indicators being Maternal Mortality Ratio (MMR) and proportion of births attended by skilled health personnel. SDG 3.7 aims at achieving universal access to sexual and reproductive healthcare services by 2030, the two indicators being the proportion of women of reproductive age (aged 15-49 years) who have their need for family planning satisfied with modern methods and adolescent birth rate. Target 2.2 aims to end all forms of malnutrition by 2030, an important indicator related to women being the prevalence of anaemia in women aged 15 to 49 years.
The global MMR declined from 339 deaths per 100,000 live births in 2000 to 227 in 2015 to 223 in 2020 (WHO 2024). Although India’s MMR declined from 122 in 2015-16 to 97 in 2019-21 (SRS 2019 and SRS 2022), large inequalities across and within states and union territories persist. In 2013, the Ministry of Health and Family Welfare identified 184 districts out of a total of 640 districts as High-Priority Districts (HPDs) with the intention of targeted action under the National Health Mission to improve performance in districts that were most lagging in reproductive, maternal, and newborn health outcomes (GoI 2015 and NRHM 2013). These districts were to be provided with priority funding and more human resources including relaxation of norms in the appointment of health personnel like ASHA workers. Six districts from Uttar Pradesh were added to the list in 2015 taking the total count of HPDs to 190 (Girase et al 2015). The Empowered Action Group (EAG) of states was established in 2001 for greater focus and attention focus to assist, monitor, and facilitate the attainment of Millenium Development Goals in the poor performing states- Rajasthan, Uttar Pradesh, Uttarakhand, Bihar, Jharkhand, Madhya Pradesh, Chhattisgarh, and Orissa. The HPDs include 95 districts from the EAG states and Assam, that share similar demographic characteristics as that of EAG states and is often grouped with EAG states; and 95 from the non-EAG states. The attainment of SDGs by India crucially depends on improvements in health indicators in the poorest-performing areas.
This paper assesses the progress in interventions related to RMH in the high-priority districts across states and union territories in India for National Family Health Survey (NFHS) Rounds 4 and 5 and examines the impact of socio-economic factors, status of women, and health infrastructure on RMH using NFHS-5 data. Although there is literature available on select health outcomes in select HPDs in select states, this study seeks to fill the gap in the literature by studying the progress in RMH in all 190 HPDs across India for the two latest NFHS rounds.
LITERATURE REVIEW
Balarajan et al (2011) find that health disparities in India continue to exist due to factors such as socioeconomic status, geographical location, and gender and that they are further exacerbated by significant as well as rising out-of-pocket costs, even though there have been improvements in healthcare provision and services over the years. Ramesh et al (2020) using NFHS-4 data observe that the district prioritizing has been effective as the coverage for important maternal and neonatal health services improved much more in HPDs than in non-HPDs post the creation of the HPDs category and that the EAG states have benefited more than non-EAG states. Wadhwa et al (2018) examine the progress in adolescent health in twenty-six HPDs in six states for 2015-2017 and find an improvement in the willingness and efforts of state governments and an improvement in intervention facilities related to adolescent health services. Prakash et al (2021) use data from a decision-tracking system and routine health management information system for 2017 to 2019 covering twenty-five HPDs in the state of Uttar Pradesh and conclude that the districts which used routine health management data conducted monthly review meetings, and had high actions completion rates showed greater improvements in health outcomes hence emphasizing the need for evidence-based review platforms and use of routine health monitoring system data. Jayanna et al (2016) found the onsite mentoring program led by nurses in improving the quality of care in primary health centres related to institutional births in two HPDs in Karnataka effective in improving preparedness and facility readiness. Mustafa and Shekhar (2021) constructed a district-level Facility Index in PHCs and found that the index was positively associated with healthcare provided by PHCs thereby highlighting the need to improve quality and availability of facilities at PHCs. Tripathi et al (2024) undertook a facility assessment of sample health and wellness centres in select districts in Chhattisgarh, including three out of five HPDs, and found that a majority of these centres achieved readiness in terms of the essential inputs required for service delivery. Verma and Dash (2020) showed, for Poonch, an HPD in Jammu and Kashmir, how the application of GIS technique can be used to find the distance gaps and travel time to healthcare facilities that can then facilitate evidence-backed planning to improve healthcare in remote parts of the country.
Sanneving et al (2013) examined the interrelationship between pregnancy complications and the use of healthcare services and found a lower incidence of complications related to pregnancy and delivery among women who avail full antenatal care as compared to the non-users. Gogoi et al (2014) use data from the third round of the District Level Household and Facility Survey for Assam and find a high incidence of more than 50% of women reporting any complication during pregnancy and delivery, higher incidence of pregnancy-related and delivery complications compared to post-delivery complications and lower incidence of complications among women who received full antenatal care during pregnancy, thereby highlighting the importance of antenatal care. Ghosh and Ghosh (2020) use NFHS-2 and NFHS-4 data to examine the contribution of India’s National Health Mission (NHM) to maternal health and find rates of institutional deliveries and use of ANC to be much higher in the post-NHM period as compared to the pre-NHM period, and also a persistence of inter-state as well as intra-state disparities. Vidler et al (2016) used focus groups and individual interviews for Karnataka in 2012–2013 to assess maternal care services and emphasize the need for community-based initiatives to encourage early disclosure of pregnancies and to spread information about the importance of antenatal care in health facilities. They found an increase in the use of maternity care services that can be attributed to new government schemes and increased availability of maternity services but there is a need to improve infrastructure in the health facilities. Zere et al (2013) analyzed 2007 Bangladesh demographic and health survey data and found significant wealth inequalities in the maternal health indicators such as antenatal care, skilled birth attendance, and delivery in health facilities but did not find any wealth-related inequalities in the use of modern contraceptive methods. Pasa et al (2024) compare the reproductive health status of 29 states by constructing a reproductive health index using NFHS-4 and NFHS-5 data for fertility rate, infant mortality rate, childbirth order, mother-and-child delivery care, and female education. They found an improvement in the index but a slow pace of progress.
METHODS
Data sources
NFHS-4 initiated the provision of district-level estimates for many important indicators. The data on household profile, characteristics of women, marriage, fertility, current use of family planning methods and the unmet need thereof, quality of family planning services, maternity and delivery care, and anaemia for 190 HPDs is taken from state and district factsheets for NFHS-4 and NFHS-5 published by IIPS (IIPS and ICF 2017, 2020, 2021). These nationally representative surveys used a stratified two-stage sampling design. NFHS-4 collected data from a total sample size of 601509 households, 699686 women of age 15-49 and 112122 men of age 15-54. A total of 636699 households, 724115 women, and 101839 men were interviewed in NFHS-5.
As the data on district-level MMR is not available, the data on MMR for states was sourced from Sample Registration System (SRS) (2019) and SRS (2022). The district-level population figures and the percentage of rural, scheduled caste, and scheduled tribe population are extracted from Dhar (2022). District-level multidimensional poverty index for the two time periods is accessed from NITI Aayog (2023). The number of district-wise primary health centres is taken from Rural Health Statistics 2020-21 (MoHFW 2021).
Data Analysis
The trends in RMH from 2015-16 to 2019-21 are studied using scatter diagrams with a 45-degree line that separates the districts that show an improvement in the said parameter (shown in colour blue) as against those that exhibit a deterioration (shown in colour red). The progress of districts in various RMH parameters is presented on the district-level map of India. Further, we conduct a multivariate cross-sectional robust regression to explore the determinants of RMH for NFHS-5 and also report the beta coefficients from the standardized regression. We construct three indices for regression purposes. A district-level Reproductive and Maternal Health Index (RMHI) is constructed as the simple arithmetic mean of the six indicators- the percentage of currently married women aged 15–49 years using modern family planning methods, the percentage of mothers who had an antenatal check-up in the first trimester, percentage of mothers who had at least four antenatal care visits, percentage of mothers who consumed iron folic acid for 100 days or more when they were pregnant, percentage of births attended by skilled health personnel and percentage of mothers who received postnatal care from a doctor/nurse/LHV/ANM/midwife/other health personnel within two days of delivery. The Standard of Living Index (SLI) is constructed as the geometric mean of the percentage of households in the district with electricity, improved drinking water sources, improved sanitation facilities, and clean fuel for cooking. Women’s status index (WOM_ST) is constructed as an average of the percentage of women in the district with ten or more years of schooling and the percentage of women married before 18 years of age, the latter converted into a positive variable by subtracting it from 100.
RESULTS
Trends in RMH indicators: All states, except Uttarakhand and West Bengal, report a reduction in MMR between 2015-17 and 2018-20 (Figure 1). While eight states- Kerala, Maharashtra, Telangana, Andhra Pradesh, Tamil Nadu, Jharkhand, Gujarat, and Karnataka have achieved an MMR lower than the SDG goal of 70, other states lag with the highest MMR in Assam (195) followed by Madhya Pradesh (173) and Uttar Pradesh (167). EAG states have much higher MMR than the SDG target as well as the all-India average.
Table 1 presents the summary statistics of RMH indicators for HPDs and the distribution of districts with regressive performance across EAG and non-EAG states. All indicators except the prevalence of anaemia have shown an overall improvement in NFHS-5 as compared to NFHS-4. For positive indicators such as births attended by skilled health personnel, adoption of modern family planning methods, antenatal and postnatal care, and quality of family planning (QFP) services, the mean has increased and the standard deviation has declined, except for folic acid intake that shows an increase in variability. Among negative indicators- early marriage, early childbearing, and total unmet need – have shown a downward trend in mean as well as standard deviation (Table 1, columns 3 and 4). Several districts have reported a deterioration in their RMH performance between the two time periods (Table 1, columns 5a-5b and Figure 2). The deterioration is least for postnatal care (14 districts) followed by SBA (16 districts) while deterioration is highest for the prevalence of anaemia (116 districts) followed by QFP services (62 districts). It is noteworthy that while EAG states have an equal representation in the HPDs, it is the districts from the non- EAG states that are over-represented in the group of districts showing a regressive performance in RMH indicators.
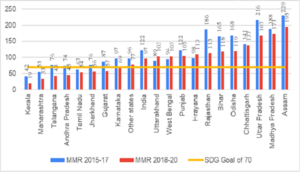
Fig 1: State Wise MMR, 2015-17 and 2018-20 (arranged in ascending order of 2018-20 MMR) Source: Author’s compilation from SRS (2019) and SRS (2022)
Table 1: Summary Statistics of SDG indicators and key interventions
| S N0 (1) | RMC indicator (2) | NFHS-4 (3) | NFHS-5 (4) | Number of districts reporting deterioration (5a) (5b) | ||
| EA Gstates | Non- EAG states | |||||
| 1 | Births attended by skilled health personnel (SBA) | Min:12.4, Max: 100 Mean:71.5, SD:17.9 | Min:30.9, Max:100 Mean:84.8, SD:11.8 | 2 | 14 | |
| 2 | Percentage of currently married women age 15–49 years using modern family planning methods (MFP) | Min: 2.7, Max:79.2 Mean:39.7, SD:17.7 | Min:12.3, Max:78.5 Mean: 51.6, SD:13.9 | 11 | 24 | |
| 3 | Total unmet need (%)
(UNMET) |
Min: 1.9, Max:32.6
Mean:15.7, SD:6.9 |
Min:1.2, Max:27.7
Mean:10.4, SD:5.6 |
12 | 24 | |
| 4 | Quality of Family Planning Services: Health worker ever talked to female non-users about family planning (%) (QFP) | Min: 3.7, Max:45.9
Mean:17.9, SD:8.9 |
Min:3.1, Max:52.7 Mean:24.1, SD:10.4 | 15 | 47 | |
| 6 | Mothers who had antenatal check-up in the first trimester (%) (ANC-FT) | Min: 4.1, Max:96.9 Mean:51.8, SD:18.4 | Min:26.3, Max:97.7 Mean:68.4, SD:14.5 | 9 | 22 | |
| 7 | Mothers who had at least 4 antenatal care visits (%) (ANC_4) | Min: 0.8, Max:93.2 Mean:42.4, SD:24.3 | Min:4.4, Max:97.7 Mean:55.3, SD:19.9 | 8 | 30 | |
| 8 | Mothers who received Postnatal care from a doctor/nurse/LHV/ ANM/ midwife/other health personnel within 2 days of delivery (%) (PNC) | Min: 5, Max:93.8 Mean:52.4, SD:18.2 | Min:25.6, Max:98.6 Mean:73.4, SD:15.4 | 5 | 9 | |
| 9 | Mothers who consumed iron folic acid for 100 days or more when they were pregnant (%) (IFA) | Min: 0.8, Max:80.9 Mean:25.8, SD:17.9 | Min:1.6, Max:94.2 Mean:41.4, SD:21.4 | 6 | 22 | |
| 10 | Women age 20-24 years married before age 18 (%) (EM) | Min: 4, Max:74.5 Mean:29.6, SD:13.5 | Min:2.5, Max:55.4 Mean:23.8, SD:12.3 |
23 |
27 |
|
| 11 | Percentage of women age 15-19 years who were already mothers or pregnant at the time of the survey (ECB) | Min: 0.6, Max:29.5 Mean:8.9, SD:5.4 | Min:0, Max:27.3 Mean:7.2, SD:5.1 | 22 | 34 | |
| 12 | Percentage of all women age 15-49 years who are anaemic (W_AN) | Min: 16, Max:83.2 Mean:52.1, SD:13.3 | Min:21.9, Max:92.8 Mean:56.4, SD:12.3 | 52 | 64 | |
| 13. | Average OOP per delivery in public health facility (Rs.) (OOPE) | Min:323, Max:31457 Mean:3094, SD:3447 | Min:193, Max:13190 Mean:3178, SD:2419 | 68 | 57 | |
Source: Authors’ compilation
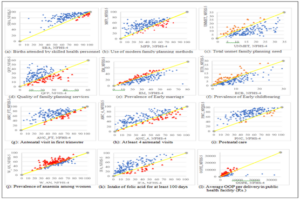
Figure 2: Distribution of districts by performance in key interventions, NFHS-4 and NFHS-5
Source: Authors’ construction. Note: The yellow line is the 45-degree line
As observed in Figure 2(a), the clustering of districts (45-degree line in yellow) towards the top-right corner, shows that most HPDs made tremendous progress towards achieving universal access to skilled health personnel during childbirth. Figure 2(b)-(d) shows the slow pace of progress in the use of modern family planning methods and a reduction in unmet needs, combined with a not-so-promising trend exhibited for quality of family planning services captured by health workers talking to female non-users about MFP with a clustering of districts around the bottom-left corner. While Figure 2(e)-(f) shows a sluggish downward trend in early marriage, they indicate a promising declining trend in early childbearing as seen in the bottom-left clustering of districts for the latter. Figure 2(g)-(i) depicts the distribution of districts for antenatal and postnatal care. While there is progress in antenatal visits in the first trimester of pregnancy, the progress in achieving at least four antenatal visits is far from satisfactory, Also, there is a striking contrast in the progress achieved in postnatal care vis-à-vis antenatal care, with the former nearing universal coverage. Figure 2(j)-(k) shows the deterioration in anaemia situation among women and low levels of folic acid intake during pregnancy for at least 100 days as confirmed by the clustering of district scatter points towards the bottom left for the latter. Figure 2(l) shows that the average OOP per delivery in a public health facility has gone up between the two time periods in 125 districts, with 68 of these belonging to EAG states. A positive lining is that the OOPE that was quite high in the NFHS-4 period for some districts has substantially come down, showing the greater reach of government schemes for maternity services over the years.
Trends in RMH index: The progress in RMHI and its components is presented in Figure 3, with Figure 3(a) giving the distribution of districts with coverage less than 50%, 50%-67%, and more than 67% across the six components of RMHI for NFHS-4 and NFHS-5 periods. Significant progress is observed in SBA with 175 districts out of 190 having achieved more than two-thirds of births being attended by skilled health personnel. The number of districts with a coverage of less than 50% has declined for the use of modern family planning methods, ante-natal care (in the first trimester, at least 4 visits and iron folic acid intake), and post-natal care. The progress in postnatal care surpasses the progress achieved in antenatal care due to an increase in institutional births.
The RMHI index shows an overall improvement with the mean rising from 47.25 in 2015-16 to 62.47 in 2019-21. As shown in Figure 3(b), twenty districts, including three from EAG states, exhibit deterioration in RMHI – Karnataka (Bijapur, Gulbarga, Gadag), Bihar (Purnia), Meghalaya (South Garo Hills, Jaintia Hills), Mizoram (Saiha), Chhattisgarh (Bijapur, Bilaspur), Maharashtra (Bid, Nanded, Jalna, Jalgaon, Aurangabad), Punjab (Mansa, Gurdaspur, Muktsar), Kerela (Palakkad), Leh Ladakh and Sikkim (West district). Figure 3(c) and (d) depict the status of RMHI for NFHS-4 and NFHS-5 respectively, with most districts still far from achieving universal access to RMH care.
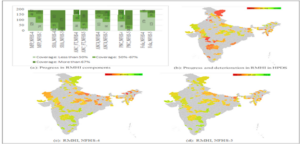
Figure 3: Progress in RMH index and its components
Source: Authors’ construction using NFHS-4 and NFHS-5 data
Determinants of RMH: To identify the determinants of reproductive and maternal healthcare we run a robust OLS cross-sectional regression for 190 districts with the dependent variable being RMHI using NFHS-5 data. The explanatory variables include (a) economic status- indicated by the multidimensional poverty index and standard of living index (SLI); (b) social factors- percent of scheduled caste and scheduled tribe population; (c) location factor given by percentage of the rural population, (d) status of women depicted by women’s schooling for at least ten years and prevalence of early marriage (e) healthcare infrastructure represented by the number of sub-centres and primary health centres (PHCs), quality of RMH services captured by the total unmet need of family planning and health workers ever talking to female non- users about family planning; and average out-of-pocket expenditure per delivery in a public health facility (OOP). The summary statistics and correlation matrix are presented in Table 2 and Table 3 respectively.
Table 2: Summary statistics of variables for 190 high-priority districts, 2019-21
| S.no | Variables | Min | Max | Mean | Standard deviation |
| 1. | Reproductive and Maternal Health Index (RMHI) | 23.5 | 89.3 | 62.5 | 13.3 |
| 2. | Percentage of population living in households with electricity | 68.4 | 100 | 95.1 | 5.9 |
| 3. | Percentage of population living in households with an improved drinking-water source | 41.2 | 100 | 91.1 | 10.7 |
| 4. | Percentage of households using clean fuel for cooking | 8.6 | 99.7 | 44.5 | 21.7 |
| 5. | Percentage of population living in households that use an improved
sanitation facility |
25.7 | 99.9 | 66.2 | 16.6 |
| 6. | Standard of living index (SLI) | 43.9 | 96.7 | 69.2 | 12.3 |
| 7. | Percentage of women with 10 or more years of schooling (WOM_ED) | 41.2 | 100 | 34.0 | 12.7 |
| 8. | Women’s status (WOM_ST) | 27.7 | 82.0 | 50.4 | 12.5 |
| 9. | Multidimensional poverty index (MPI) | .003 | .285 | .098 | .067 |
| 10. | Percentage of scheduled caste population (SC) | 0 | 50.17 | 13.1 | 9.5 |
| 11. | Percentage of scheduled tribe population (ST) | 0 | 98.6 | 28.9 | 33.7 |
| 12. | Percentage of rural population (RUR) | 0 | 100 | 81.3 | 15.1 |
| 13. | Sub-centres per thousand rural population (SUBCEN) | 0 | 14.9 | 1.9 | 1.7 |
Source: Authors’ computation
Table 3: Correlation Matrix of variables for 190 high-priority districts, NFHS-5
| RMCI | MPI | RUR | WOM S T | SLI | ST | SC | QFP | UNMET | OOP | SUBCEN | |
| RMCI | 1 | ||||||||||
| MPI | -0.56 | 1 | |||||||||
| RUR | -0.37 | 0.47 | 1 | ||||||||
| WOM_S
T |
0.37 | –
0.79 |
–
0.48 |
1 | |||||||
| SLI | 0.43 | –
0.78 |
–
0.63 |
0.69 | 1 | ||||||
| ST | -0.17 | 0.09 | 0.24 | -0.02 | –
0.23 |
1 | |||||
| SC | 0.19 | –
0.09 |
–
0.14 |
0.05 | 0.14 | –
0.72 |
1 | ||||
| QFP | 0.26 | 0.33 | 0.09 | -0.24 | –
0.27 |
0.08 | –
0.01 |
1 | |||
| UNMET | -0.58 | 0.39 | 0.21 | -0.16 | –
0.19 |
0.07 | –
0.17 |
0.02 | 1 | ||
| OOP | -0.25 | –
0.29 |
–
0.04 |
0.27 | 0.28 | 0.32 | –
0.28 |
–
0.49 |
0.07 | 1 | |
| SUBCEN | 0.13 | –
0.25 |
0.01 | 0.26 | 0.14 | 0.4 | –
0.31 |
–
0.09 |
-0.07 | 0.12 | 1 |
Source: Authors’ computation
The regression results are reported in Table 4. In Model A, the standard of living index, women’s education, and OOP expenditures are significant predictors of RMHI and together explain 36% of the variation in the dependent variable. In Model B, we replace women’s education with women’s status index and SLI with the percentage of the rural population due to the high correlation between the two variables and add poverty index, location, social, and health infrastructure variables that together explain 52% of the variation in
RMHI. Poverty, percentage of rural population, and OOP expenditure on delivery have a significant negative impact on RMHI, with the largest impact of poverty followed by OOP expenditure as indicated by beta coefficients. In Model C, we include variables capturing the quality of RMH care services along with the number of sub-centres per thousand rural population as a proxy for the quantity of physical health infrastructure in the district. Except for SC and ST, all variables are significant with the signs as expected. In terms of the relative strength of impact on RMHI, the quality of health services matters the most followed by the economic status of people. An increase in one standard deviation (S.D.) unit in SLI increases RMHI by 0.3240 S.D. units, that in women status index increases RMHI by 0.1869 S.D. units, that in QFP increases RMHI by 0.3191 S.D. units and that in health infrastructure captured by the number of sub- centres per thousand population increases RMHI by 0.0741 S.D. units. One S.D. unit increase in delivery costs has the impact of decreasing RMHI by 0.1956 S.D. units and that in unmet family planning need reduces RMHI by 0.4764 S.D. units.
Table 4: Cross-sectional robust OLS regression results with beta coefficients, 2019-21
| Dependent variable: RMHI | ||||||
| Variable | Model A | Model B | Model C | |||
| Coefficient (P>|t|) | Beta coefficient | Coefficient (P>|t|) | Beta coefficient | Coefficient (P>|t|) | Beta coefficient | |
| Constant | 34.734
(0.000) |
87.113 (0.000) | — | 33.58 (0.000) | — | |
|
MPI |
— |
— | -129.794*** (0.000) -0.655 | -0.6554 |
— |
— |
| SLI | 0.358*** (0.000) | 0.3334 | — | — | 0.348***(0.000) | 0.3240 |
| WOM_ST | — | — | — | — | 0.199***(.005) | 0.1869 |
| WOM_ED | 0.303***(0.000) | 0.2899 | — | — | — | — |
| RUR | — | — | -0.079* (0.070) | -0.0897 | — | — |
| SC | — | — | 0.096 (0.323) | 0.0681 | -0.024 (0.798) | -0.0169 |
| ST | — | — | 0.043 (0.270) | 0.1082 | -0.024 (0.503) | -0.0609 |
| QFP | — | — | — | — | 0.407*** (0.000) | 0.3191 |
| OOP | -0.0023*** (0.000) | -0.4238 | -0.0025*** (0.000) | -0.4627 | -0.001*** (0.000) | -0.1956 |
| UNMET | — | — | — | — | -1.1313*** (0.000) | -0.4764 |
| SUBCEN | — | — | — | — | 0.588* (0.077) | 0.0741 |
| N | 190 | 190 | 190 | |||
| R-squared | 0.3682 | 0.5100 | 0.6341 | |||
| Adj R-squared | 0.3580 | 0.4967 | 0.6179 | |||
| F | 40.67*** (0.000) | 56.88*** (0.000) | 75.98*** (0.000) | |||
| Mean VIF | 1.78 | 1.71 | 1.92 | |||
| AIC | 1441.578 | 1397.284 | 1347.802 | |||
| BIC | 1454.567 | 1416.766 | 1377.026 | |||
Source: Authors’ estimation
DISCUSSION
The slow progress in the reduction of MMR in many states is a matter of concern. All RMH parameters, except the prevalence of anaemia among women, have shown an overall improvement for NFHS-5 over the NFHS-4 period. An investigation of district-level performance reveals the disparities and unequal progress across districts. Although RMH index deterioration is observed in only twenty districts, a relatively larger number of districts report a deterioration in some of the individual RMH indicators. In line with the finding by Ramesh et al (2020), our results indicate a deterioration in RMH indicators in a larger number of HPDs in the non-EAG states in comparison to those from EAG states. The most remarkable progress is observed in births attended by skilled health personnel which shows the success of government schemes under the National Health Mission. The increased prevalence of early marriage and early childbearing in 50 and 56 districts of EAG and non-EAG states respectively together with an average of only 34% of women achieving at least ten years of schooling in the NFHS-5 period represents a sticky and rigid behavioural aspect regarding status of women in society. While there has been considerable progress in the average percentage of households in HPDs with electricity (from 83% as per NFHS-4 to 95% as per NFHS-5) and improved drinking water source (from 87% in NFHS-4 to 91% in NFHS-5), the progress in improved sanitation facilities and clean cooking fuel has been slow (from 41% to 66% and 28% to 45% respectively). Not only do the latter two reflect low economic status, literacy, and awareness levels, but they also depict the health risks faced particularly by women. We also find a slow pace of improvement in the use of modern family planning methods. The decline in the quality of family planning services in 62 districts needs to be reversed by ensuring the presence of an adequate health workforce who can counsel and encourage women to adopt modern family planning methods. This will also facilitate a reduction in unmet need for family planning services. Slow progress in antenatal care highlights the continued risks for the mother as well as the child during childbirth and results in a higher MMR (see Sanneving et al 2013 and Gogoi et al 2014). The increase in the incidence of anaemia is a cause for worry and the low rate of folic acid intake during pregnancy (41% as per NFHS-5) suggests the need for greater outreach in public healthcare facilities such as Anganwadis. The regression analysis indicates that the improvement in RMH outcomes is constrained by the poor economic status of households (see Zer et al 2013) along with the low status of women. Health infrastructure and the quality of healthcare services are also important determinants. The rising OOP in public health facilities clearly shows the need for affordable reproductive and maternal healthcare facilities for low-income groups. Our study highlights the need for RMH to be accorded national priority and also its adoption as a political priority by states as well (see Gogoi et al 2014). It is important to address the issues of poor economic status of large number of households, low status accorded to women, inadequate health infrastructure, and high out-of-pocket expenditures to enable the achievement of SDGs for reproductive and maternal health. A renewed focus on poor-performing parameters in high-priority districts is needed to achieve universal coverage in reproductive and maternal healthcare and a reduction in maternal mortality. While the study covers a period of two nationally representative survey periods, i.e. NFHS-4 and NFHS-5, a closer study at the district level of some of the underperforming HPDs can help to confirm the determinants of reproductive and maternal health and the crucial role of governance in public health systems.
CONCLUSION
Overall, the study shows disparities and slow progress in many dimensions of RMH indicators across districts in India. Achieving a reduction in maternal mortality and improvement in reproductive and maternal care will improve women’s health and also positively impact the health of newborn children. The study recommends continuous monitoring of progress at the district level to help identify HPDs with lagging performance in health parameters and a revised focus on areas as per performance. Based on the findings, the study also recommends that the deep-rooted gender biases and neglect and ignorance among women as well as society at large towards women’s health needs to be addressed and the importance of maternal care should be recognized as an accepted social norm as well as a political priority.
REFERENCES
- Balarajan, , Selvaraj, S., & Subramanian, S. V. (2011). Healthcare and equity in India. The Lancet, 377(9764), 505-515. doi: 10.1016/S0140-6736(10)61894-6
- Dhar, M. (2022). Projection of district-level annual population by quinquennial age-group and sex from 2012 to 2031 in India. IIPS, Mumbai, India. https://iipsindia.ac.in/sites/default/files/FULL_REPORT_WITH_FINAL_TABLES.pdf
- Girase, A., Dwivedi, P., Srivastava, A., Bhattacharya, S. K., & Avan, B. I. (2015). Implementation pathway report: Community Resource Person An intervention by the Technical Support Unit Uttar Pradesh, India. February 2015.
- Ghosh, A., & Ghosh, R. (2020). Maternal healthcare in India: a reflection of 10 years of National Health Mission on the Indian maternal health scenario. Sexual & Reproductive Healthcare, 25,
- GoI (2015). List of High Priority Districts (HPDs) in the country. Press Information Bureau, Ministry of Health and Family Welfare, Government of India. 2015 Available from: https://pib.gov.in/newsite/PrintRelease.aspx?relid=118620.
- Gogoi, M., Unisa, S., & Prusty, R. K. (2014). Utilization of maternal healthcare services and reproductive health complications in Assam, India. Journal of Public Health, 22, 351-359.
- International Institute for Population Sciences (IIPS) and ICF (2020). National Family Health Survey (NFHS)-5, State and District Factsheets. Mumbai: IIPS.
- International Institute for Population Sciences (IIPS) and ICF (2021). National Family Health Survey (NFHS)-5, State and District Factsheets. Mumbai: IIPS.
- International Institute for Population Sciences (IIPS) and ICF (2017). National Family Health Survey (NFHS-4), 2015-16, District Factsheets. Mumbai: IIPS.
- Jat, T. R., Deo, P. R., Goicolea, I., Hurtig, A. K., & San Sebastian, M. (2013). The emergence of maternal health as a political priority in Madhya Pradesh, India: a qualitative BMC pregnancy and childbirth, 13, 1-11.
- Jayanna, K., Bradley, J., Mony, P., Cunningham, T., Washington, M., Bhat, S., … & Avery, L. (2016). Effectiveness of onsite nurse mentoring in improving quality of institutional births in the primary health centres of high priority districts of Karnataka, South India: a cluster randomized PloS one, 11(9), e0161957.
- MoHFW (2021). Rural Health Statistics 2020-21. Government of India Ministry of Health and Family Welfare Statistics Division.
- Mustafa, A., & Shekhar, C. (2021). Is quality and availability of facilities at Primary Health Centers (PHCs) associated with healthcare-seeking from PHCs in rural India: An exploratory cross-sectional analysis. Clinical Epidemiology and Global Health, 9, 293-298.
- NHRM (2013). Guidance note for implementation of RMNCH+A interventions in high priority districts. New Delhi: 2013. National Rural Health Mission, Ministry of Health and Family Welfare, Government of India.
- NITI Aayog (2023). National Multidimensional Poverty Index- A Progress Review 2023, NITI Aayog Government of India.
- Pasa, K., Singh, N. M., Bharali, N., Hmar, T., Schaschl, H., Baruah, T., & Adak, D. K. (2024). Reproductive Health Status in India: Comparison of NFHS-IV and NFHS-V Journal of the Anthropological Survey of India, 2277436X241282596.
- Prakash, , Dehury, B., Yadav, C., Tripathi, A. B., Sodhi, C., Bilal, H., Vasanthakumar, N., Isac, S., Ramesh, B. M., Blanchard, J.,& Boerma, T. (2021).
- Establishing evidence-based decision-making mechanism in a health eco-system and its linkages with health service coverage in 25 high-priority districts of Uttar Pradesh, India. BMC Health Services Research, 21, 1-10.
- Ramesh, M., Dehury, B., Isac, S., Gothalwal, V., Prakash, R., Vasanthakumar, N., Halli, S., Blanchard, J., & Boerma, T. (2020). The contribution of district prioritization on maternal and newborn health interventions coverage in rural India. Journal of Global Health, 10(1).
- Sanneving, L., Trygg, , Saxena, D., Mavalankar, D., & Thomsen, S. (2013). Inequity in India: the case of maternal and reproductive health. Global health action, 6(1), 19145.
- SRS (2019). Special Bulletin on Maternal Mortality In India 2015-17. Sample Registration Office of the Registrar General, India. November 2019.
- SRS (2022). Special Bulletin on Maternal Mortality In India 2018-20. Sample Registration Office of the Registrar General, India. November 2022.
- Tripathi, , Parhad, P., Garg, S., Biswal, S. S., Ramasamy, S., Panda, A., Shastri, A. K., Bhargav, A., Bopche, C., Ansari, V., Sahu, A., Rajput, R., Gupta A., Gupta, M., Agrawal, S., Sharma, R., Ahmed, M., Ghosh, S., Samrat, J., Yadav, D., Sharma, P., & Keshri, V. R. (2024). Performance of health and wellness centre in providing primary care services in Chhattisgarh, India. BMC Primary Care, 25(1), 360.
- UN (2015). Transforming our world: the 2030 Agenda for Sustainable Development. United
- Verma, V. R., & Dash, U. (2020). Geographical accessibility and spatial coverage modeling of public healthcare network in rural and remote India. Plos one, 15(10), e0239326.
- Vidler, , Charantimath, U., Katageri, G., Ramadurg, U., Karadiguddi, C., Sawchuck, D., Qureshi, R., Dharmsi, S., Dadelszen, P. V., Derman, R., Goudar, S., Mallapur, A., & Bellad, M., for the Community Level Interventions for Pre-eclampsia (CLIP) India Feasibility Working Group. (2016). Utilization of maternal healthcare services and their determinants in Karnataka State, India. Reproductive health, 13, 55-65.
- Wadhwa, , Chaudhary, N., Bisht, N., Gupta, A., Behera, N., Verma, A. K., & Gera, R. (2018). Improving adolescent health services across high priority districts in 6 states of India: Learnings from an integrated reproductive maternal newborn child and adolescent health project. Indian Journal of Community Medicine, 43(Suppl 1), S6-S11.
- WHO (2024). World health statistics 2024: monitoring health for the SDGs, Sustainable Development Goals. Geneva: World Health Organization; 2024.
- Zere, E., Suehiro, Y., Arifeen, A., Moonesinghe, L., Chanda, S. K., & Kirigia, J. M. (2013). Equity in reproductive and maternal health services in Bangladesh. International journal for equity in health, 12, 1-8.