
Quality Evaluation of Different Flakes Produced From Germinated Maize (Zea May’s), Millet (Pennisetum Glaucum) and Sorghum (Sorghum Bicolor L. Moench) Each Substituted with Germinated Pigeon Peas (Cajanus Cajan) Flour.
- Adedokun, S.O
- Jimoh, K.O
- Azeez, L.A.
- Adeoti, O. A
- Osunrinade, A.O
- Alabi, A.O
- 264-274
- Jul 4, 2024
- Agriculture
Quality Evaluation of Different Flakes Produced From Germinated Maize (Zea May’s), Millet (Pennisetum Glaucum) and Sorghum (Sorghum Bicolor L. Moench) Each Substituted with Germinated Pigeon Peas (Cajanus Cajan) Flour.
Adedokun, S.O*, Jimoh, K.O, Azeez, L.A., Adeoti, O. A, Osunrinade, A.O, Alabi, A.O
Department of Food Science and Technology, The Oke –Ogun Polytechnic, Saki, Oyo state, Nigeria.
*Corresponding Author
DOI : https://doi.org/10.51244/IJRSI.2024.1106022
Received: 20 December 2023; Revised: 07 January 2024; Accepted: 11 January 2024; Published: 05 July 2024
ABSTRACT
This study was aimed to produce, evaluate and compare three types of breakfast flakes from germinated maize, millet, and sorghum and each substituted with germinated pigeon peas flour at different level, 0, 20, 30, 40 and 50%. Flour samples were analyzed for functional properties and flakes produced by oven toast method analyzed for proximate, minerals, anti-nutritional and acceptability using standard methods. Substitution decreased oil absorption capacity in corn (1.38 – 0.37g/g) and millet (1.23 – 0.84g/g), but increased in sorghum (0.70 – 1.1g/g). Water absorption capacity increased in corn (1.06 – 1.73 g/m2) but decreased in millet (1.40 – 0.56 g/m2) and sorghum (1.98 – 0.56 g/m2). Bulk density values were not significantly different (p<0.05) among samples but, swelling capacity had highest values in sorghum at 90oC and in corn at 70oC and 50oC. Moisture was highest in corn 20% level (8.49%), crude fat in corn 40% (14.36%) and protein in corn 40% (13.01%), fiber in sorghum 30% (1.36%), ash in sorghum 0% (0.93%) and carbohydrates in sorghum 30% (87.12%). K, Na, P and Fe values increased significantly as the substitution increased with the highest values in sorghum compared to millet and corn, but anti-nutritional values decreased significantly (P<0.05). Yellow color decreased as the substitution increased with the lowest value in sorghum. In overall acceptability sorghum was highly rated followed by corn and millet. Therefore, germination and substitution improved cereals protein, fat and fiber content of flakes and sorghum and millet showing capacity to replace corn, thereby solving protein-mineral-energy deficiency in tropical countries . .
Keywords: Corn, Millet, Sorghum, Pigeon-pea, Germination, Flakes, Quality
INTRODUCTION
Breakfast cereals as ready–to-eat meal in form of flakes have become households meal worldwide since the initial flake was produced from wheat flour by Will Kellogg and his brother John Kellogg between 1894 and 1896 (Kellogg, 2010). Today, flakes are produced from rice and corn (Cornflakes). Cornflakes is produced by milling whole maize grains (white or yellow) into flour and mixing with sugar, salt and flavors to gives a good taste when toasted in a drum dryer or hot oven that gives a crispy friable texture, easy to prepare and consumed with or without addition of milk (Jacob and Teresa, 2007). In the developing nation’s rural communities, growing children’s malnutrition is prevalent due to over consumption of cereals like corn and rice which is low in protein and deficiency in some amino acids like lysine and tryptophan but higher in methionine (FAO, 2009). Studies have shown that cereals could be improved by supplementation with animal milk, minerals, vitamins and legumes (Powers et al., 2016; Hamid and Ahmed, 2022). While germination / sprouting or fermentation of cereals and legumes could improve their nutritional status, functional properties and consumers acceptability with strong health benefits (Okpala & Okoli, 2011; Morales-Medina, et al., 2012; Fasoyiro, et al., 2013).
Maize as a tropical crops required adequate water and good sunshine, but has low resistance to draught and pest. Today, technological advancements has increased usage of maize for animal feed, commercial alcohol production and as human foods, etc. In Nigeria it is used for various foods like fermented gruel (“Ogi’), roasting, cooking, porridge (“Tuwo”), confectionaries like “masa” bakery products, etc. Meanwhile, recent forecast has shown that maize provides over 20 % of total calories in human diets in 21 countries and over 30 % in 12 countries home to a total of more than 310 million people (Shiferaw, et al., 2011). However, maize continued to attract higher prices, thus affecting the cost of food production, especially breakfast cereals. The identified problems are: increasing population demand, increasing demand by poultry feed industries, decreasing production due to low disease and draught resistance and current climate change (Rosegrant et al. 2009; Shiferaw, et al., 2011), Maize also have nutritional profile deficiency in terms of its low protein, lysine and tryptophan content but higher in methionine (FAO, 2009). Supplementations with legumes or animal milk or meat have been used (Awoyinka, et al., 2016). In the legumes series the crops that could grow in draught conditions, sandy and arid region is pigeon peas (Cajanus cajan) and it is called locally “Fio Fio” and “Otili” in Ibo and Yoruba language of Nigeria respectively (Okpala & Okoli, 2011). It contains high protein content and all essential amino acids, high in lysine but low in methionine and has found usefulness in treatment of diabetes, heart and hypertension issues (Awoyinka et al., 2016). While supplementation with corn looks desirable but it remains underutilized (Fasoyiro et al., 2010; Okpala & Okoli, 2011). Also, in the tropics, sorghum is highly draught resistant and it has higher dietary properties in terms of being gluten-free, high in fiber, good for diabetics, source of protein, packed with essential minerals, promotes bone health, helps lose weight, preserves the health of digestive system, great source of proteins for vegetarians and vegans, rich in antioxidants and extremely versatile grain (Tanwar et al., 2023).
Similar to sorghum is millets which is primarily starchy, small-grained and grown as cereal crops or grains for fodder and human in semiarid plains of South Asia (particularly in India) and the Sahel region (South of the Sahara) in Africa (Kumar et al., 2022; Kalsi et al., 2023). According to USDA (2012), millet and wheat both have a protein level of approximately 11% by weight on a dry matter basis. Millets are also high in calcium, iron, potassium, magnesium, zinc, and B vitamins, including niacin, B6, and folic acid with a Calorific value of 335 Kcal/100g (Kalsi et al., 2023). Since none of the millets are closely related to wheat, they do not contain gluten, making them suitable for consumption by people who have celiac disease or other wheat allergies or intolerances (1beogu, 2020). As a result, employing it to produce different weaning food will contribute to the benefits being accumulated for human consumption. Weaning and convalescent foods, beverages, and food products have all effectively used millet. Nutraceuticals like cholesterol-lowering waxes and antioxidant phenolic may be found in millets (1beogu, 2020). Thus, for developing countries to continue to survive there is a need to reduce concentration in the usage of maize for meal production due to its current high prices by focusing on other similar cereals like sorghum and millet and methods of improving their quality by germination and supplementation with legumes like pigeon peas. Therefore, this study aimed was to produce and evaluate quality attributes differences of oven baked flakes from different cereals of germinated Maize/Corn, Sorghum and Millet with each supplemented with germinated pigeon peas.
Experimental
MATERIALS AND METHODS
Grains of Maize (Zea may’s), Millet (Pennisetum glaucum) and Sorghum (Sorghum bicolor L. Moench) and pigeon pea (Cajanus cajan) were obtained from Sango market in Saki, Oyo State. Nigeria. While equipment and the bench works were from the Department of Food Science and Technology, The Oke-Ogun Polytechnic Saki, Oyo state Nigeria. All chemicals used for analysis were of analytical grade.
Sample preparation
Germination Procedure for Corn, Sorghum, Millet and Pigeon peas
Germination of grains was done using the method adopted by Egli et al., (2002 and Chikwedu, (2003);) with some modification. Weighed whole seeds of maize, millet, sorghum and Pigeon peas were manually sorted to remove impurities. The grains were washed and then soaked with portable water (three times the weight of seeds) in a separate plastic bowl for two hours. The soaked seeds were drained and then spread evenly on jute sacks separately and were allowed to sprout at room temperature for 48hr with watering three times a day. A sample of germinated seed is shown in Plate 1.
Preparation of Maize, Millet and Sorghum Flour
Germinated corn, millet and sorghum grains were steamed and parboiled in an electric steamer for 30mins and then dried in dyer oven at 105°C for about 8hr. Roots and shoots were removed by crumbling manually within hand palms, winnowed by blowing air across the mass and then milled using laboratory Wiley disc mill before sieving to pass through a 40mm pore size sieve to yield flour. The flours (a sample is shown in plate 1) were packed separately in HDPE bags, sealed and stored at a reduced temperature (4°C) in the freezer for further usage.
Preparation of pigeon pea flour
Germinated pigeon peas grain was steam and parboiled for 20 min in an electric steamer, dried in an air dryer oven at 60°C for 48 hr. and after cooling, shoots and roots were removed manually and seed coats were removed using a Philips blender, winnowed by blowing air into it and was milled using laboratory Wiley disc mill before sieving through a 40mm pore size sieve which was packaged into HDPE bags and then stored in refrigerator for further usages. Plate 2 shows a flour sample.
Product Formulation and Flakes Production Product formulation
Table 1: Product Formulation Design
| SN | Each Germinated Cereal (Maize / Millet / Sorghum) Flour (%) Ratio | Pigeon Peas Flour (%) Ratio |
| 1 | 100 | 0 |
| 2 | 80 | 20 |
| 3 | 70 | 30 |
| 4
5 |
60
50 |
40
50 |
Table 1 shows the germinated pigeon peas at different ratio level (0, 20, 30, 40 and 50%) blended with each germinated cereals (Maize/corn, millet and sorghum) flour using laboratory Kenwood electric mixer with calculated amount of salt, sugar, and flavor added to each cereals mix. Each individual flour blend samples were put into separate bowl (well labeled) and each were divided into 2 parts (2/3 of sample weight and 1/3 of sample weight in well labeled plastic bowl
Production of Oven Baked Flakes
The first part (2/3 weight of sample) for each cereals mix flour were mixed with a measured quantity of water to produce thin marshy slurry and the second part (1/3 weight of sample) was sprinkled with small quantity of water to make bread crumbs like grits. The marshy portions were spread thinly and evenly into a baking pan wrapped with parchment paper well labeled. While a small quantity of the bread-like crumbs was sprinkled on the marshy portion evenly. The electric oven was set at 230OC and the time was set at 15 minutes. Each sample was heated for the first 15 minutes, removed to cool and flakes were peeled off from the parchment paper and then finally allowed to dry in the oven for another 5 minutes. The dried product was packaged into HDPE nylon after cooling and then stored in a refrigerator until required for analysis. A sample of packaged flakes is shown in the plates 1 below:
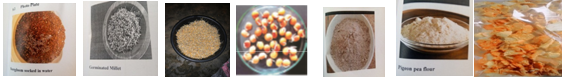
Plate 1: Germinated Sorghum, Millet, Corn and Pigeon peas ; Sorghum, Pigeon pea flour ; Flakes
Analysis of Samples
Determination of Functional Properties of Flour Blends Samples
The bulk density of the flours was determined using the method described by Serna-Saldivar, (2010). Water and oil absorption capacity and swelling index were determined by methods described by Iwe et al., (2016).
Proximate composition and minerals of Oven- Toast flakes
Proximate composition was determined in triplicates using the method described by A.O.A.C., (2012).Moisture was determined using oven drying method. Ash was determined by heating sample in muffle furnace heated at 600OC to remove all moisture, volatiles and organics carbon dioxide and oxides of nitrogen, Crude protein was determined using Kjeldahl method while crude fibers was determines gravimetrically as reissue remaining after acid and alkaline digestion. Carbohydrate content was estimated by difference as % Carbohydrate = 100 – (% Moisture + % Fat + % Ash+ % Crude fiber + % Crude protein). Minerals of potassium, sodium, phosphorus, and iron in the flakes sample were determined as described by Sebastia, 2001). The mineral were determined using atomic absorption spectroscopy.
Determination of Anti-nutritional factors of Oven- Toast flakes
Phytic acid was based on colorimetric methods as described by Gao et al., (2007). Tannin was determined by the preparation of tannins solution and absorption of the tannins on hydrated, chromed hide-powder as described by Herderich and Smith, (2005). Saponin content was determined through spectrophotometry as described by Trinidad et al., (2010). Oxalic acid content was determined by using capillary electrophoresis method as described by Holmes and Kenedy, (2000)
Sensory Evaluation of Oven – Toast Flakes
Sensory characteristics of the toasted flakes were evaluated for different sensory attribute using the method described by Armand and Howard (2006). 30 semi-trained panelists were briefed before the commencement of the evaluation process that regularly consumes corn flakes and water was provided to rinse the mouth between evaluations. Sensory attributes evaluated are appearance, taste, texture, crispiness, flavour and overall acceptability. The rating was done using nine- point hedonic scale ranging from 9 (like extremely) to 1 (dislike extremely).
Data Analysis of Samples
All measurement were carried out in triplicate, data obtained was subjected to analysis of variance (ANOVA) at a 5% level significance level and means were separated using the Duncan Multiple Range Test by using SPSS version 21.0.
RESULT AND DISCUSSION
Table 2: Functional Properties of Flour Blends Samples
| Cereal Samples blends | Ratio % | Oil Absorption Capacity
(g/g) |
Water Absorption Capacity (g/m2) | Bulk Density
(g/mL) |
Swelling Index at 90OC | Swelling Index at 70OC | Swelling Index at 50OC |
| CP1 | 100:0 | 1.37±0.66 a | 1.06±0.04 a | 0.70±0.07 a | 1.98±0.30 a | 1.39±0.07b | 1.38±0.04 bc |
| CP2 | 80:20 | 0.35±0.15 b | 1.22±0.18 a | 0.66±0.08 a | 2.26±0.54 a | 1.88±0.37ab | 1.22±0.01 c |
| CP3 | 70:30 | 1.31±0.03 a | 1.54±0.60 a | 0.70±0.11 a | 2.32±0.46 a | 2.39±0.83ab | 1.59±0.01 a |
| CP4 | 60:40 | 0.93±0.03 ab | 1.64±0.03 a | 0.69±0.07 a | 2.77±0.37 a | 2.30±0.08ab | 1.49±0.16 ab |
| CP5 | 50:50 | 1.38±0.27a | 1.73±0.44 a | 1.73±0.09 a | 2.50±0.31 a | 2.75±0.34 a | 1.24±0.01c |
| MP1 | 100:0 | 1.22±0.17a | 1.40±0.10a | 0.66±0.08a | 2.06±0.97 a | 1.68±0.18a | 0.84±0.28a |
| MP2 | 80:20 | 1.09±0.40a | 1.00±0.35a | 0.66±0.14a | 1.25±0.56 b | 1.71±0.93a | 0.94±0.17s |
| MP3 | 70:30 | 0.94±0.06a | 1.28±0.02a | 0.62±0.08a | 2.14±0.17 a | 1.25±0.21a | 0.81±0.24a |
| MP4 | 60:40 | 1.23±0.37a | 1.40±0.18a | 0.71±0.06a | 2.73±0.18 a | 1.38±0.01a | 0.94±0.03a |
| MP5 | 50:50 | 1.04±0.01 a | 0.56±0.39c | 0.63±0.08c | 3.07±0.24 a | 2.08±0.17ab | 1.79±0.27 a |
| SP1 | 100:0 | 0.84±0.18 a | 1.98±0.54a | 0.80±0.01ab | 3.77±0.17 a | 2.51±0.11a | 1.96±0.75 a |
| SP2 | 80:20 | 0.70±0.23 a | 1.05±0.08bc | 0.83±0.01a | 3.22±1.10 a | 2.00±0.34ab | 2.15±0.32 a |
| SP3 | 70:30 | 1.19±0.43 a | 0.87±0.12bc | 0.79±0.01ab | 3.06±0.01 a | 1.86±0.19c | 1.65±0.25 a |
| SP4 | 60:40 | 0.95±0.83 a | 1.45±0.04ab | 0.72±0.01bc | 3.17±0.56 a | 1.85±0.05c | 1.52±0.17 a |
| SP5 | 50:50 | 1.04±0.01 a | 0.56±0.39c | 0.63±0.08c | 3.07±0.24 a | 2.08±0.17ab | 1.79±0.27 a |
Values are means ± standard deviation of duplicate measurements. Means with the same superscript in the same column are significantly different at 0.05 levels.
Key: CP1-5 = Corn: Pigeon peas flours Blend; MP1-5 = Millet: Pigeon peas flour Blend; SP1-5 = Sorghum: Pigeon peas flour Blend
Table 2 shows the functional properties of each cereal flour blends. Comparing the cereal samples oil absorption capacity (OAC) had higher values in corn (1.38 – 0.37) followed by millet (1.23 – 0.84) and sorghum (0.70 – 1.19). Water absorption capacity increased in corn (1.06 – 1.73) but decrease in millet (1.40 – 0.56) and sorghum (1.98- 0.56) as the substitution increased. Bulk density value was lower in all the samples decreasing in sorghum (0.83 – 0.63), corn (0.72 – 0.66) and millet (0.71- 0.62). The swelling Index increased as the temperature of heating increased with highest values at 90OC and lowest values at 50OC. Sorghum had highest values at a decreasing rate (3.77 – 3.07) followed by corn (1.98 – 2.77) and millet (1.25 – 3.07) at increasing rate. At 70OC the swelling index increased in corn and millet but decreased in sorghum. While at 50OC swelling index decreased in corn and sorghum but increased in millet. Oil absorption capacity provides an indication of the amount of oil bound to the protein structure which is affected by protein source, processing conditions, composition of additives, particle size and temperature (Serna – Saldivar, S.O, 2010). Water holding capacity reflects the ability of a protein to imbibe and retain water (via hydrogen bond, ionic bonds and physical entrapment) and Fermentation or germination enhanced the hydrolysis of starch, which invariably increased the water absorption index of the samples (Okpala & Okoli, 2011). Bulk density measures the compartments of the milled flour and it is useful in flour packing and storage space. Swelling capacity is used to measure the amount of water starchy materials can imbibe at a particular temperature (Fasoyiro et al., 2010)
Table 3: Proximate composition of flake Samples
| Cereal Sample blends | Ratio % | Moisture
(%) |
Crude Fat
(%) |
Protein (%) | Fiber
(%) |
Ash
(%) |
Carbohydrate (%) |
| CP1 | 100:0 | 8.19±0.11ab | 10.54±0.45cd | 9.88±0.88c | 0.79±0.01c | 0.71±0.01a | 69.90±1.47ab |
| CP2 | 80:20 | 8.49±0.38a | 10.38±0.00d | 10.50±0.0b | 1.05±0.00a | 0.71±0.00a | 68.87±0.38ab |
| CP3 | 70:30 | 7.85±0.17bc | 11.08±0.04c | 5.94±6.45d | 0.78±0.01c | 0.68±0.03a | 73.68±6.21a |
| CP4 | 60:40 | 7.53±0.15c | 14.36±0.20a | 13.01±0.17a | 0.82±0.04c | 0.72±0.03a | 63.57±0.28c |
| CP5 | 50:50 | 8.02±0.14abc | 12.26±0.11b | 10.94±0.62b | 0.90±0.01b | 0.68±0.03a | 67.20±0.83ab |
| MP1 | 100:0 | 7.29±1.41a | 10.61±0.16a | 8.98±0.32a | 0.84±0.01ab | 0.85±0.04a | 71.44±1.94d |
| MP2 | 80:20 | 7.08±0.22a | 6.59±0.30b | 4.70±0.45c | 0.82±0.03c | 0.68±0.04b | 80.14±0.59ab |
| MP3 | 70:30 | 7.51±0.64a | 6.70±0.34b | 7.88±1.23ab | 0.88±0.03ab | 0.81±0.02a | 76.23±0.21c |
| MP4 | 60:40 | 7.06±0.42a | 3.08±0.21c | 7.00±2.47ab | 0.73±0.04d | 0.85±0.01a | 81.29±1.80a |
| MP5 | 50:50 | 6.09±0.56a | 10.31±0.21a | 4.82±0.62c | 0.89±0.01a | 0.87±0.01a | 77.04±1.41bc |
| SP1 | 100:0 | 4.99±0.61d | 10.38±0.06a | 6.63±0.54a | 0.91±0.04b | 0.93±0.04a | 76.17±0.21c |
| SP2 | 80:20 | 6.86±0.14bc | 4.18±0.23c | 4.82±0.62a | 0.76±0.06c | 0.68±0.01bc | 82.71±1.05b |
| SP3 | 70:30 | 6.28±0.23c | 1.02±0.04e | 3.51±1.24a | 1.36±0.05a | 0.73±0.02b | 87.12±1.47a |
| SP4 | 60:40 | 8.21±0.13a | 5.59±0.42b | 6.93±0.12a | 0.90±0.04b | 0.62±0.03c | 77.77±0.23c |
| SP5 | 50:50 | 7.42±0.56ab | 2.57±0.76d | 5.51±2.65a | 0.91±0.03b | 0.63±0.03c | 82.98±1.28b |
Values are means ± standard deviation of duplicate measurements. Means with the same superscript in the same column are significantly different at 0.05 levels.
Key: CP1-5 = Corn: Pigeon peas flours Blend; MP1-5 = Millet: Pigeon peas flour Blend; SP1-5 = Sorghum: Pigeon peas flour Blend
Table 3 shows the proximate composition of flakes samples. Moisture had highest value in corn (8.49 -7.53 %) followed by millet (7.51- 6.09% and sorghum (8.21 – 4.99%). Fat had highest value in corn (14.36 – 10.38%) followed by millet (10.61 – 3.08%) and sorghum (10.38-1.02%). Protein had highest values in corn (13.01-5.94%) followed by millet (8.98-4.70%) and lowest value in sorghum (6.93-3.51%). Fiber had highest values in sorghum (1.36-0.91%) followed by corn (1.05-0.90%) and millet (0.89-0.73%). Ash content values were not significantly different (p>0.05) among samples but had highest value in sorghum at the control level, millet at the 50% level and corn at the 40% level. Carbohydrate had highest values in sorghum at increasing rate, followed by millet and corn with the highest values in sorghum 30% level, millet at 40% level and corn at 30% level. The flakes lower moisture content shows a possibility for a stable product during storage if adequately packaged and kept under a cool atmosphere. While higher fat value in corn samples contributed by corn and pigeon peas high fat content increases energy level, but consumption of low cholesterol pigeon peas is needed to reduce heart-related issues (Awoyinka et al., 2016)). Protein increased contributed by germination and addition of pigeon peas will assists in tackling low protein-energy malnutrition in developing nations (Fasoyiro, et al., 2013; Powers et al., 2016; Hamid and Ahmed, 2022). Dietary fiber assists to reduce health-related issues (Saxena et al., 2002; Trinidad et al., 2010) and values obtained could meet adults and the elderly requirement if consumed daily. Ash is the total mineral content in foods having diuretic action in metabolism and health-related issues (Morales-Medina, et al., 2012). While carbohydrate lower values among samples could have been contributed by germination which reduces it content, thus making it a low carb meal (Okpala & Okoli, 2011)
Table 4: Mineral composition of flake Samples
| Cereal Sample
blends |
Ratio % | Potassium (K) mg/100g | Sodium (Na) mg/100g | Phosphorus (P) mg/100g | Iron (Fe)
mg/100g |
| CP1 | 100:0 | 201.01±13.98 d | 108.24±13.95 e | 113.33±7.64 b | 2.20±0.57 c |
| CP2 | 80:20 | 699.54±21.35 b | 331.36±0.00 c | 118.33±2.89 ab | 4.17±0.45 b |
| CP3 | 70:30 | 592.38±27.95 c | 303.47±0.00 d | 121.67±5.77 ab | 4.40±0.10 ab |
| CP4 | 60:40 | 718.17±36.98 b | 359.25±13.95 b | 125.00±0.00 a | 4.76±0.10 ab |
| CP5 | 50:50 | 802.04±27.95 a | 424.33±21.30 a | 128.33±7.64 a | 4.94±0.21 a |
| MP1 | 100:0 | 354.76±13.98e | 177.97±0.00e | 124.67±4.16c | 3.69±0.68c |
| MP2 | 80:20 | 592.38±13.98d | 289.53±0.00d | 130.33±0.58b | 4.17±0.27bc |
| MP3 | 70:30 | 652.95±21.35c | 331.36±0.00c | 131.00±1.00b | 4.94±0.37ab |
| MP4 | 60:40 | 788.06±13.98b | 401.09±0.00b | 132.33±2.52b | 5.42±0.41a |
| MP5 | 50:50 | 848.63±29.10a | 456.87±13.95a | 135.00±0.00a | 5.89±0.82a |
| SP1 | 100:0 | 317.49±8.07e | 164.02±0.00e | 116.67±2.89b | 4.40±0.10c |
| SP2 | 80:20 | 517.83±8.07d | 261.64±0.00d | 121.67±2.89b | 4.70±0.88c |
| SP3 | 70:30 | 676.24±13.98c | 331.36±0.00c | 128.33±2.89a | 7.14±0.18ab |
| SP4 | 60:40 | 718.17±13.98b | 359.25±0.00b | 131.67±2.89a | 7.74±0.10ab |
| SP5 | 50:50 | 829.99±36.98a | 405.73±8.05a | 133.33±2.89a | 8.21±0.18a |
Values are means ± standard deviation of duplicate measurements. Means with the same superscript in the same column are significantly different at 0.05 levels.
Key: CP1-5 = Corn: Pigeon peas flours Blend; MP1-5 = Millet: Pigeon peas flour Blend; SP1-5 = Sorghum: Pigeon peas flour Blend
Table 4 shows the selected minerals evaluated in the samples. In all the cereals samples mineral measured substitution increased value with the highest value at 50% level. Potassium had the highest value in millet (354.76 – 844.63mg/100g) and the lowest value in corn (201.01 – 802.04). Sodium had the highest values in millet (177.97 – 456.87mg/100g) and lowest in corn (108.24 – 424.33mg/100g). Phosphorus value was highest in millet (124.67 – 135.00 mg/100gm) and lowest in corn (113.33 – 128.33g/100mg). Iron content increases as the substitution level increases with the highest value in sorghum (4.40 – 8.21mg/100gm) and the lowest value in corn (2.20- 4.94mg/100gm). Potassium is useful in human diets by lowering blood pressure and heart -related disease (FAO/WHO, 2002) but, high consumption of sodium has serious effects on human health by increasing blood pressure and it is highly regulated (He and MacGregor, 2008). Pigeon peas high phosphorus content contributed into high samples values which its health benefits have been highlighted (Duhan et al., 2001). Pigeon peas high Iron content contributing to the high sample values and will assist in blood formation (FAO/WHO, 2002)
Table 5: Anti-nutritional factors of Flake Samples
| Cereal Sample lends | Ratio % | Tannin
(mg/g sample) |
Phytate
(mg/g sample) |
Saponin
(mg/g sample |
Oxalate
(mg/g sample |
| CP1 | 100:0 | 0.58±0.02 b | 1.07±0.01 a | 0.27±0.01 a | 0.25±0.01 b |
| CP2 | 80:20 | 0.77±0.00 a | 0.60±0.02 bc | 0.11±0.01 b | 0.34±0.00 a |
| CP3 | 70:30 | 0.45±0.02 c | 0.53±0.02 c | 0.05±0.00 d | 0.20±0.01 c |
| CP4 | 60:40 | 0.57±0.00 b | 0.53±0.03 c | 0.06±0.01 c | 0.25±0.00 b |
| CP5 | 50:50 | 0.75±0.00 a | 0.64±0.08 b | 0.08±0.01 c | 0.33±0.00 a |
| MP1 | 100:0 | 0.44±0.01d | 0.44±0.01d | 0.11±0.01a | 0.16±0.03c |
| MP2 | 80:20 | 0.71±0.04b | 0.71±0.04b | 0.06±0.00b | 0.18±0.01bc |
| MP3 | 70:30 | 0.56±0.02c | 0.56±0.02c | 0.05±0.02b | 0.21±0.02ab |
| MP4 | 60:40 | 0.67±0.03b | 0.67±0.03b | 0.06±0.03b | 0.23±0.02a |
| MP5 | 50:50 | 0.85±0.09a | 0.85±0.09a | 0.08±0.02b | 0.25±0.04a |
| SP1 | 100:0 | 0.49±0.00d | 0.31±0.04b | 0.01±0.00d | 0.07±0.01d |
| SP2 | 80:20 | 0.53±0.04c | 0.22±0.01c | 0.02±0.00c | 0.11±0.01c |
| SP3 | 70:30 | 0.68±0.02b | 0.35±0.01b | 0.05±0.00b | 0.35±0.01b |
| SP4 | 60:40 | 0.94±0.00a | 0.45±0.03a | 0.06±0.00b | 0.36±0.01b |
| SP5 | 50:50 | 0.95±0.00a | 0.47±0.02a | 0.07±0.00a | 0.42±0.03a |
Values are means ± standard deviation of duplicate measurements. Means with the same superscript in the same column are significantly different at 0.05 levels.
Key: CP1-5 = Corn: Pigeon peas flours Blend; MP1-5 = Millet: Pigeon peas flour Blend; SP1-5 = Sorghum: Pigeon peas flour Blend
Table 5 shows the anti-nutritional factors of the samples flakes. In all the cereals samples anti-nutritional values were lower values probably as a result of germinations Tannin was highest in sorghum (0.49- 0.95mg/gm) and lowest in corn (0.45 – 0.75mg/gm) at increasing values with the highest value at a 50% level. Phytate was highest in corn at decreasing value (0.53 – 1.07mg/gm) and lowest in sorghum at increasing value (0.22 – 0.47mg/gm). Saponin had lower values in all samples but the highest value was in corn at decreasing value (0.05-0.27mg/gm) and lowest in sorghum at increasing value (0.01-0.07). Oxalate was highest in corn at increasing value (0.20 -0.34mg/gm) and lowest in sorghum at increasing value (0.07- 0.42mg/gm). The reduction of anti-nutritional values in all samples must have been contributed by germination which has effects in reducing anti-nutritional factors in grains (Khandalwal et al., 2009). Tannin has the properties of chelating minerals intake and its lower level would enhance the quality of the meal (Chikwedu, 2003). Legumes have high content of phyrtic acid (Duhan et al., 2001) and Pigeon peas are high in oxalate, but germination has reduces it content which reduces its mineral chelating properties and lower limits have been recommended (Chikwedu, 2003).
Table 6: Color of Flake Samples
| Cereal Sample blends | Ratio % | L | a | b |
| CP1 | 100:0 | 34.18±0.19 a | 2.49±0.45 c | 2.20±0.06 c |
| CP2 | 80:20 | 30.42±0.19 b | 2.61±0.21 c | 2.99±0.12 a |
| CP3 | 70:30 | 30.19±0.19 bc | 2.33±0.35 c | 2.45±0.21 b |
| CP4 | 60:40 | 29.82±0.19 d | 3.51±0.19 b | 2.92±0.12 a |
| CP5 | 50:50 | 29.87±0.19 cd | 4.14±0.24 a | 2.99±0.06 a |
| MP1 | 100:0 | 35.43±0.63a | 2.67±0.19a | 0.55±0.17b |
| MP2 | 80:20 | 31.34±0.19c | 1.59±0.28b | 2.86±0.25c |
| MP3 | 70:30 | 30.15±0.11d | 0.79±0.52c | 3.85±0.23a |
| MP4 | 60:40 | 31.41±0.57c | 2.67±0.32a | 3.28±0.42a |
| MP5 | 50:50 | 33.21±0.41b | 2.73±0.27a | 3.21±0.19a |
| SP1 | 100:0 | 29.51±0.09a | 3.64±0.05b | 3.09±0.04b |
| SP2 | 80:20 | 28.93±0.11b | 2.83±0.06c | 3.61±0.21a |
| SP3 | 70:30 | 29.76±0.09a | 4.31±0.08a | 2.81±0.07c |
| SP4 | 60:40 | 29.42±0.33a | 3.74±0.12b | 2.79±0.09c |
| SP5 | 50:50 | 28.56±0.19c | 2.68±0.10c | 3.43±0.12a |
Values are means ± standard deviation of duplicate measurements. Means with the same superscript in the same column are significantly different at 0.05 levels.
Key: CP1-5 = Corn: Pigeon peas flours Blend; MP1-5 = Millet: Pigeon peas flour Blend; SP1-5 = Sorghum: Pigeon peas flour Blend
Table 6 shows the colour differential of flakes samples. The known color of corn flakes had deviations as the substitution increased. L value color decreased as the substitution increased among samples but had the highest value in millet (30.15 – 35) and lowest value in sorghum (2.42 -29.76). While differential deviation shows that substitution decreases the color of the flakes as they tends to go light brown from golden color. The a- value was highest in corn at 50% level (4.14), millet at 50% level (2.73) and sorghum at 30% level (4.31). while the b-value increased in corn both at 50% and 20% level (2.99), millet at 30% level (3.85) and sorghum at 20% level (3.61). Color in grains is often supplied by carotenoids (Vit. A precursor) and could be affected by heat (Yeum & Rusell, 2002).
Table 7: Sensory Evaluation of Flake Samples
| Cereal Sample blends | Ratio % | Appearance | Texture | Crunchiness | Color | Taste | Aroma | Overall Acceptability |
| CP1 | 100:0 | 6.40±1.50a | 5.50±0.95a | 6.30±1.49a | 5.00±1.45a | 5.10±1.37b | 6.10±1.17a | 6.84±1.26a |
| CP2 | 80:20 | 6.05±1.47a | 5.80±1.20a | 6.50±1.15a | 5.40±1.54a | 5.65±1.46ab | 5.80±1.58a | 6.68±1.06a |
| CP3 | 70:30 | 6.00±1.65a | 5.65±1.18a | 6.10±0.97a | 5.45±1.32a | 5.80±1.54ab | 5.25±1.25a | 6.26±1.33a |
| CP4 | 60:40 | 5.65±1.18a | 5.90±1.48a | 6.00±1.38a | 5.45±1.43a | 6.05±1.28ab | 5.60±1.57a | 6.21±1.58a |
| CP5 | 50:50 | 5.45±1.28a | 6.00±1.45a | 5.90±1.25a | 5.60±1.54a | 6.15±1.35a | 6.00±2.05a | 6.84±1.30a |
| MP1 | 100:0 | 6.50±1.50a | 6.25±1.41a | 6.00±1.72a | 6.50±1.50a | 6.85±1.57a | 6.85±1.53a | 6.55±1.79a |
| MP2 | 80:20 | 6.25±1.59a | 6.40±1.54a | 6.30±1.92a | 6.25±1.59a | 6.55±1.50ab | 6.20±1.44a | 5.95±1.50a |
| MP3 | 70:30 | 5.95±1.61a | 6.55±1.61a | 6.75±1.59a | 5.95±1.61a | 5.75±1.48b | 7.05±1.39a | 6.65±1.18a |
| MP4 | 60:40 | 5.85±1.57a | 7.10±1.37a | 5.95±1.50a | 5.85±1.57a | 6.30±1.53ab | 6.75±1.83a | 6.10±2.10a |
| MP5 | 50:50 | 6.20±1.74a | 6.25±1.48a | 6.40±1.96a | 6.20±1.74a | 6.30±1.38ab | 6.65±1.69a | 5.80±1.74a |
| SP1 | 100:0 | 7.05±1.47a | 7.00±1.86a | 7.20±1.58a | 7.05±1.47a | 6.50±1.19b | 7.20±1.20a | 7.70±1.17a |
| SP2 | 80:20 | 6.75±1.41a | 6.65±1.27a | 7.15±1.95a | 6.75±1.41a | 7.75±1.21a | 7.15±1.42a | 7.15±1.14a |
| SP3 | 70:30 | 6.20±1.70a | 7.15±1.35a | 6.90±1.94a | 6.20±1.70a | 6.40±1.82b | 6.45±1.90a | 7.20±1.20a |
| SP4 | 60:40 | 6.80±1.70a | 6.60±1.50a | 6.20±1.96a | 6.80±1.70a | 6.90±1.71ab | 6.60±1.14a | 5.90±2.13b |
| SP5 | 50:50 | 6.60±2.11a | 6.50±1.96a | 6.80±1.61a | 6.60±2.11a | 6.60±1.79b | 6.70±1.92a | 6.85±2.03ab |
Values are means ± standard deviation of duplicate measurements. Means with the same superscript in the same column are significantly different at 0.05 levels.
Key: CP1-5 = Corn: Pigeon peas flours Blend; MP1-5 = Millet: Pigeon peas flour Blend; SP1-5 = Sorghum: Pigeon peas flour Blend
Table 7 shows the sensory scores of the samples analyzed. Sensory scores show that substitution level affected attributes rating. In terms of appearance sorghum flakes had the highest rating at 40% level and corn the lowest at 20% level. Texture ranking was highest in sorghum at 30% level and lowest in corn at 50% level. Crunchiness had highest rank in sorghum at 30% level and lowest in corn at 20% level. Color had the highest ranking in sorghum at 100% level and lowest in corn at 50% level. The taste had the highest ranking in sorghum at 20% level and lowest in corn at 50% level. The aroma had the highest value in sorghum at 100% level and the lowest value in corn at 100% level. In the overall acceptability ranking sorghum was the most acceptable (5.90 – 7.70) followed by corn (6.21 – 6.84) and millet (5.80 – 6.65). In overall acceptability sorghum was highly rated at 100% level and lowest rating in corn at 50% level. Taste and aroma differential might have been contributed by increased protein, sodium and beany flavor of pigeon peas.
CONCLUSION AND RECOMMENDATION
These results show that germination of grains and substitution of the cereals with pigeon peas legumes increased nutritive values and functional and acceptability of the flakes product. The addition of pigeon peas at lower levels to sorghum up to 30% level substitution makes the product more acceptable than corn indicating that corn can also be replaced by other draught resistance cereals in breakfast cereals formulation and production.
REFERENCES
- (2012). Association of Official Analytical Chemists. Official Method of Analysis of the AOAC. 20th Ed, Washington; D.C;
- Armad, V Cardello, Howard G. Schutz, (2006). Sensory Science Measuring Consumer Acceptance. In: Handbook of Food Science, Technology and Engineering, Y. H. Hui, New York: Taylor & Francis, 2006, pp56-1-56-21.
- Awoyinka, O.A, A.O. Ileola, C.N, Imeoria, S.T.Asaolu. (2016). Nutritional Quality of some Wild and Edible Beans in Nigeria. Scientific Research. Vol. 3 No 2.
- Chikwendu, N. J. (2003). The effects of germination on the chemical composition and quality of ground bean (Kerslingisella geocarpa) flours. Nigerian Journal of Nutritional Sciences. 2003; 24(1):17-22.
- Duhan, A., Khetarpaul, N. and Bishnoi, S. (2001). Effect of soaking, germination and cooking on phytic and hydrochloric acid extractability of a pigeon pea cultivar. J Food Sci Technol. 38: 374-378.
- Egli I, Davidsson L, Juillerat M, Barclay D, Hurrell R. (2002). The influence of soaking and germination on the phytase activity and phytic acid content of grains and seeds potentially useful for complementary feedin. J Food Sci 67:3484-8.
- Fasoyiro, S. B., Akande, S. R., Arowora, K. A., Sodeko, O. O., Sulaiman, P.O., Olapade, C. O., & Odiri, C. E. (2010). Physico-chemical and sensory properties of pigeon pea (Cajanus cajan) flours. Afr. J. Food Sci., 4, 120–126.
- Fasoyiro, S. B., &Arowora, K. A. (2013). Chemical, pasting and sensory properties of whole Fermented maize (ogi) fortified with pigeon pea flour. Int. J. Bio. Food Veter. Agric. Eng., 7, 218–220.
- FAO, (2009). Food and Agriculture Organization of the United Nations, Statistics Division, maize, rice and wheat: Area harvested, production quantity, and yield. Retrieved September 9, 2015.
- FAO/WHO (2002). Human vitamin and mineral requirement. Report of a Joint FAO/WHO Expert Consultation, Bangkok, Thailand, pp 151-18).
- Gao, Y.C, Shang, M.A, Sanghai Mafoof, R.M. Biyasheve, E.A. Grabau, P. Kwanyuen, J.W. Burson, G.R Buss, (2007). A modified colorimetric method for phytic acid analysis in soybean. Crop Science 47:1, 1797-1803.
- Hamid Morsyziena and Ahmaed Hamid Morsyziena. (2022). Nutritious Novel Snacks from some of cereals, legumes and skimmed milk powder. Applied Food Research, Vol. 2 Issue 1.
- He FJ, GA MacGregor, (2008). A Comprehensive review on Salt and Health and current experience of worldwide salt reduction programme. Journal of Human Hypertention, 1-22.
- Hererich, M.J and Smith, P.A, (2005). Analysis of grape and wine tannins: Method, application and challenges. Aust. J. Grape Wine Res 11(2), 205214
- Holmes, R.P, Kennedy M. (2000). Estimation of the oxalate content of Food and daily oxalate intake. Kidney Int. 57 (4): 1662-7
- Ibeogu, I.H., (2020). Production and Evaluation of Weaning Food Made from Mungbean (Vignaradiata (L.), Millet and Tigernut (Cyperus Esculentus) Flour Blends. International Journal of Research and Scientific Innovation (IJRSI), 7(7), 16-20.
- Iwe, M.O, U. Onyeukwu and A.N. Agiriga (2016). Proximate, functional and Pasting properties of FARO 44 rice, African yam beans and brown cowpea seed composite flour, Cgent Food & Agriculture , 2:1142409J
- Jacob & Teresa (2007). “Why Were Corn Flakes Invented? The Amazing History”. Owl Donna J. Kaiser. Retrieved October 21, 2015.
- Rhythm Kalsi, Jasleen Bashir, Guidan Goilsen piyyushkashyap, (2023). Exploration of Nutritional, Plasmascology and the processing trend for valorization Overview of finger Millet (Eleusine coracans).Food Sci.& Nutri.11 (7). DOI 101002
- Kellogg’s, (2010). Fast Facts”. Kellogg’s. Archived from the original on December 4, 2010. Retrieved October 3, 2011.
- Khandelwal, S., Udipi, S.A. and Ghugre, P. (2009). Polyphenols and tannins in Indian Pulses: Effect of soaking, germination and pressure cooking. Food Research International Article in press,journal homepage: www.elsevier.com/locate/ Foodres.
- Lalit Kumar, R.K. Neresh, Himanshu Tiwari, Ram Pratap Singh, (2022). Millet for food and Nutritional Security in the Contex of Climate Resilient Agriculture: A review. International Journal of Plant & Soil Science. 34 (23): 939
- Morales-Medina, R., Mar Munio, M. D., Guadix, E. M., & Guadix, A. (2012). Production of Resistant starch by enzymatic disbranching in legumes. J. Carb. Polymers, 101, 1176–1183.
- Okpala, L. C., & Okoli, E. C. (2011). Formulation and evaluation of cookies containing germinated pigeon pea, fermented sorghum and cocoyam flour blends using mixture response surface methodology. Adv. J. Food Sci. Tech., 3, 366–375.
- Power, Hillary J, Mark Stephens, Jean Rusell and Marilyn H.Hill. (2016). Fortified Breakfast Cereals Consumed Daily for 2 wks Leads to Significant Improvement in micronutrient intake and micronutrient status in adolescent girls , a randomized controlled trial. Nutrition Journal. 15:69.
- Rosegrant MR, Ringler C, Sulser TB, Ewing M, Palazzo A, Zhu T (2009) Agriculture and food Security under global change: prospects for 2025/2050. IFPRI, Washington, DC
- Saxena, K.B., Kumar, R.V. and Rao, P.V. (2002). Pigeon pea nutrition and its Improvement. In: Basra AS, Randhawa IS (eds) Quality improvement in field crops, Food Products Press pp 227-260.
- Sebastia, V.R., Barbera, R.F. and Lagarda, M.J. (2001). Effects of legume processing on calcium, iron and zinc contents and dialysabilities. J Sci Food Agric. 81: 1180-1185.
- Serna –Saldivar, S.O, (2010). Quality Control of the Cereal Grains & Their Products: Cereal Grains Properties, processing and Nutritional Attributes, CRC Press, Taylor & Francis Group, pp 491-493.
- Shiferaw B, Prasanna BM, Hellin J, Banziger M (2011) Crops that feed the world. 6. Past Successes and future challenges to the role played by maize in global food security. Food Sec 3:307–327.
- Tanwar Ronak, Anil Rangha, Gaurav Chaudhary, Anju Kumani, Navnidhi Chhikara. (2023). Nutritional,Phytochemical and Functional Properties of Sorghum: A review. Food Chemistry Advances, Vol.3, 100501.
- Trinidad, P. T., Mallillin, A. C., Loyola, A. S., Sagum, R. S., &Encabo, R. R. (2010). The Potential health benefits of legumes as a good source of dietary fibre. Bri. J. Nutr., 103, 567–574
- USDA (2012). U.S. Department of Agriculture, Agricultural Research Service. 2012. USDA National Nutrient Database for Standard Reference, Release 25. Nutrient Data Laboratory Home Page, http://www.ars.usda.gov/ba/bhnrc/ndl
- Yeum, K.J. and Russell, R.M. (2002). Carotenoid bioavailability and bioconversion. Annu Rev Nutr 22: 483-504.